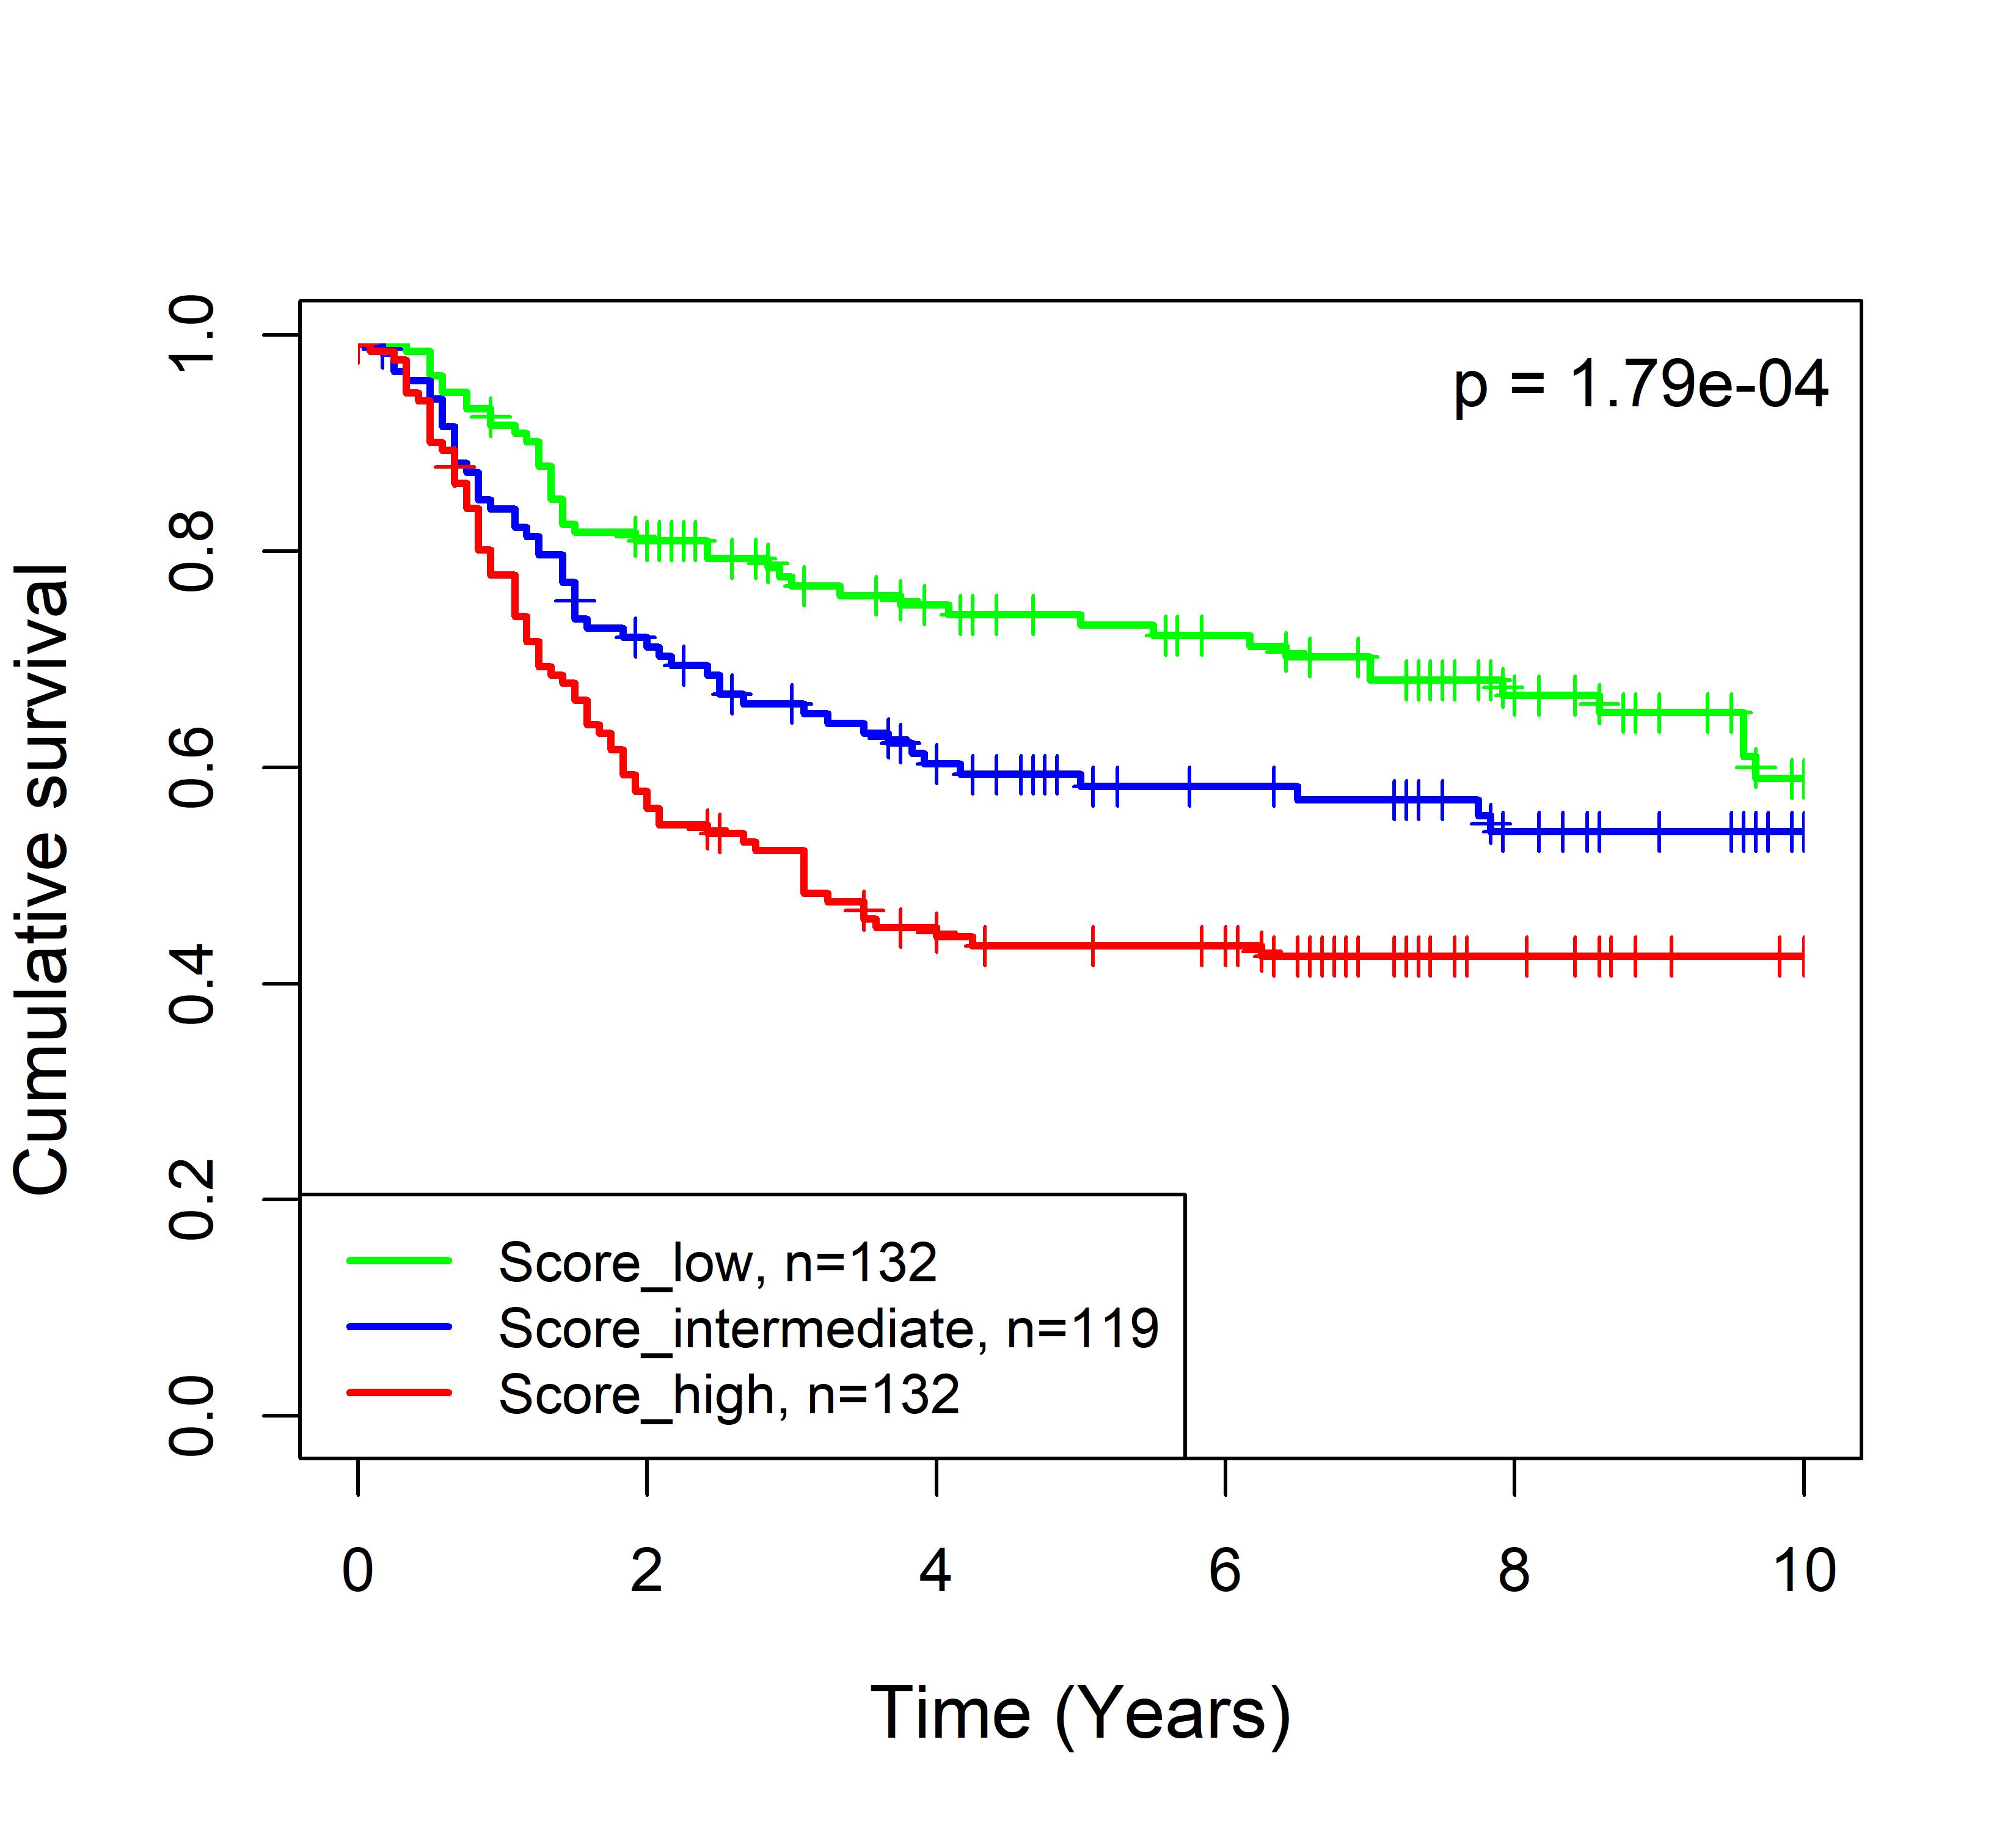
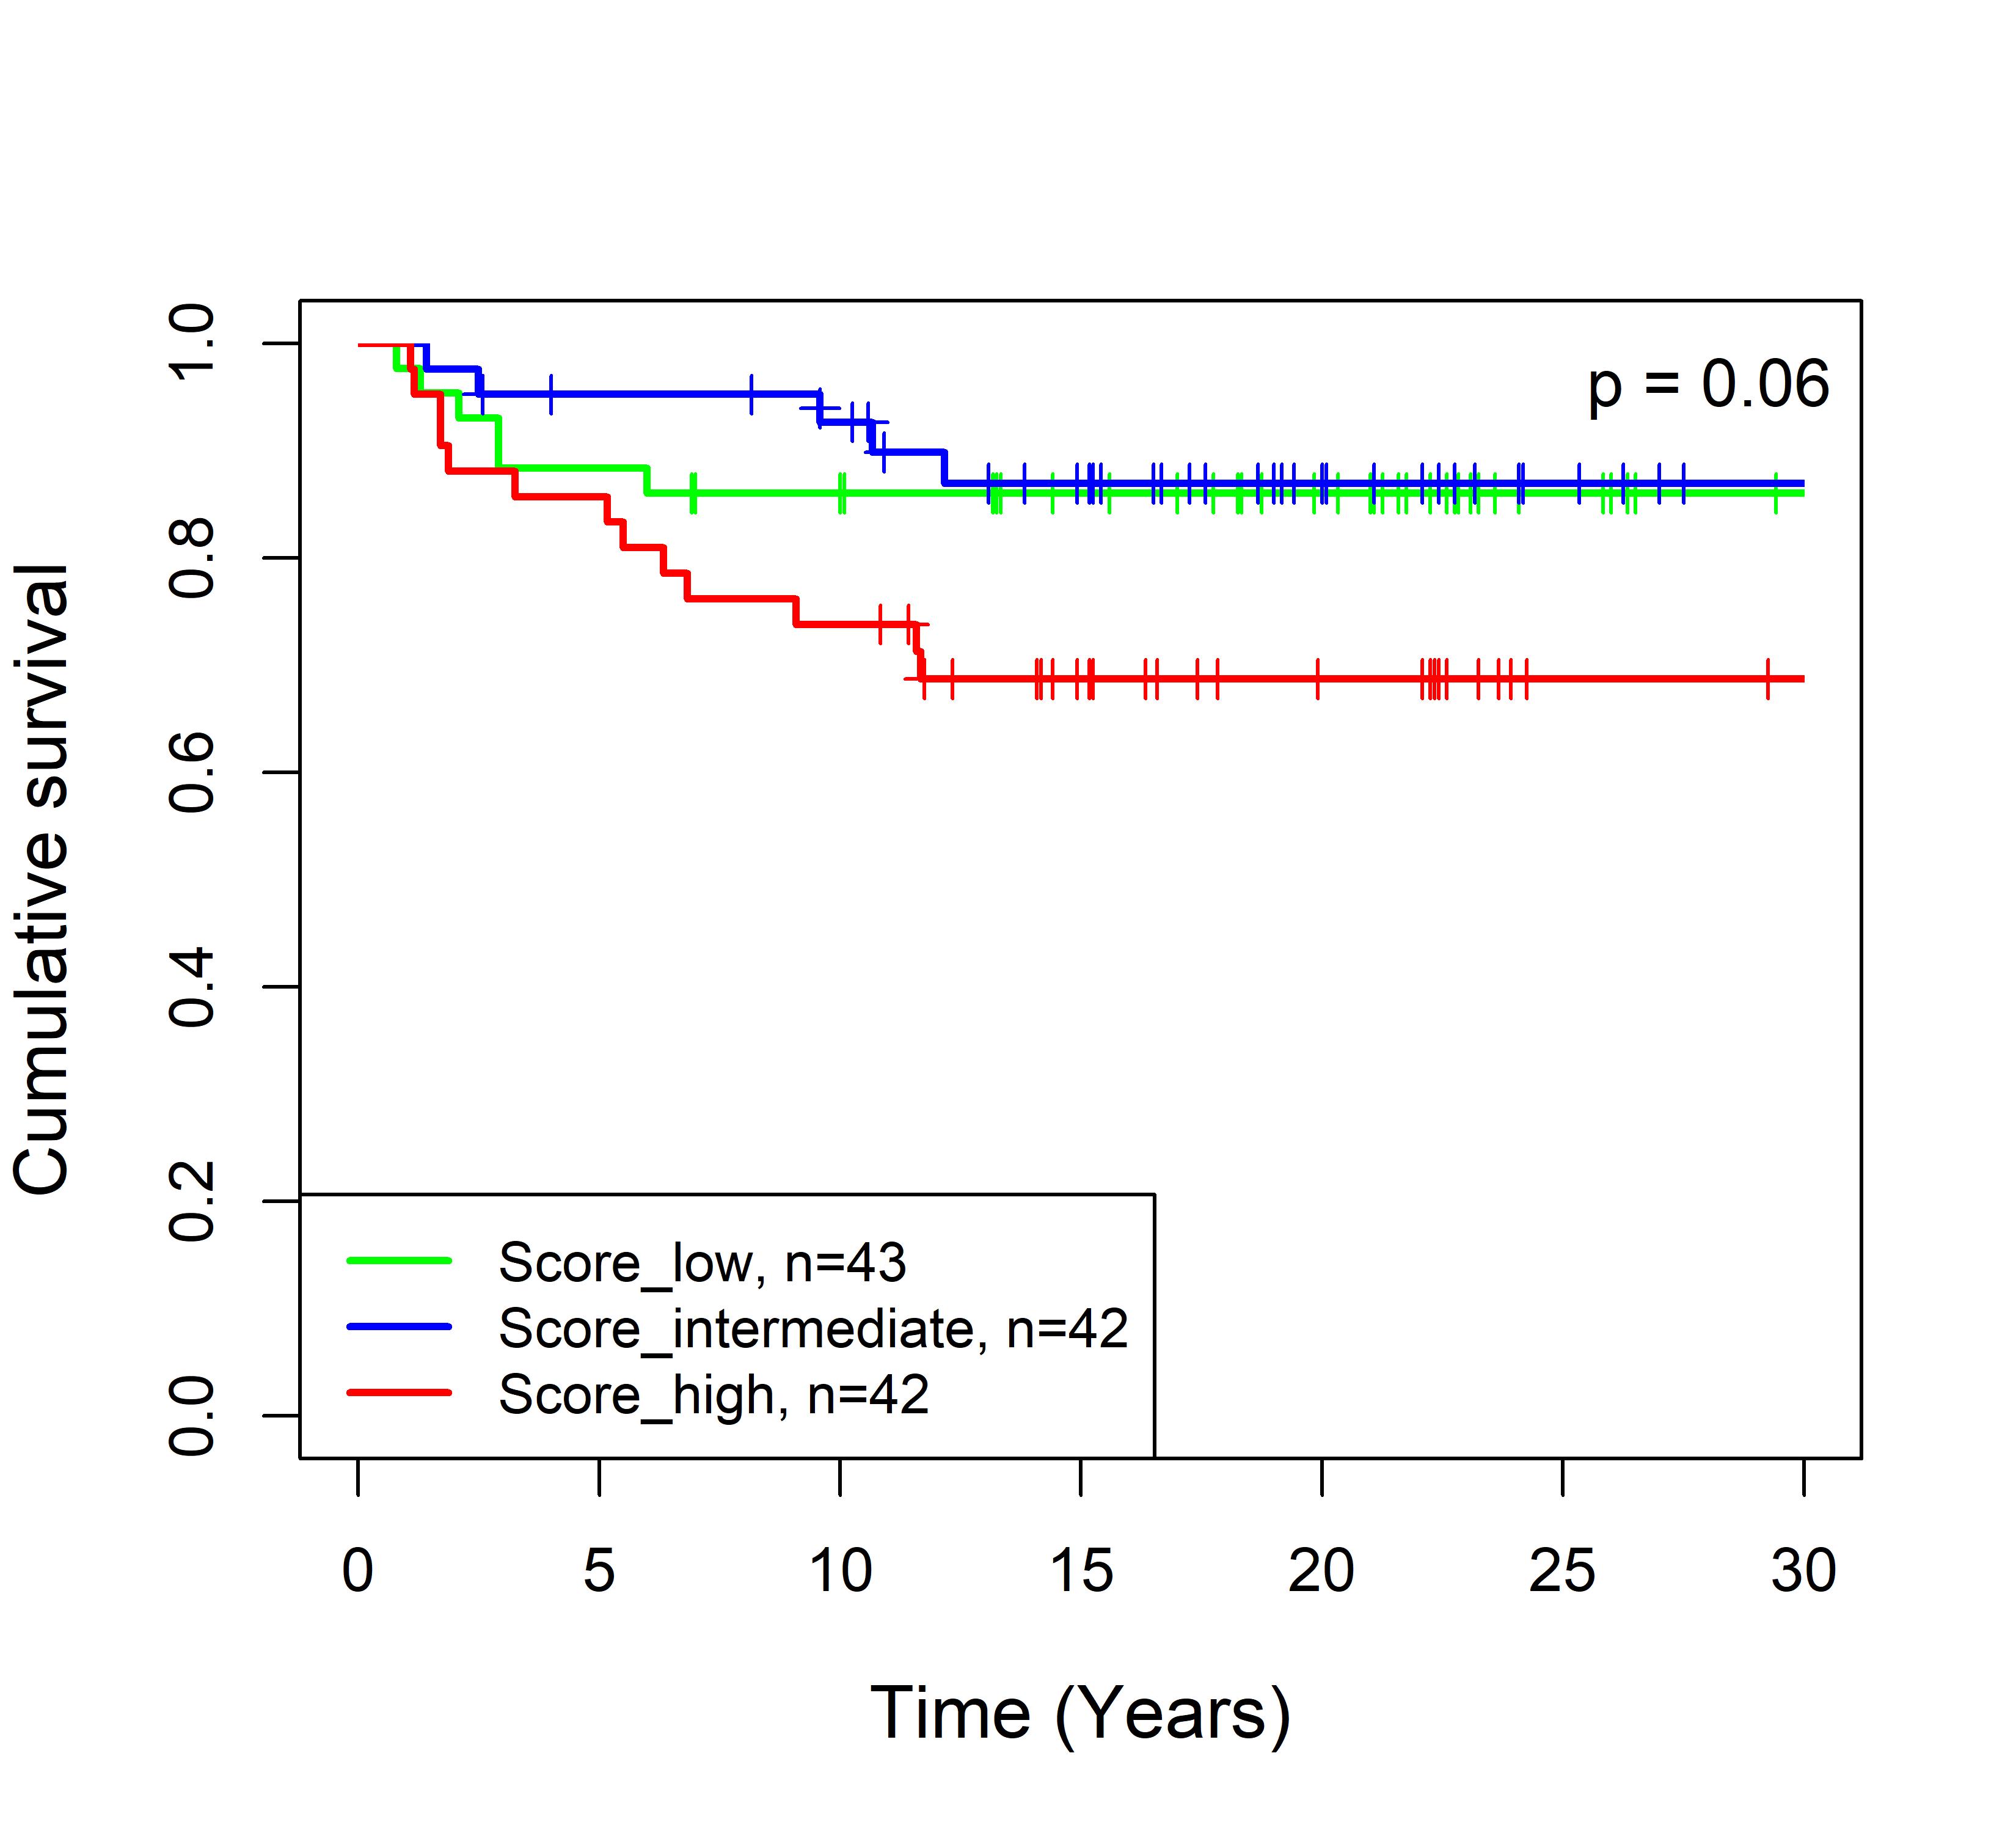
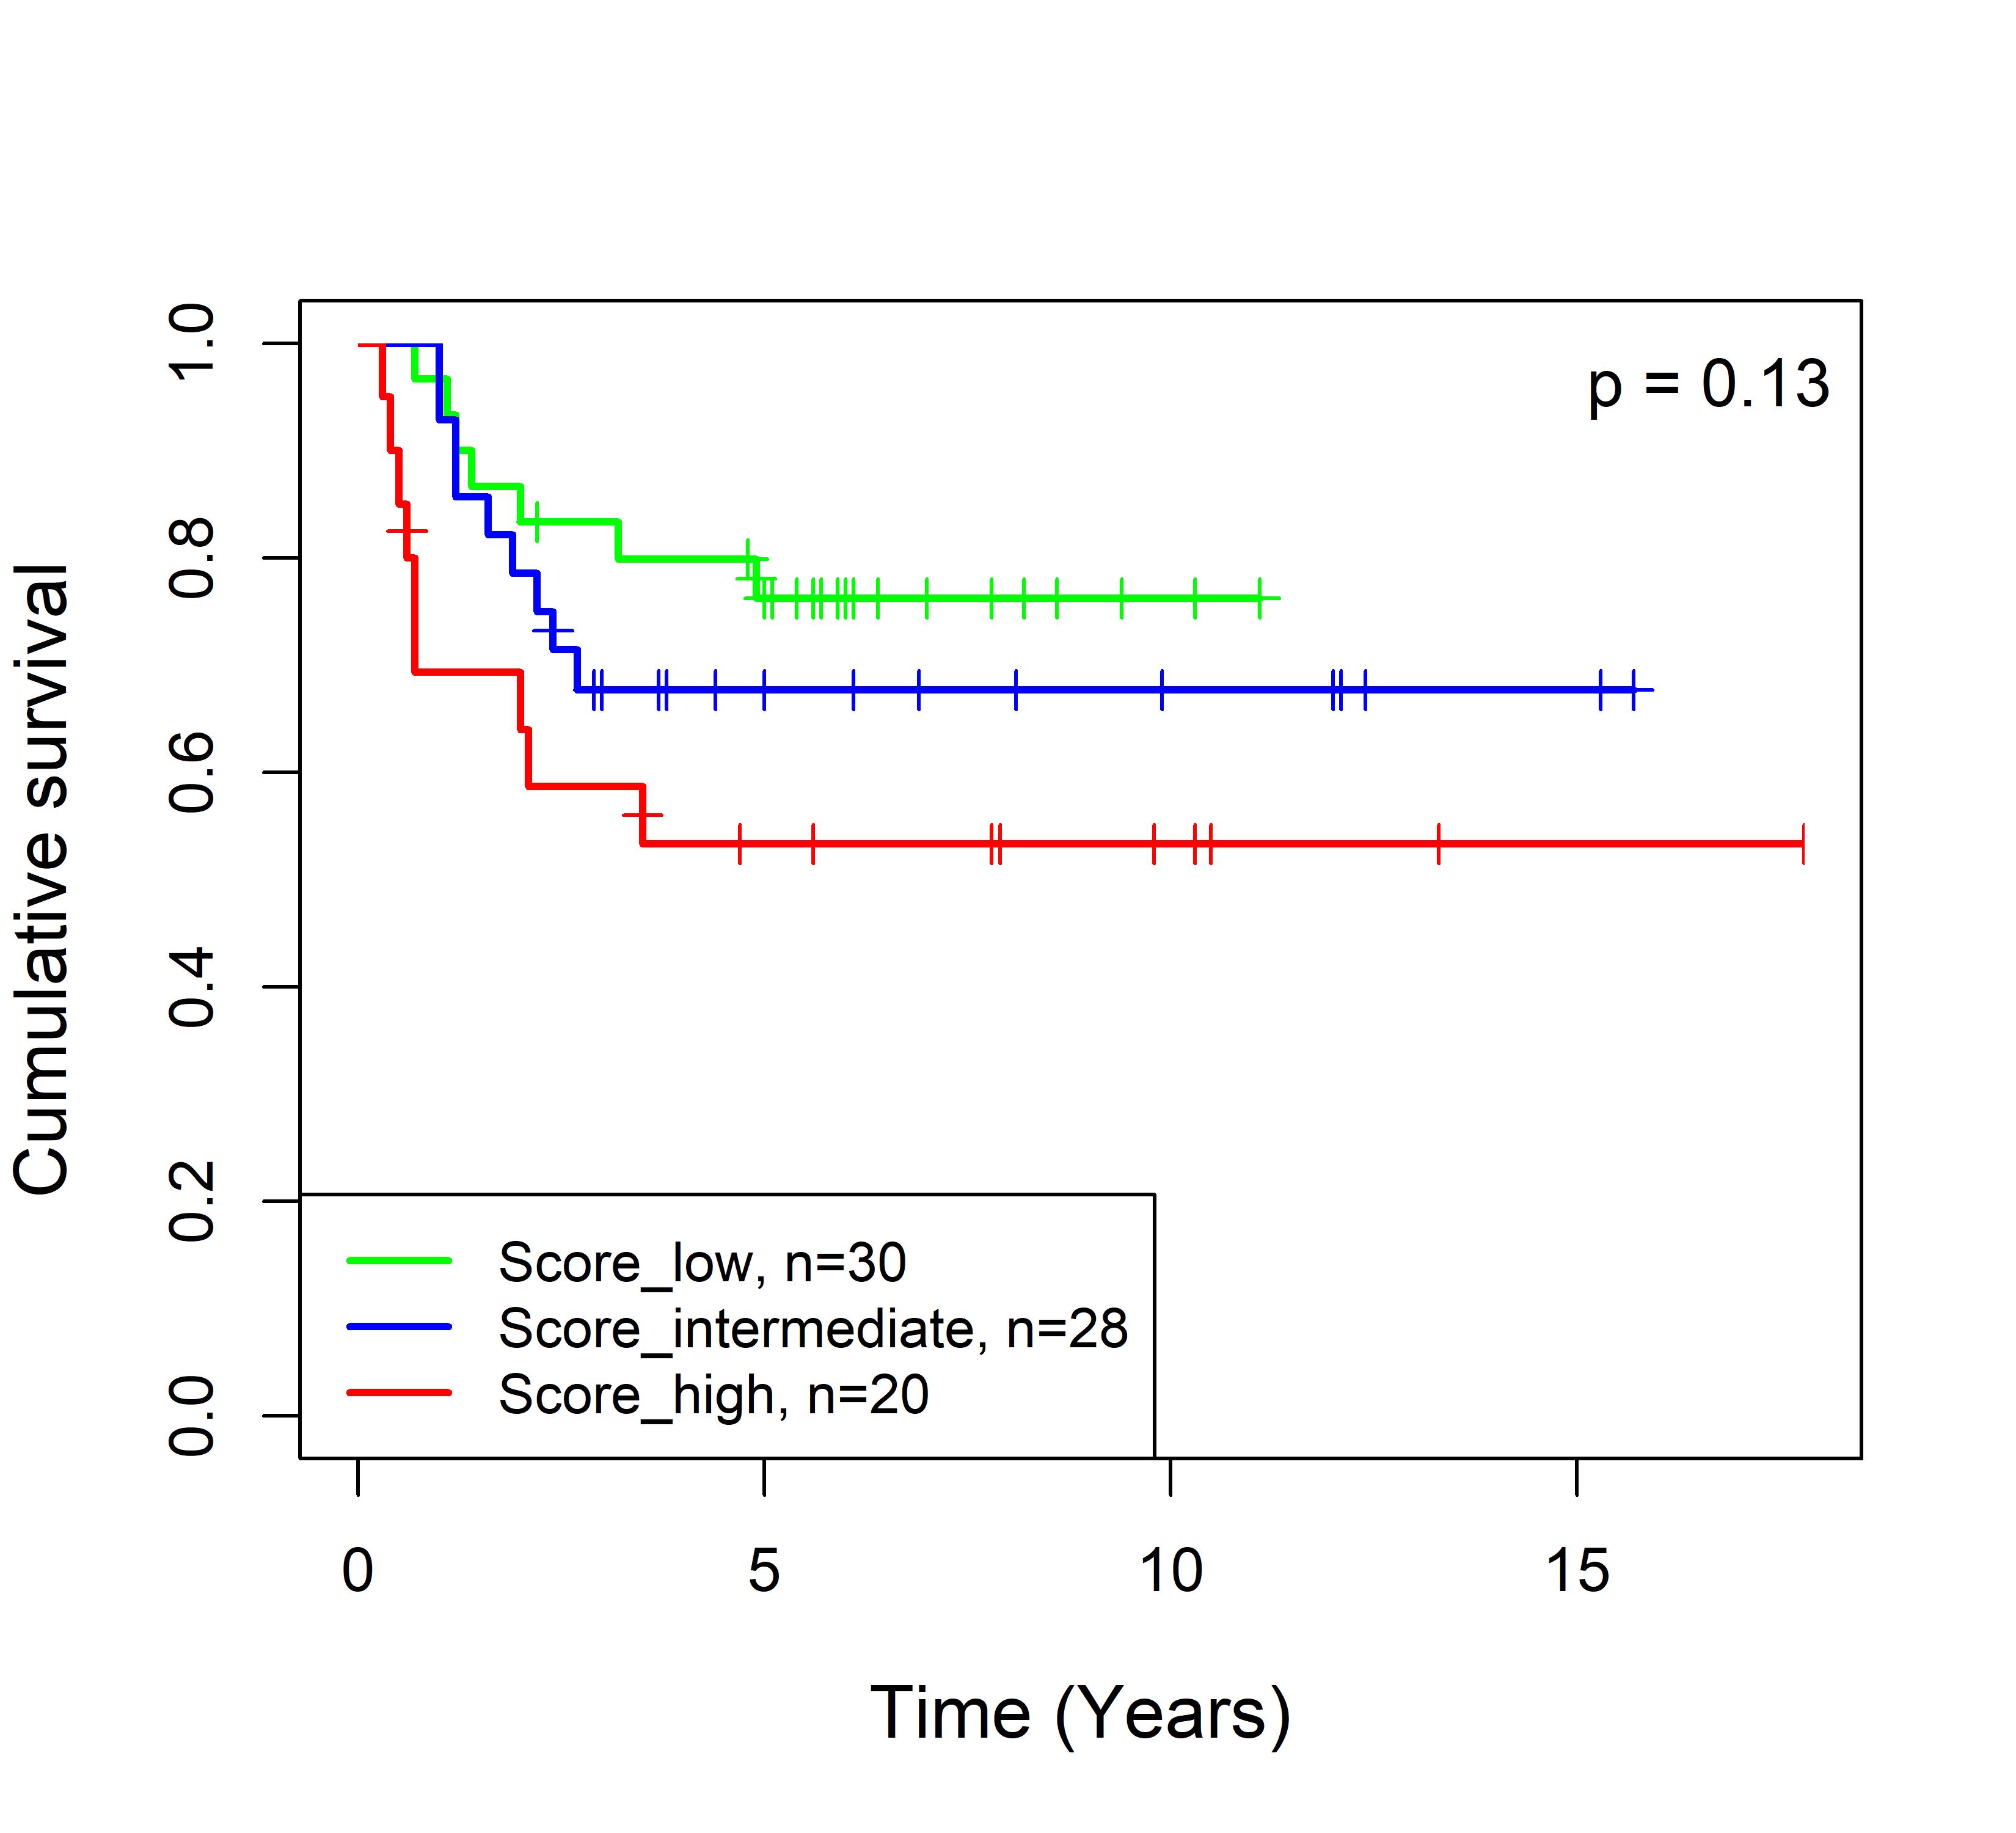
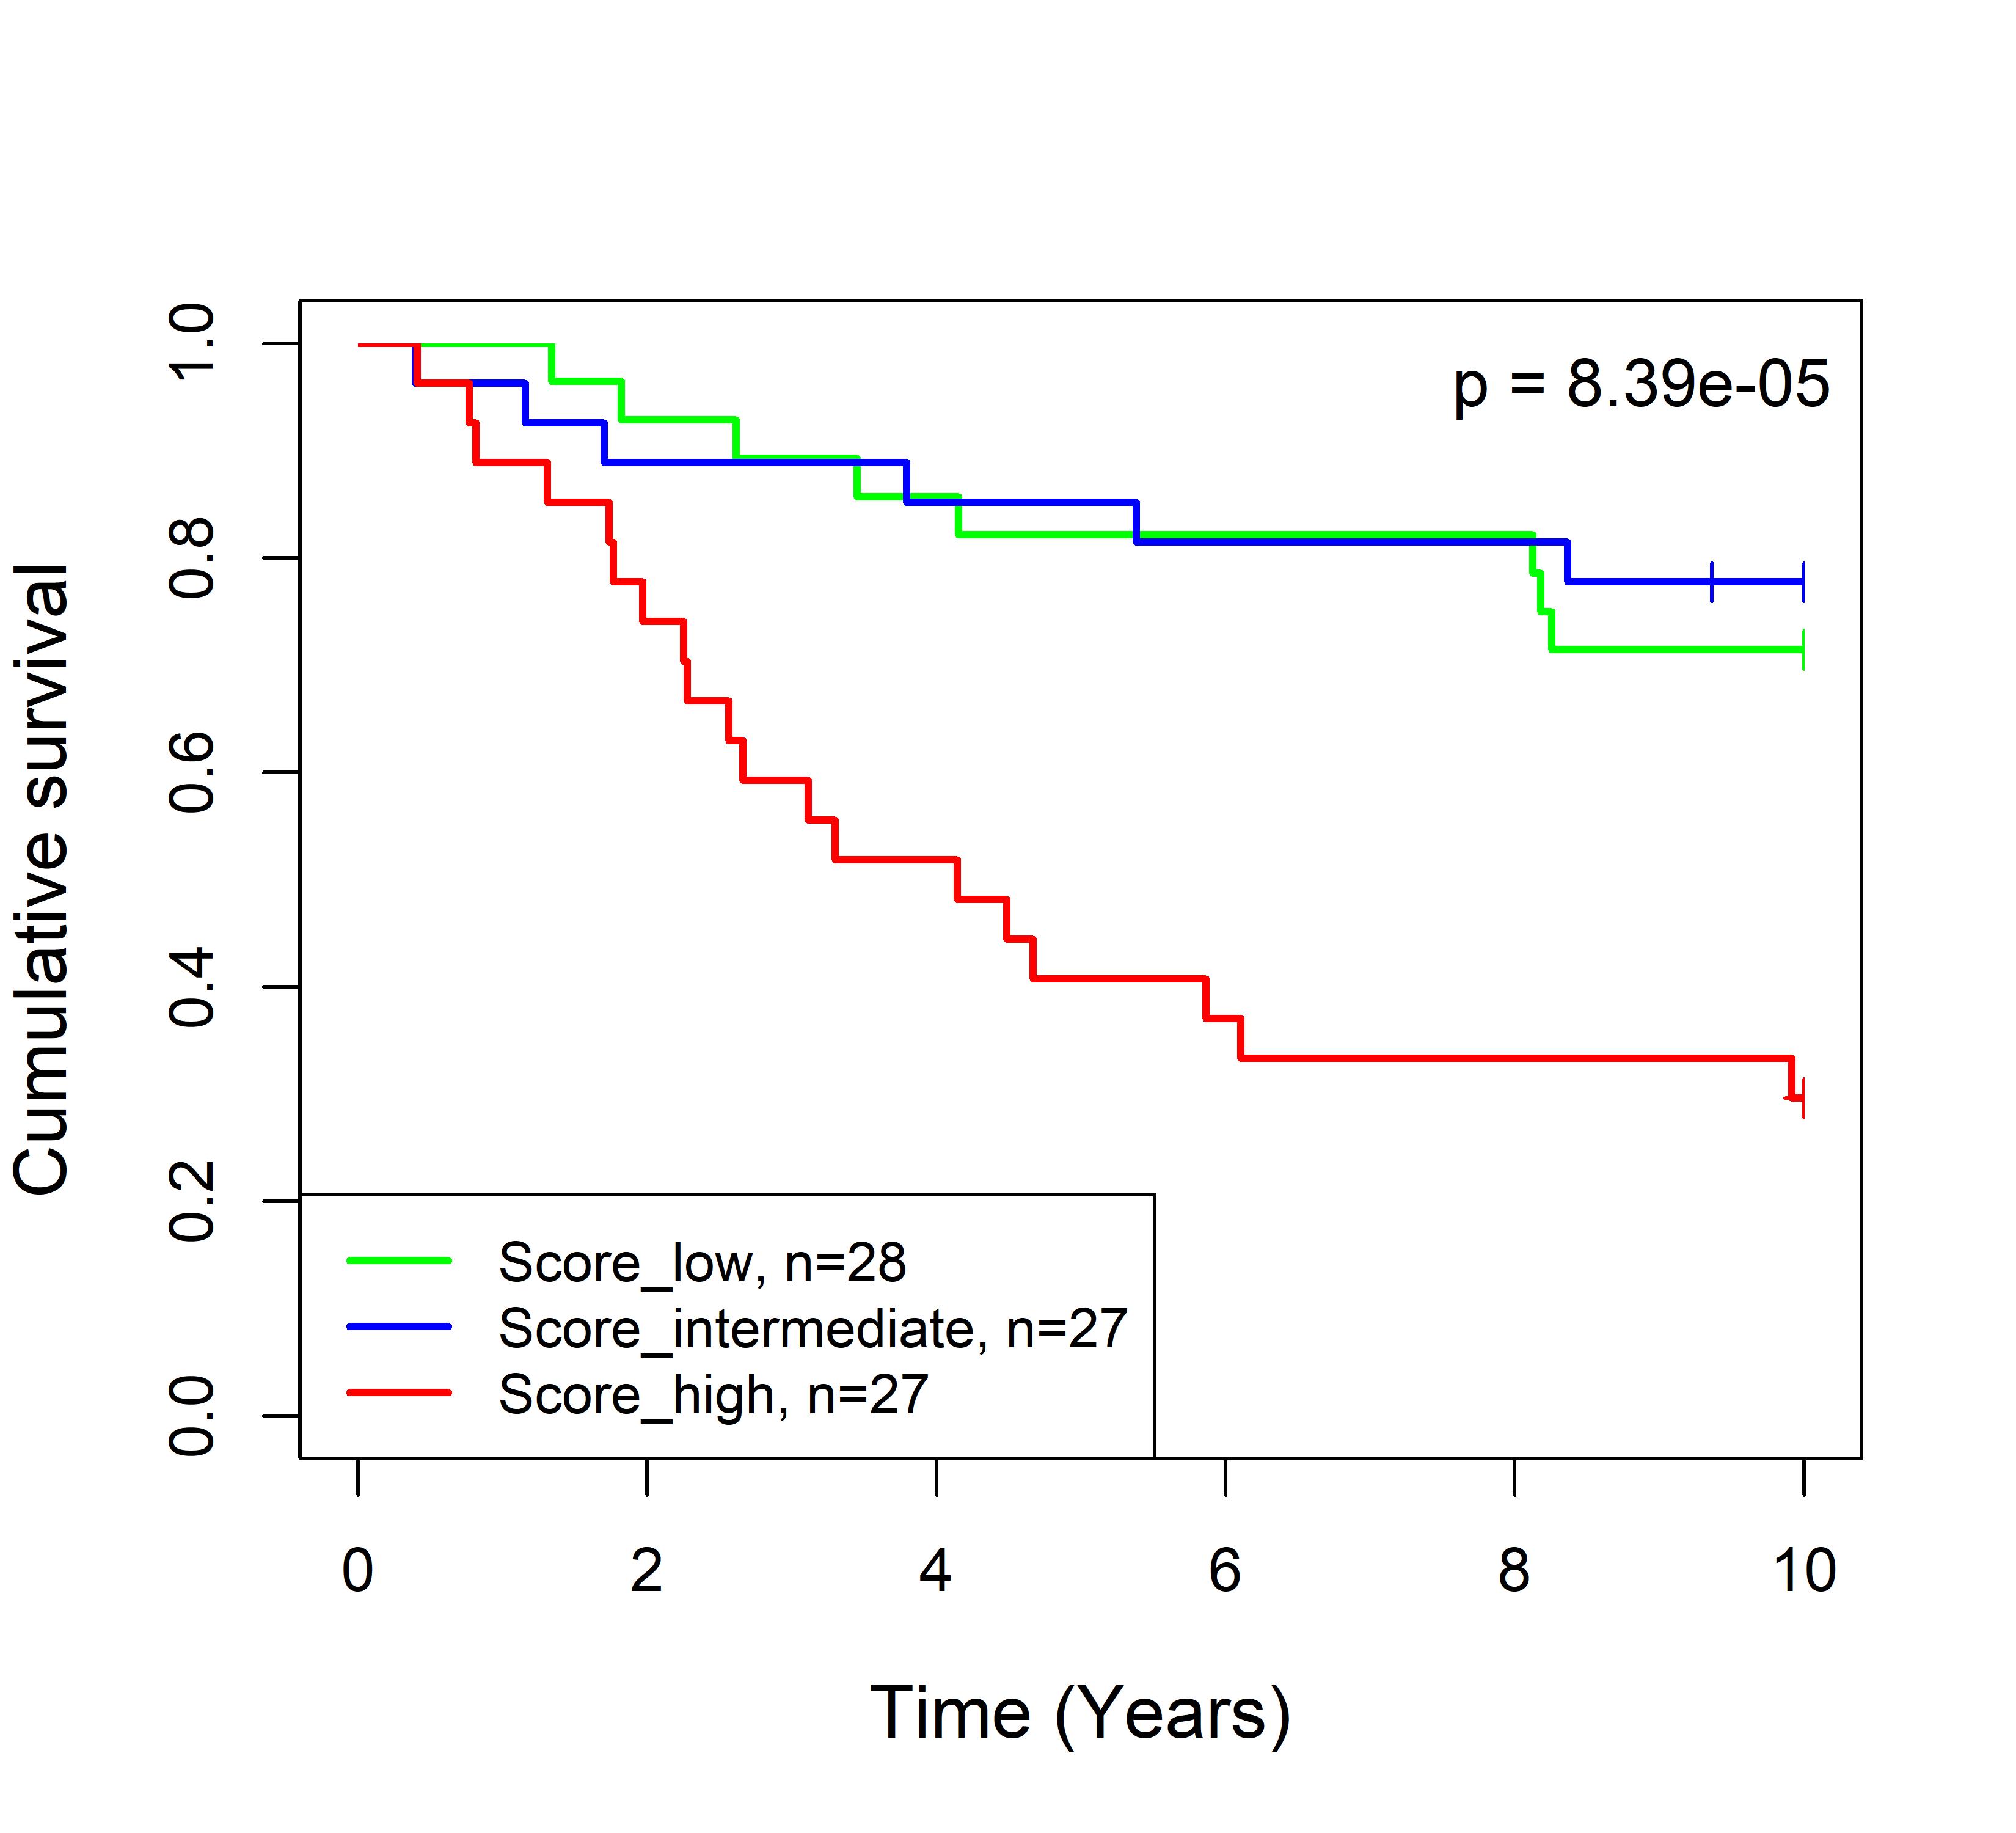
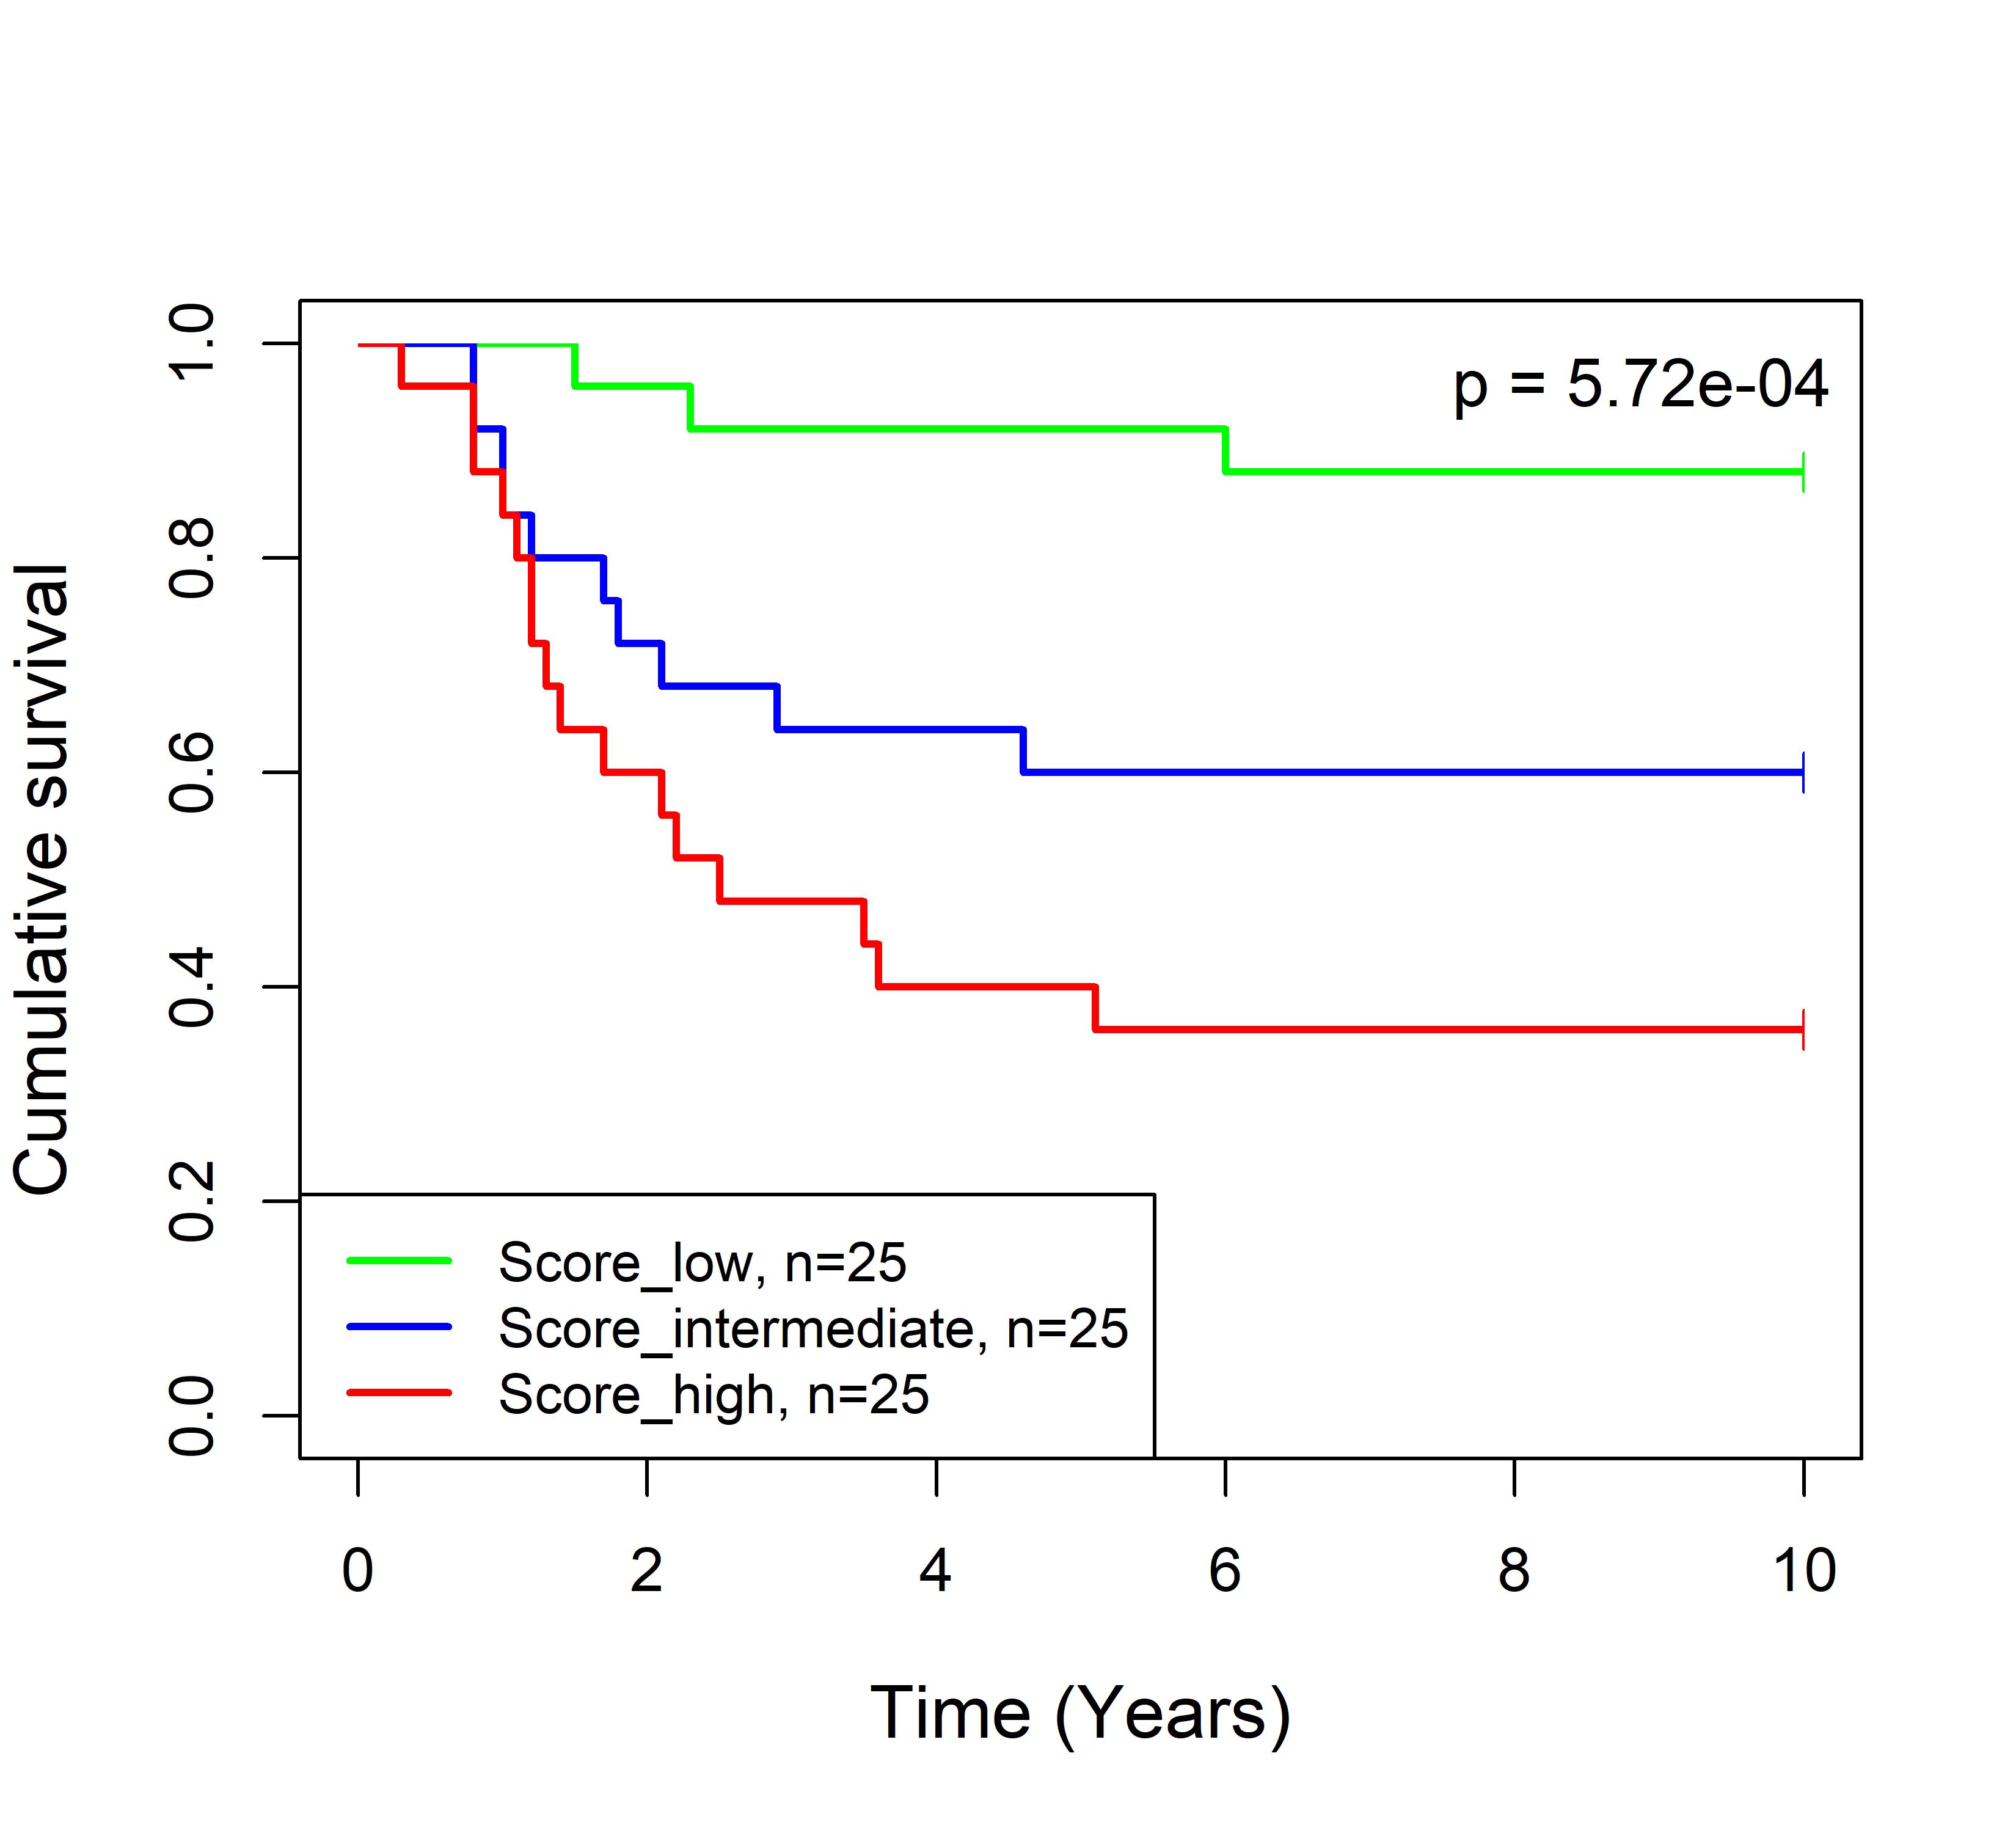
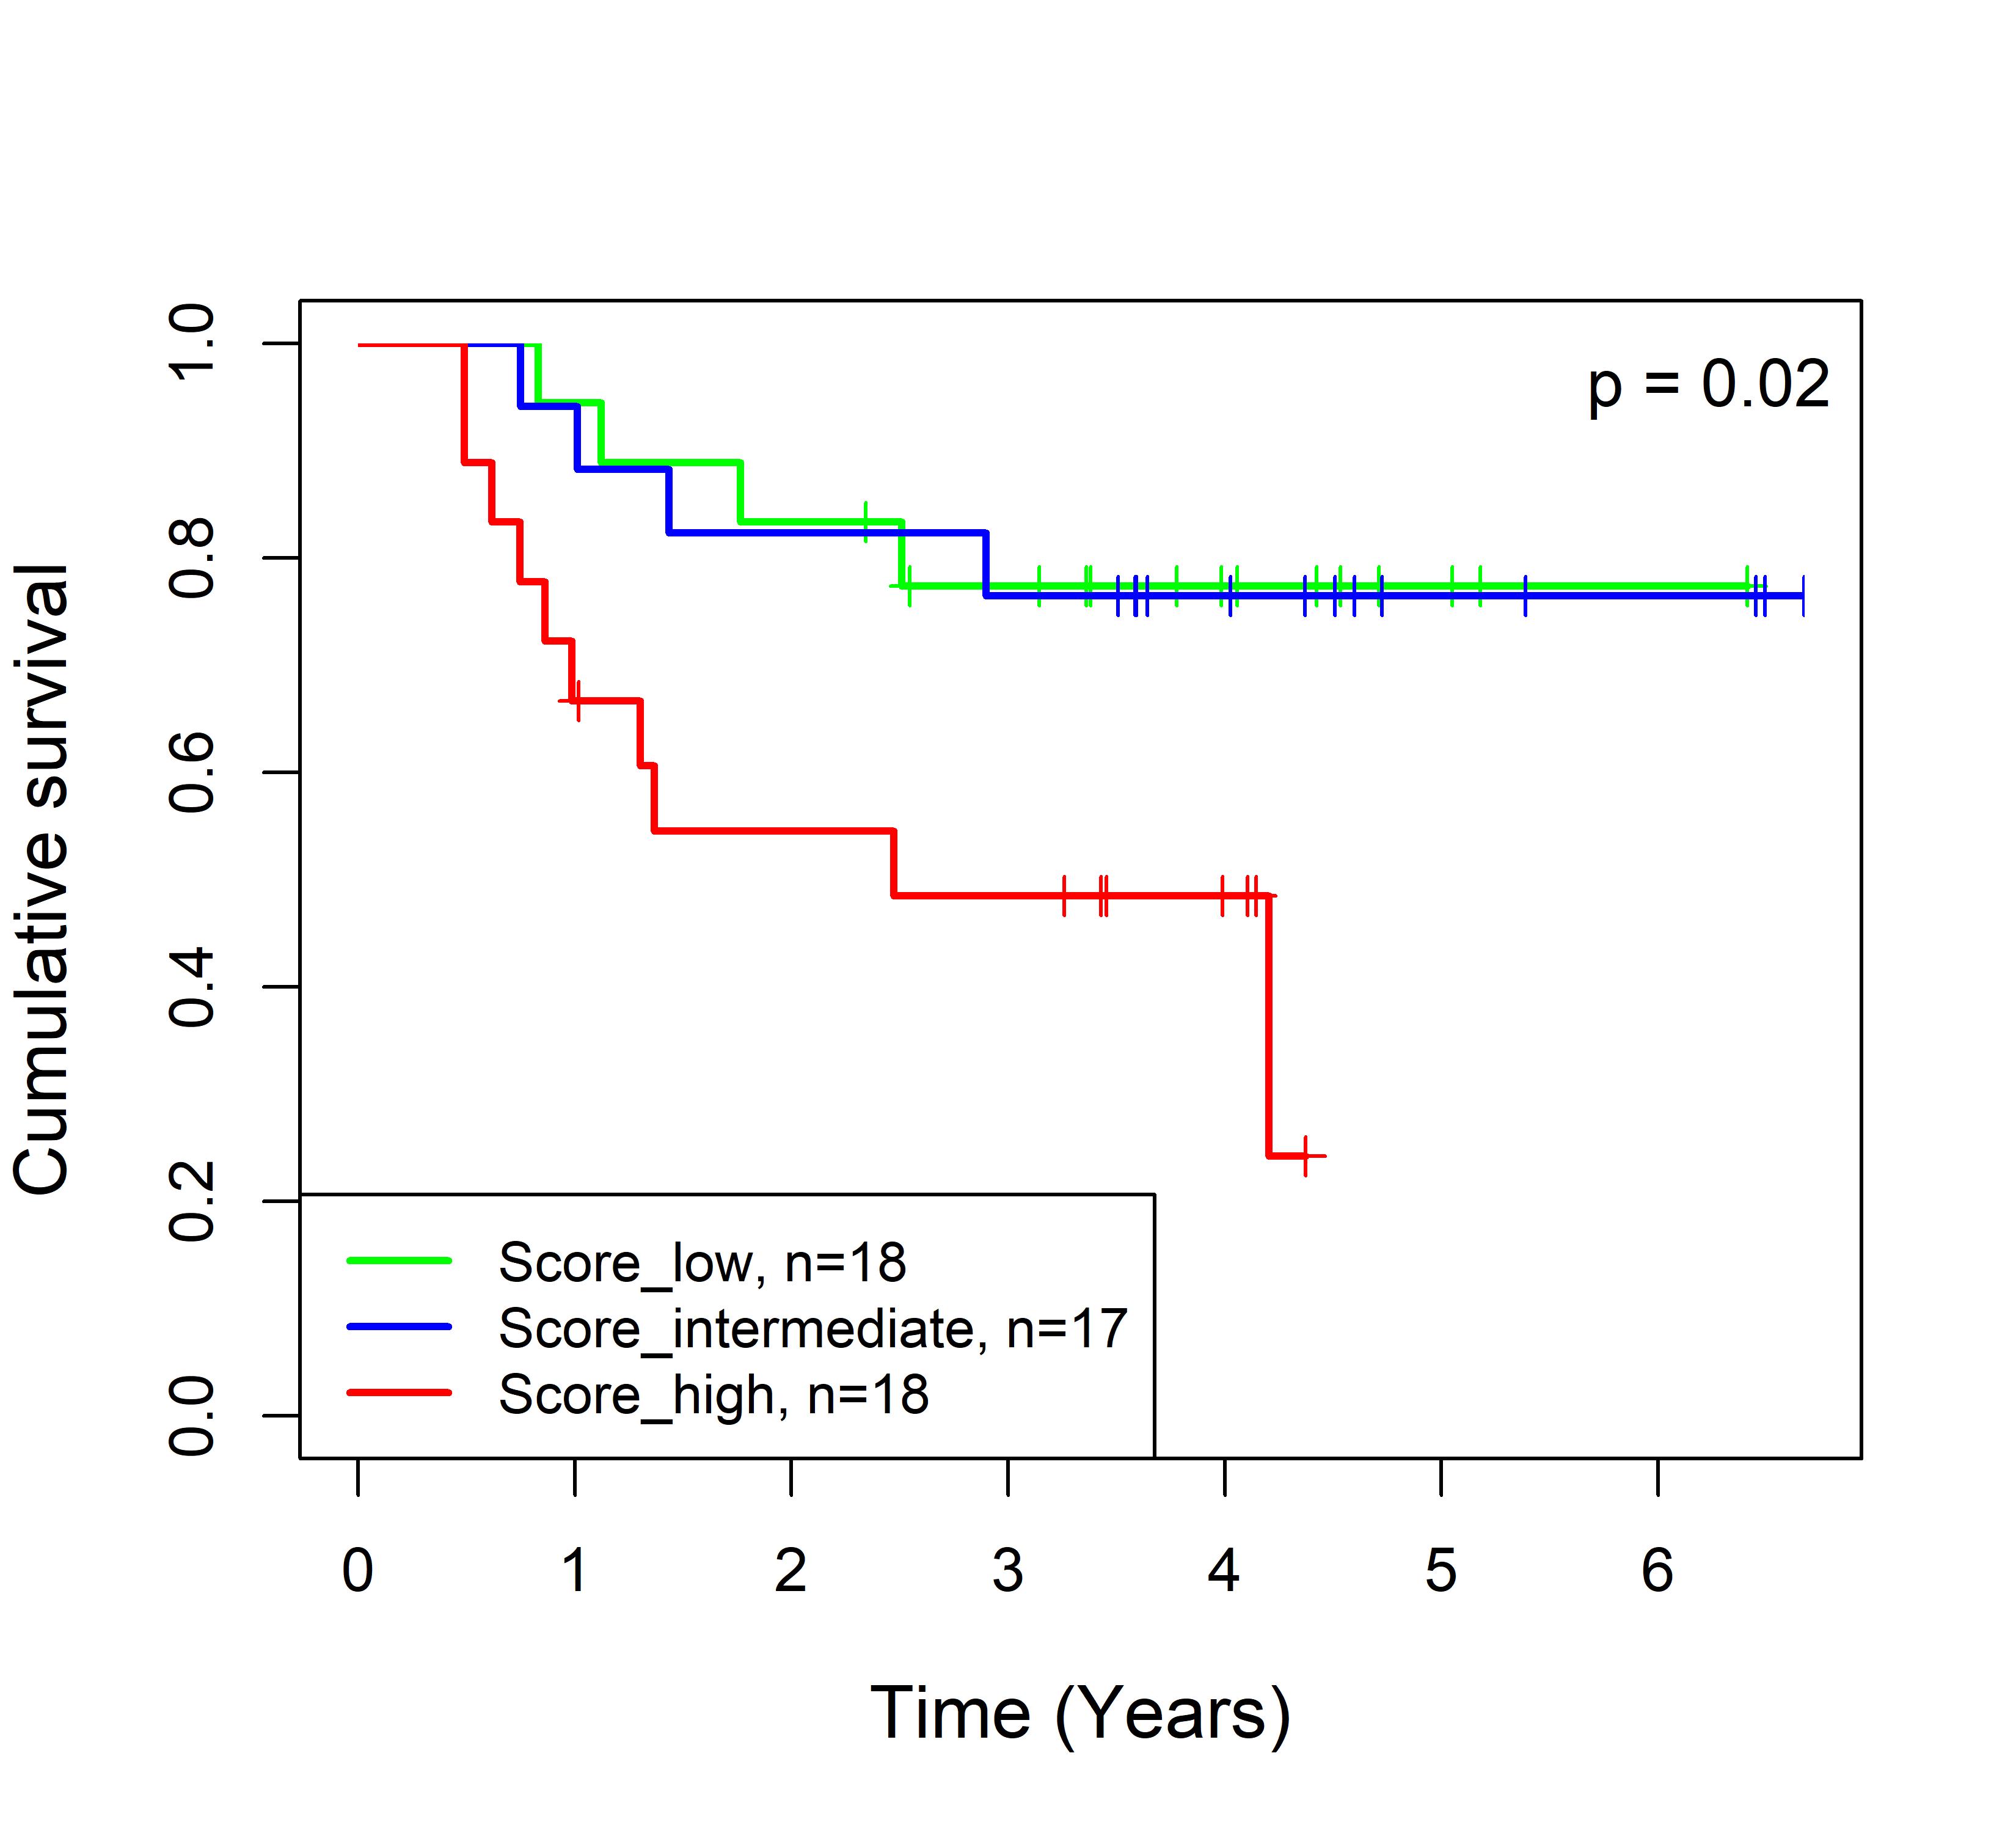
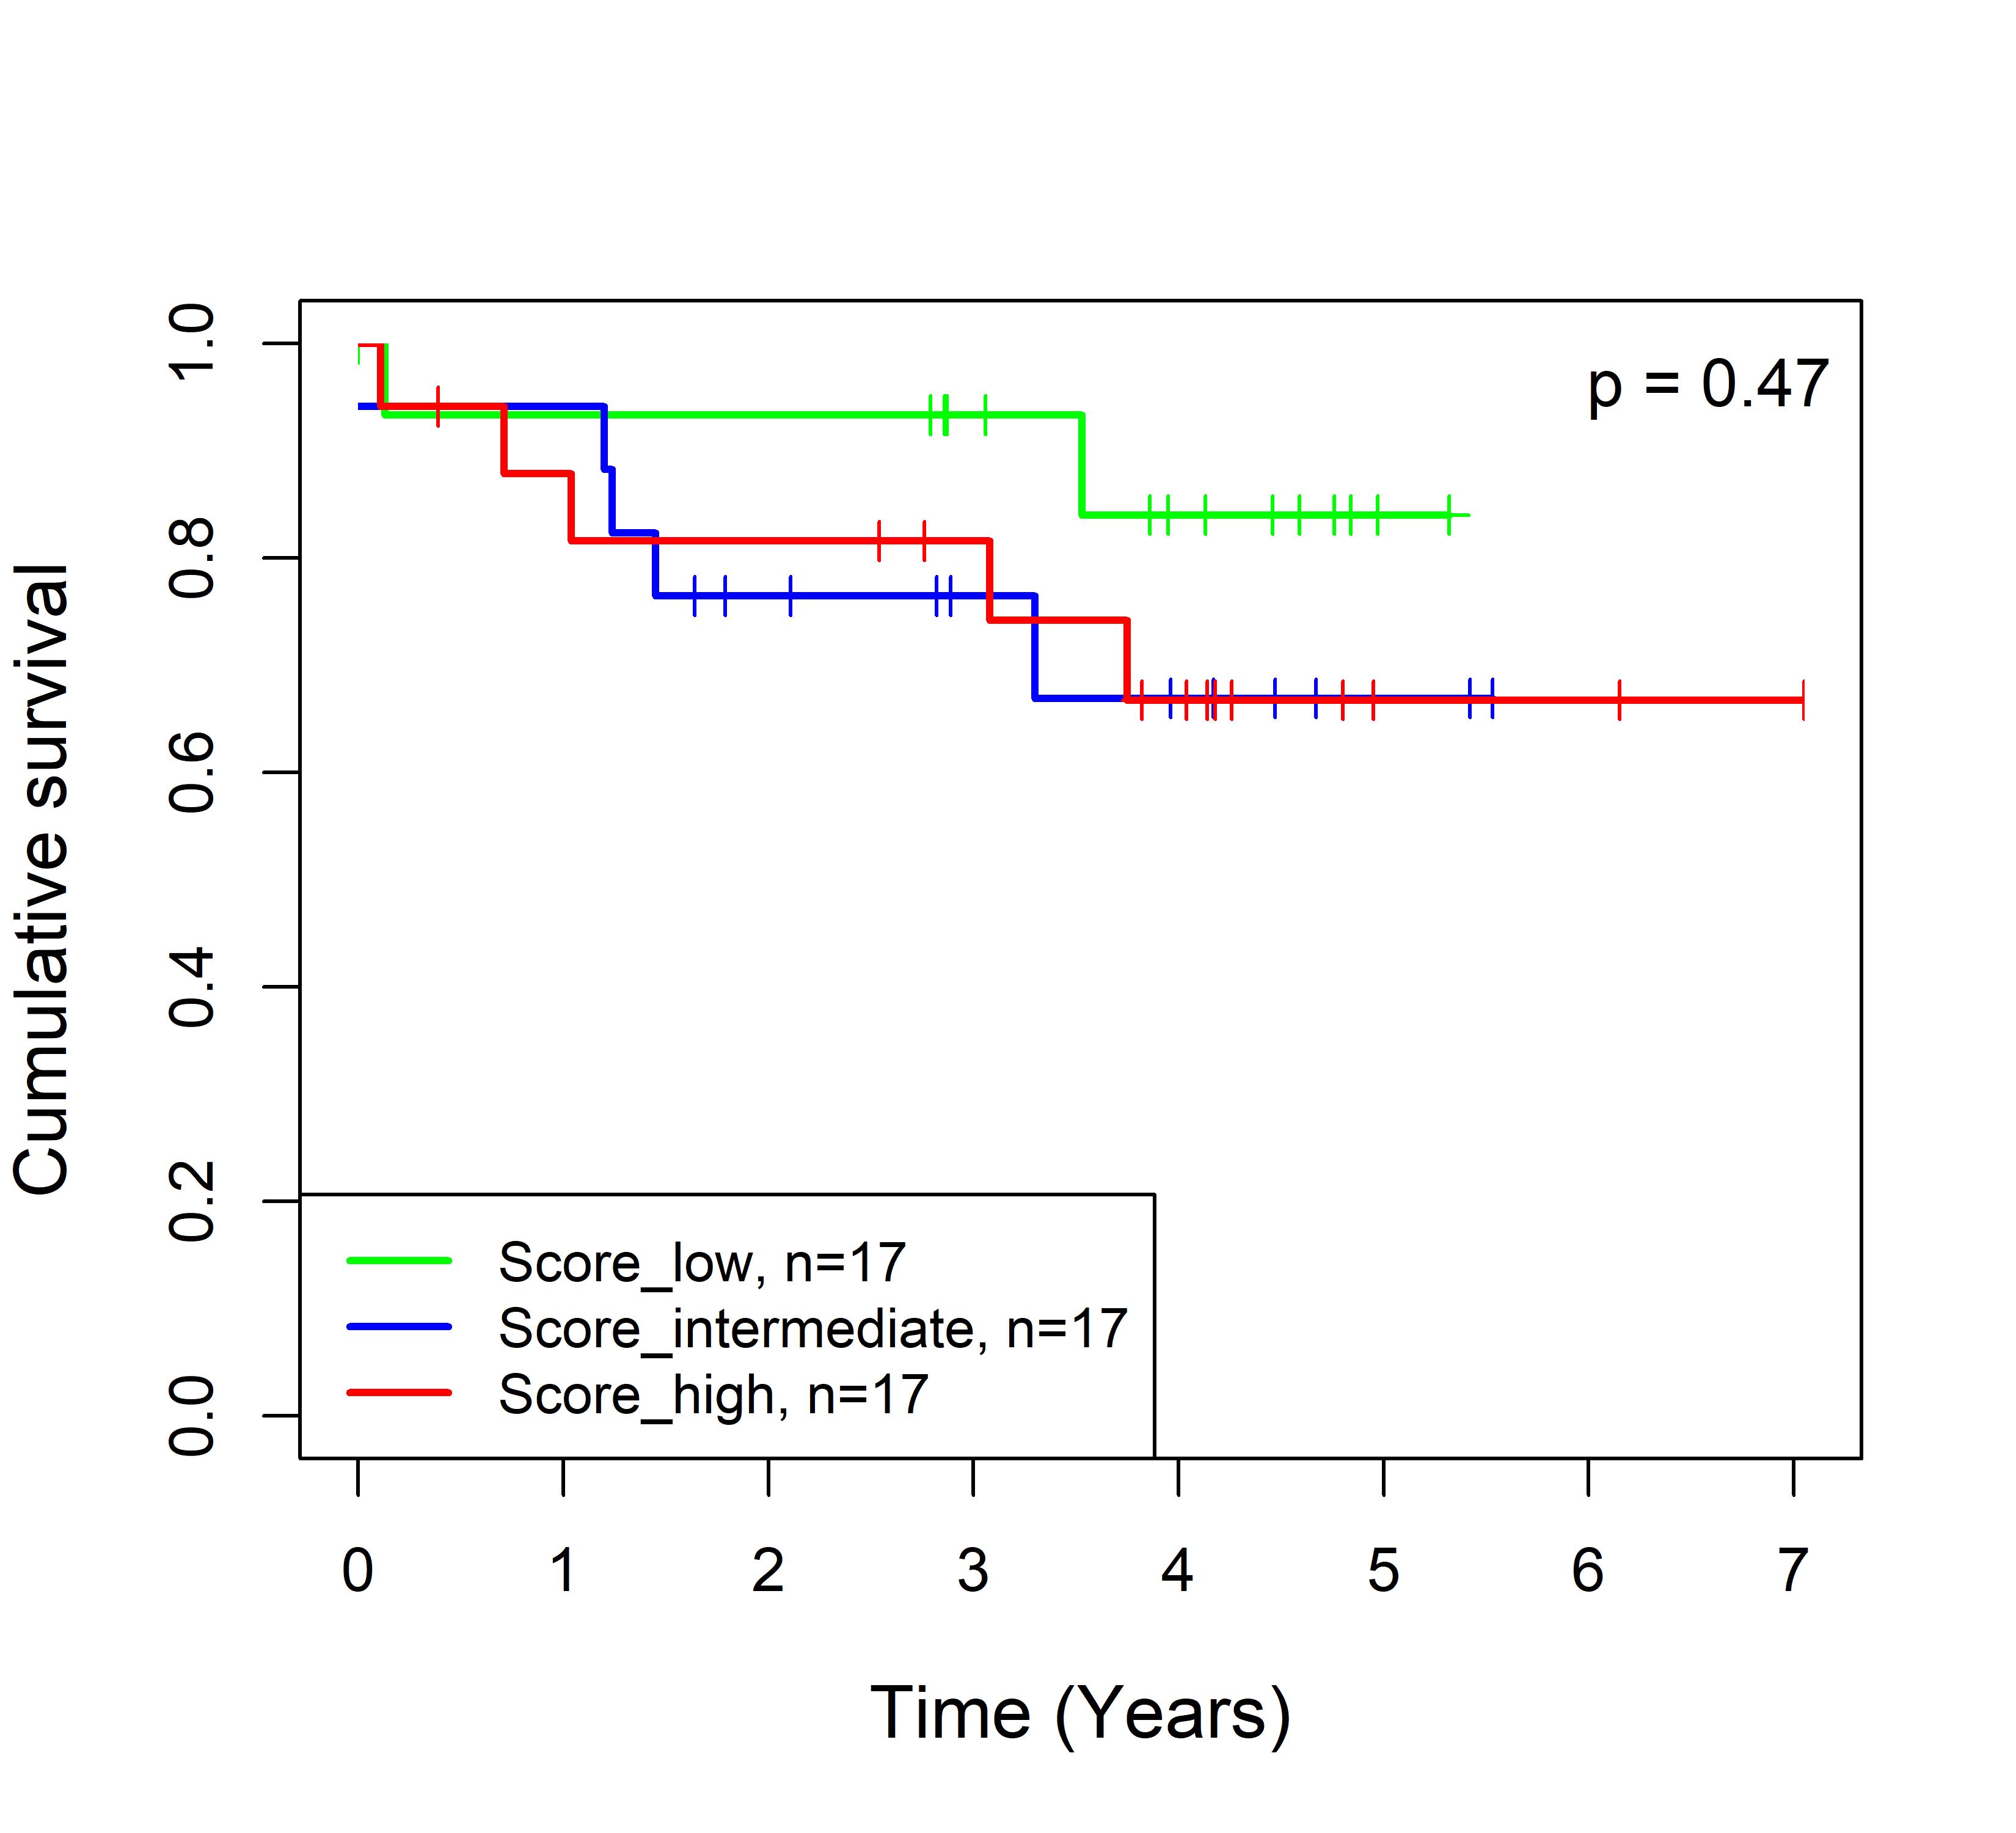
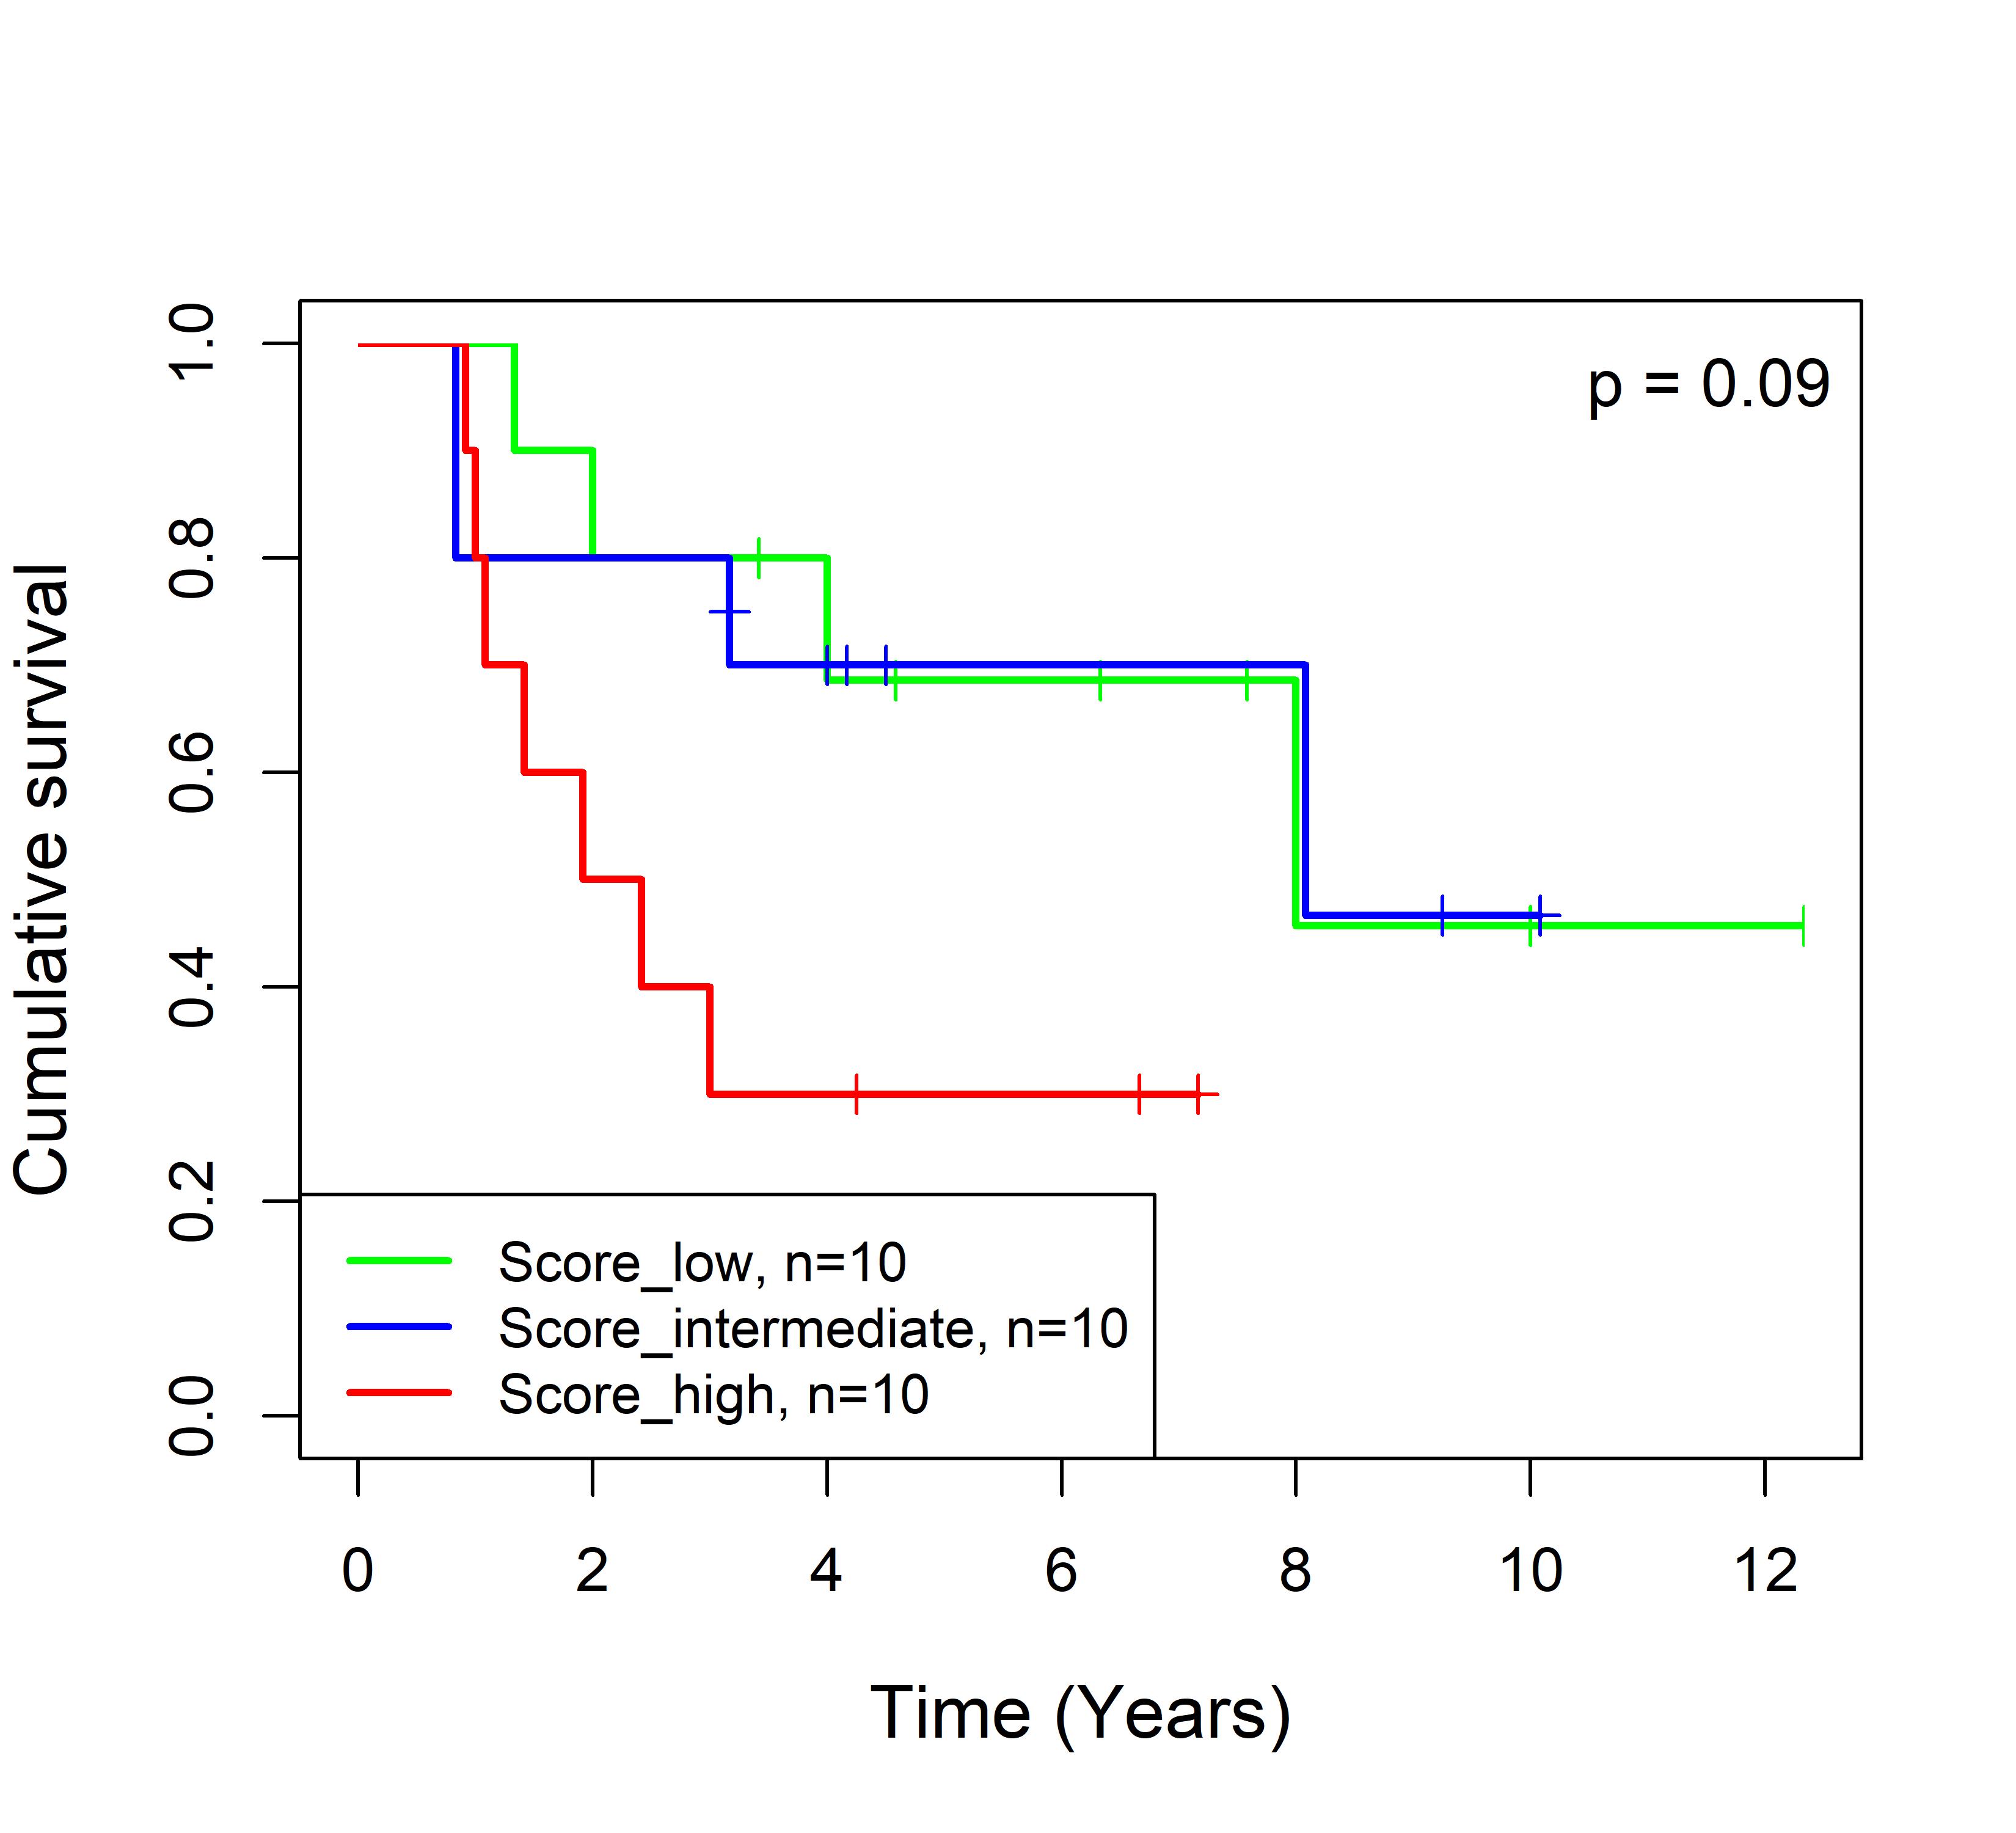
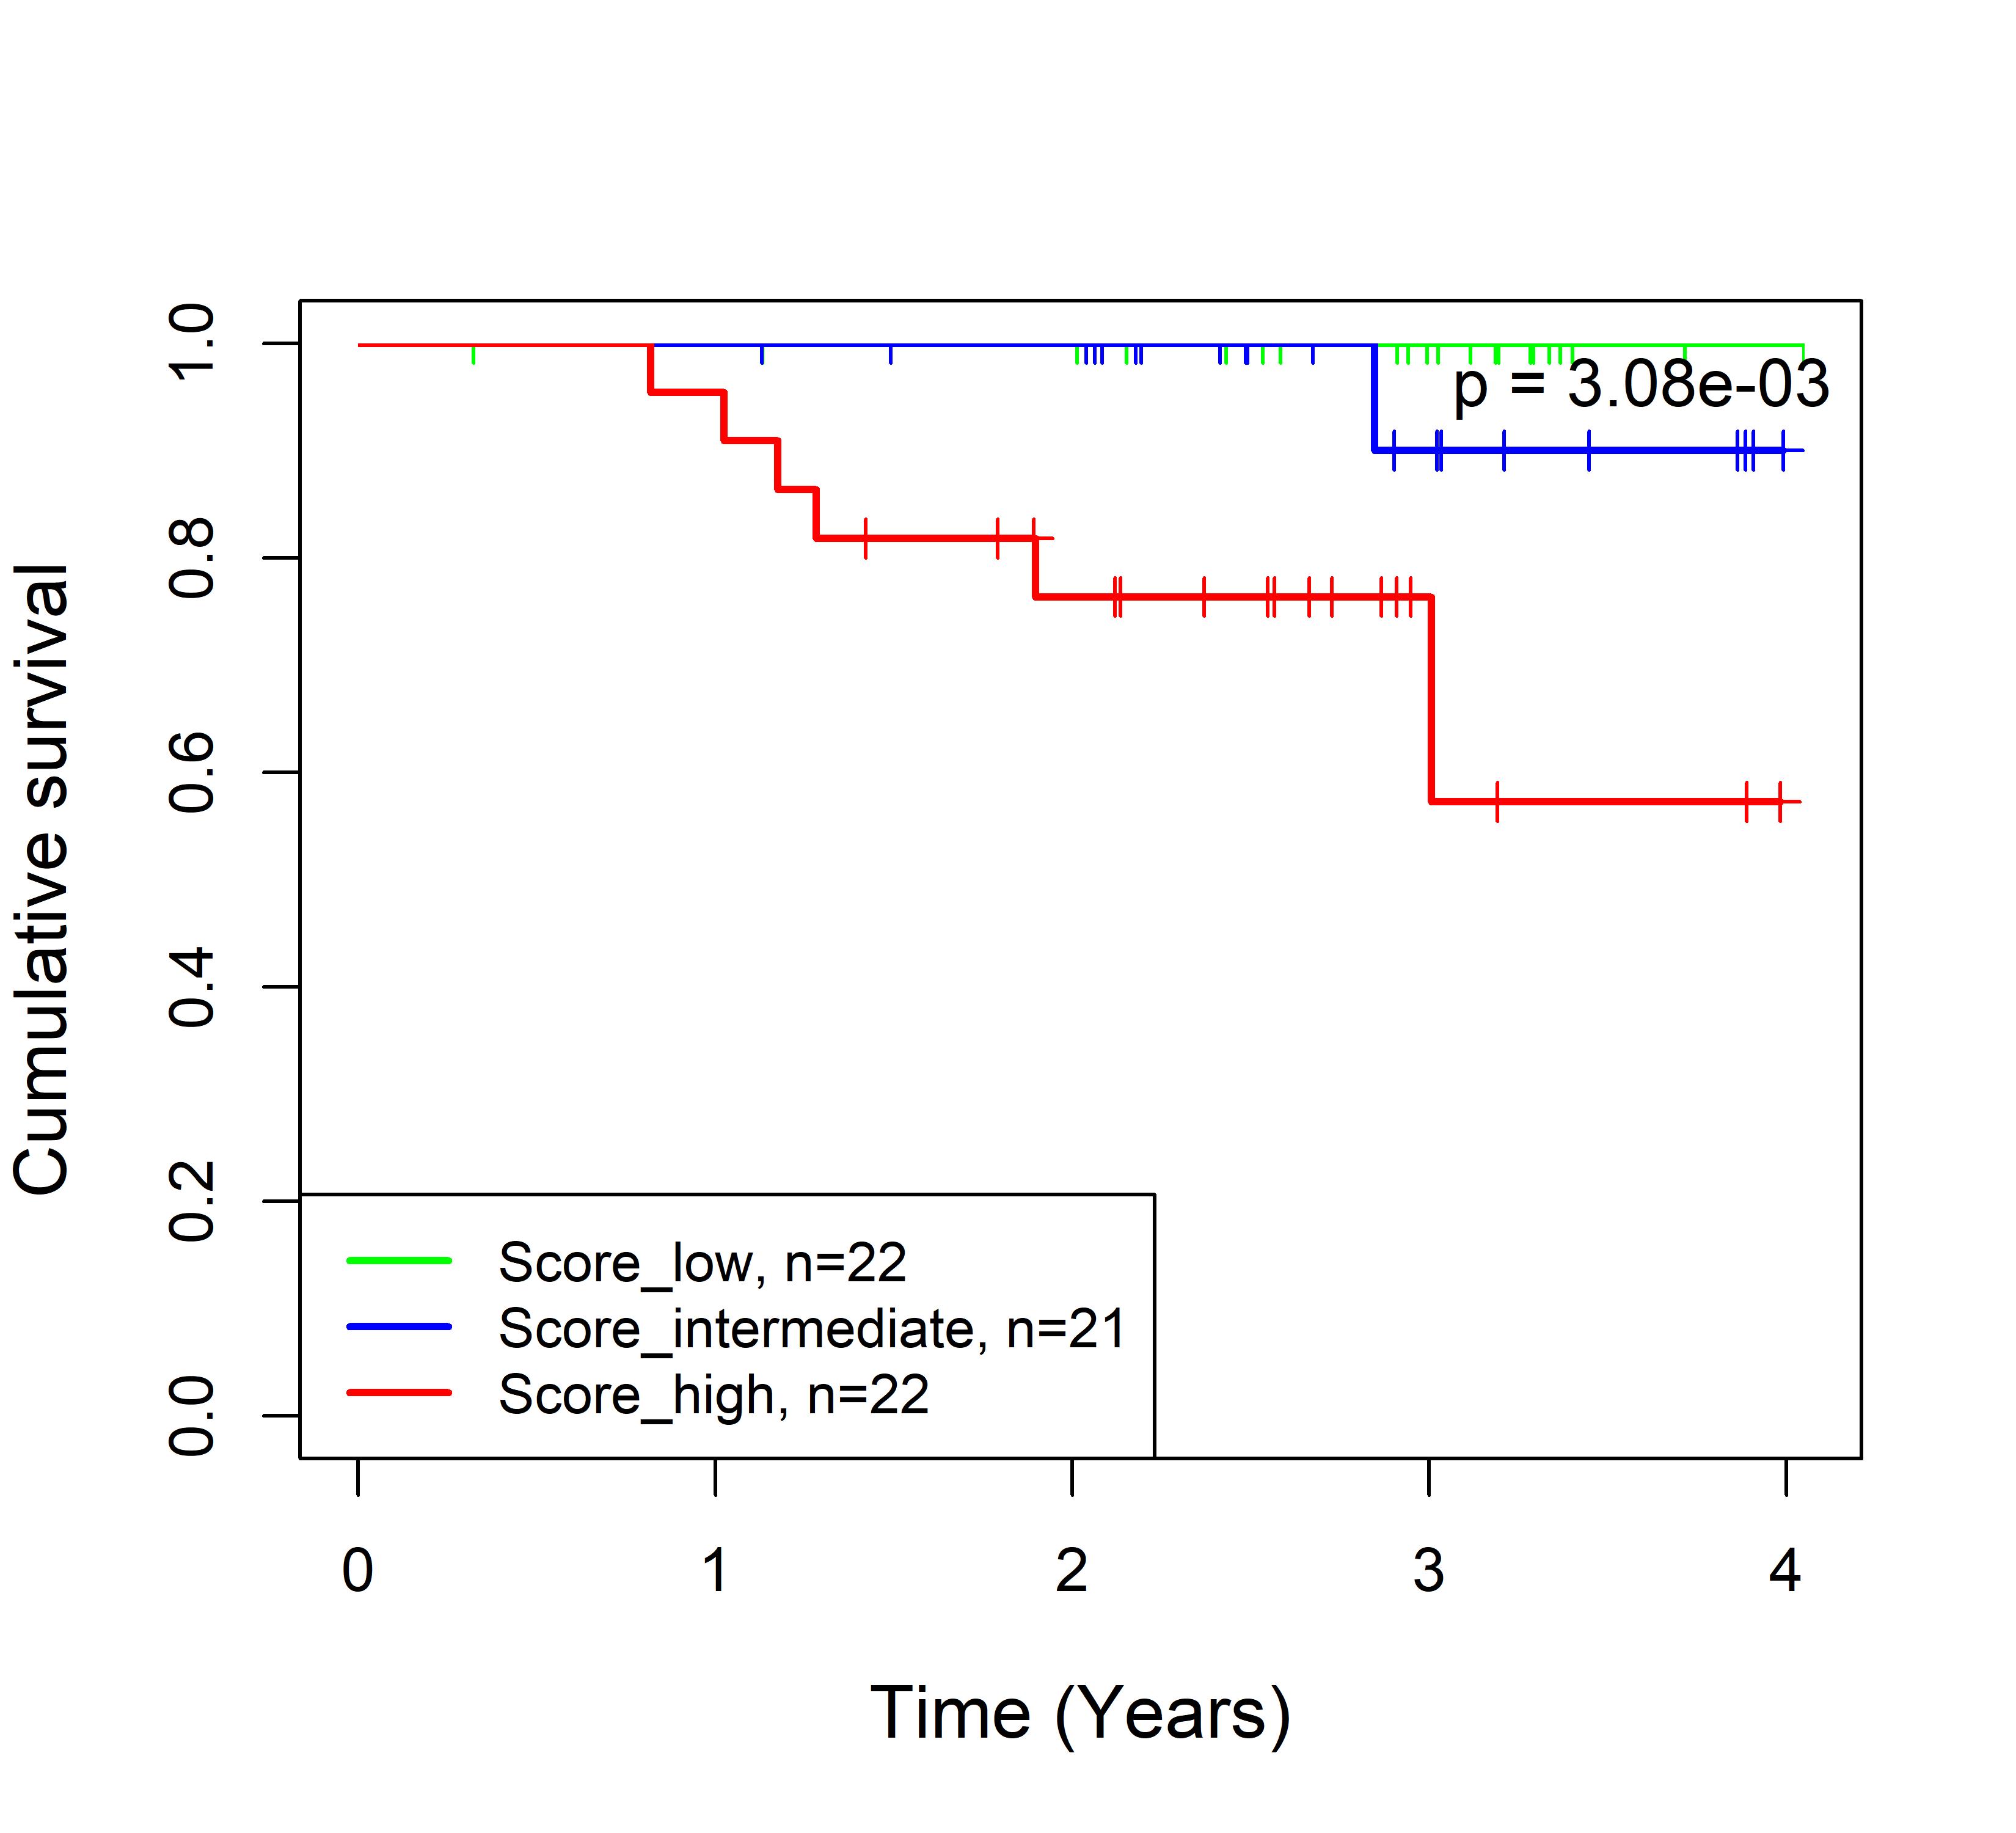
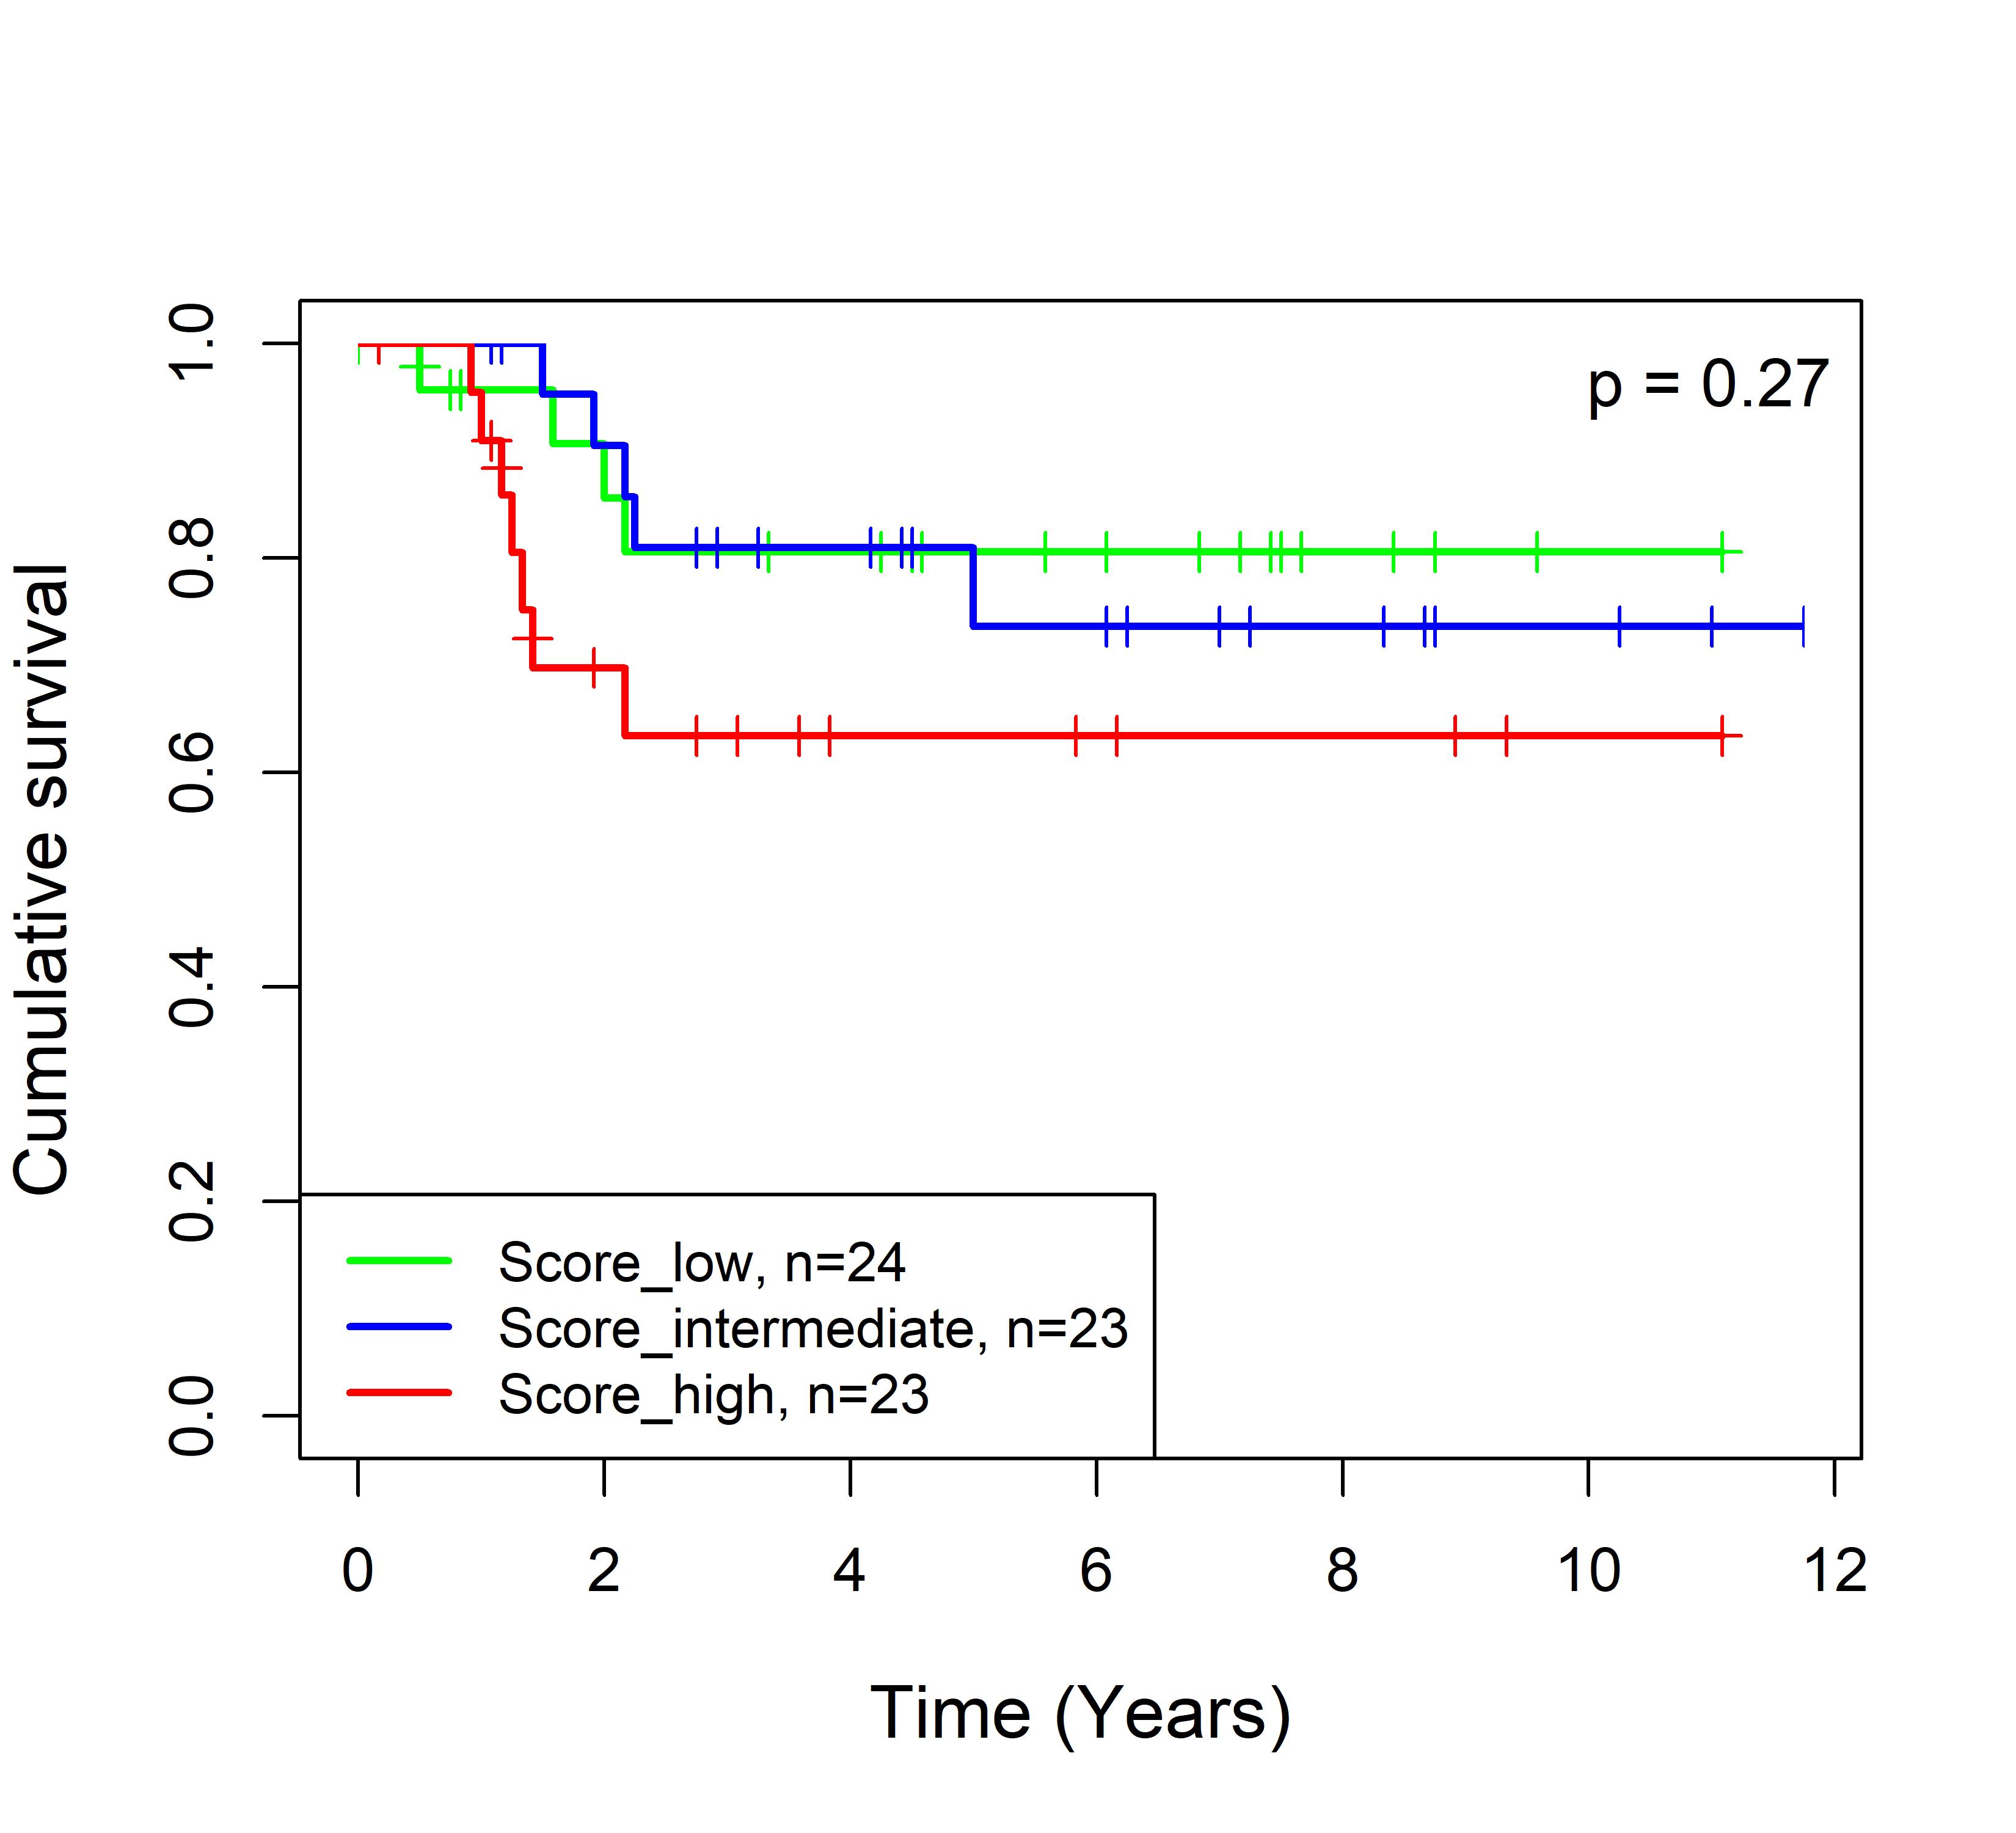
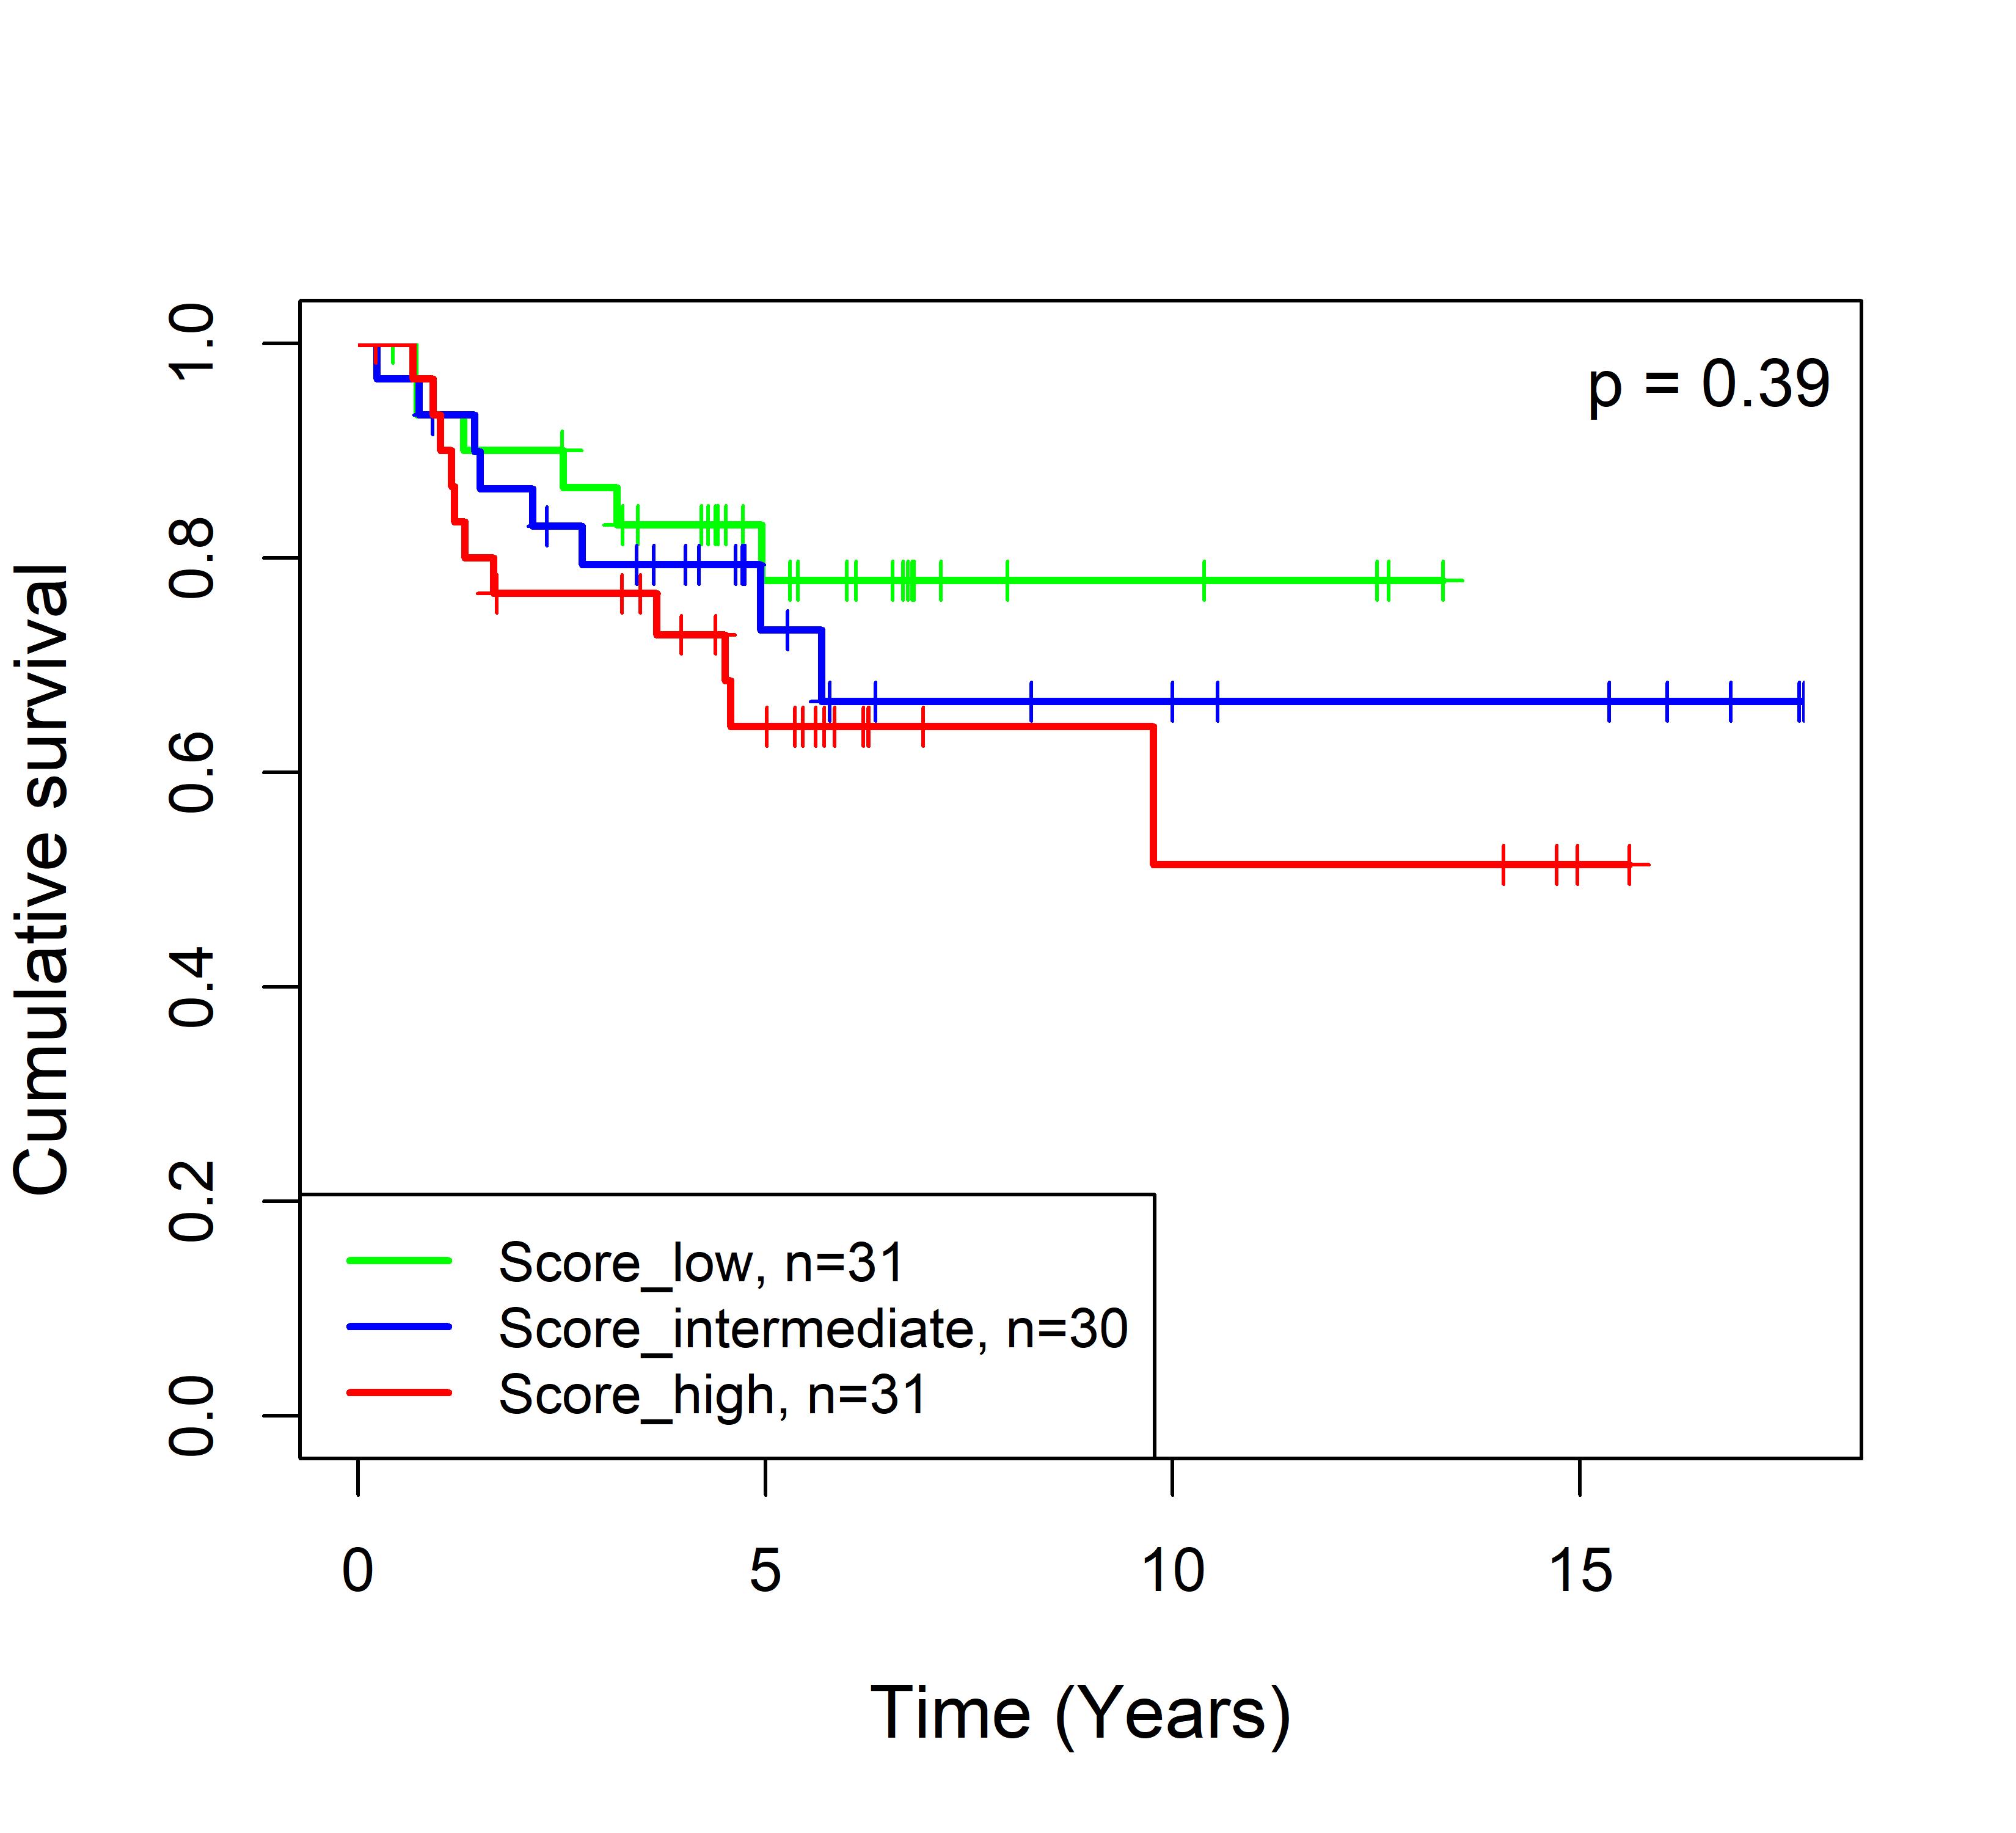
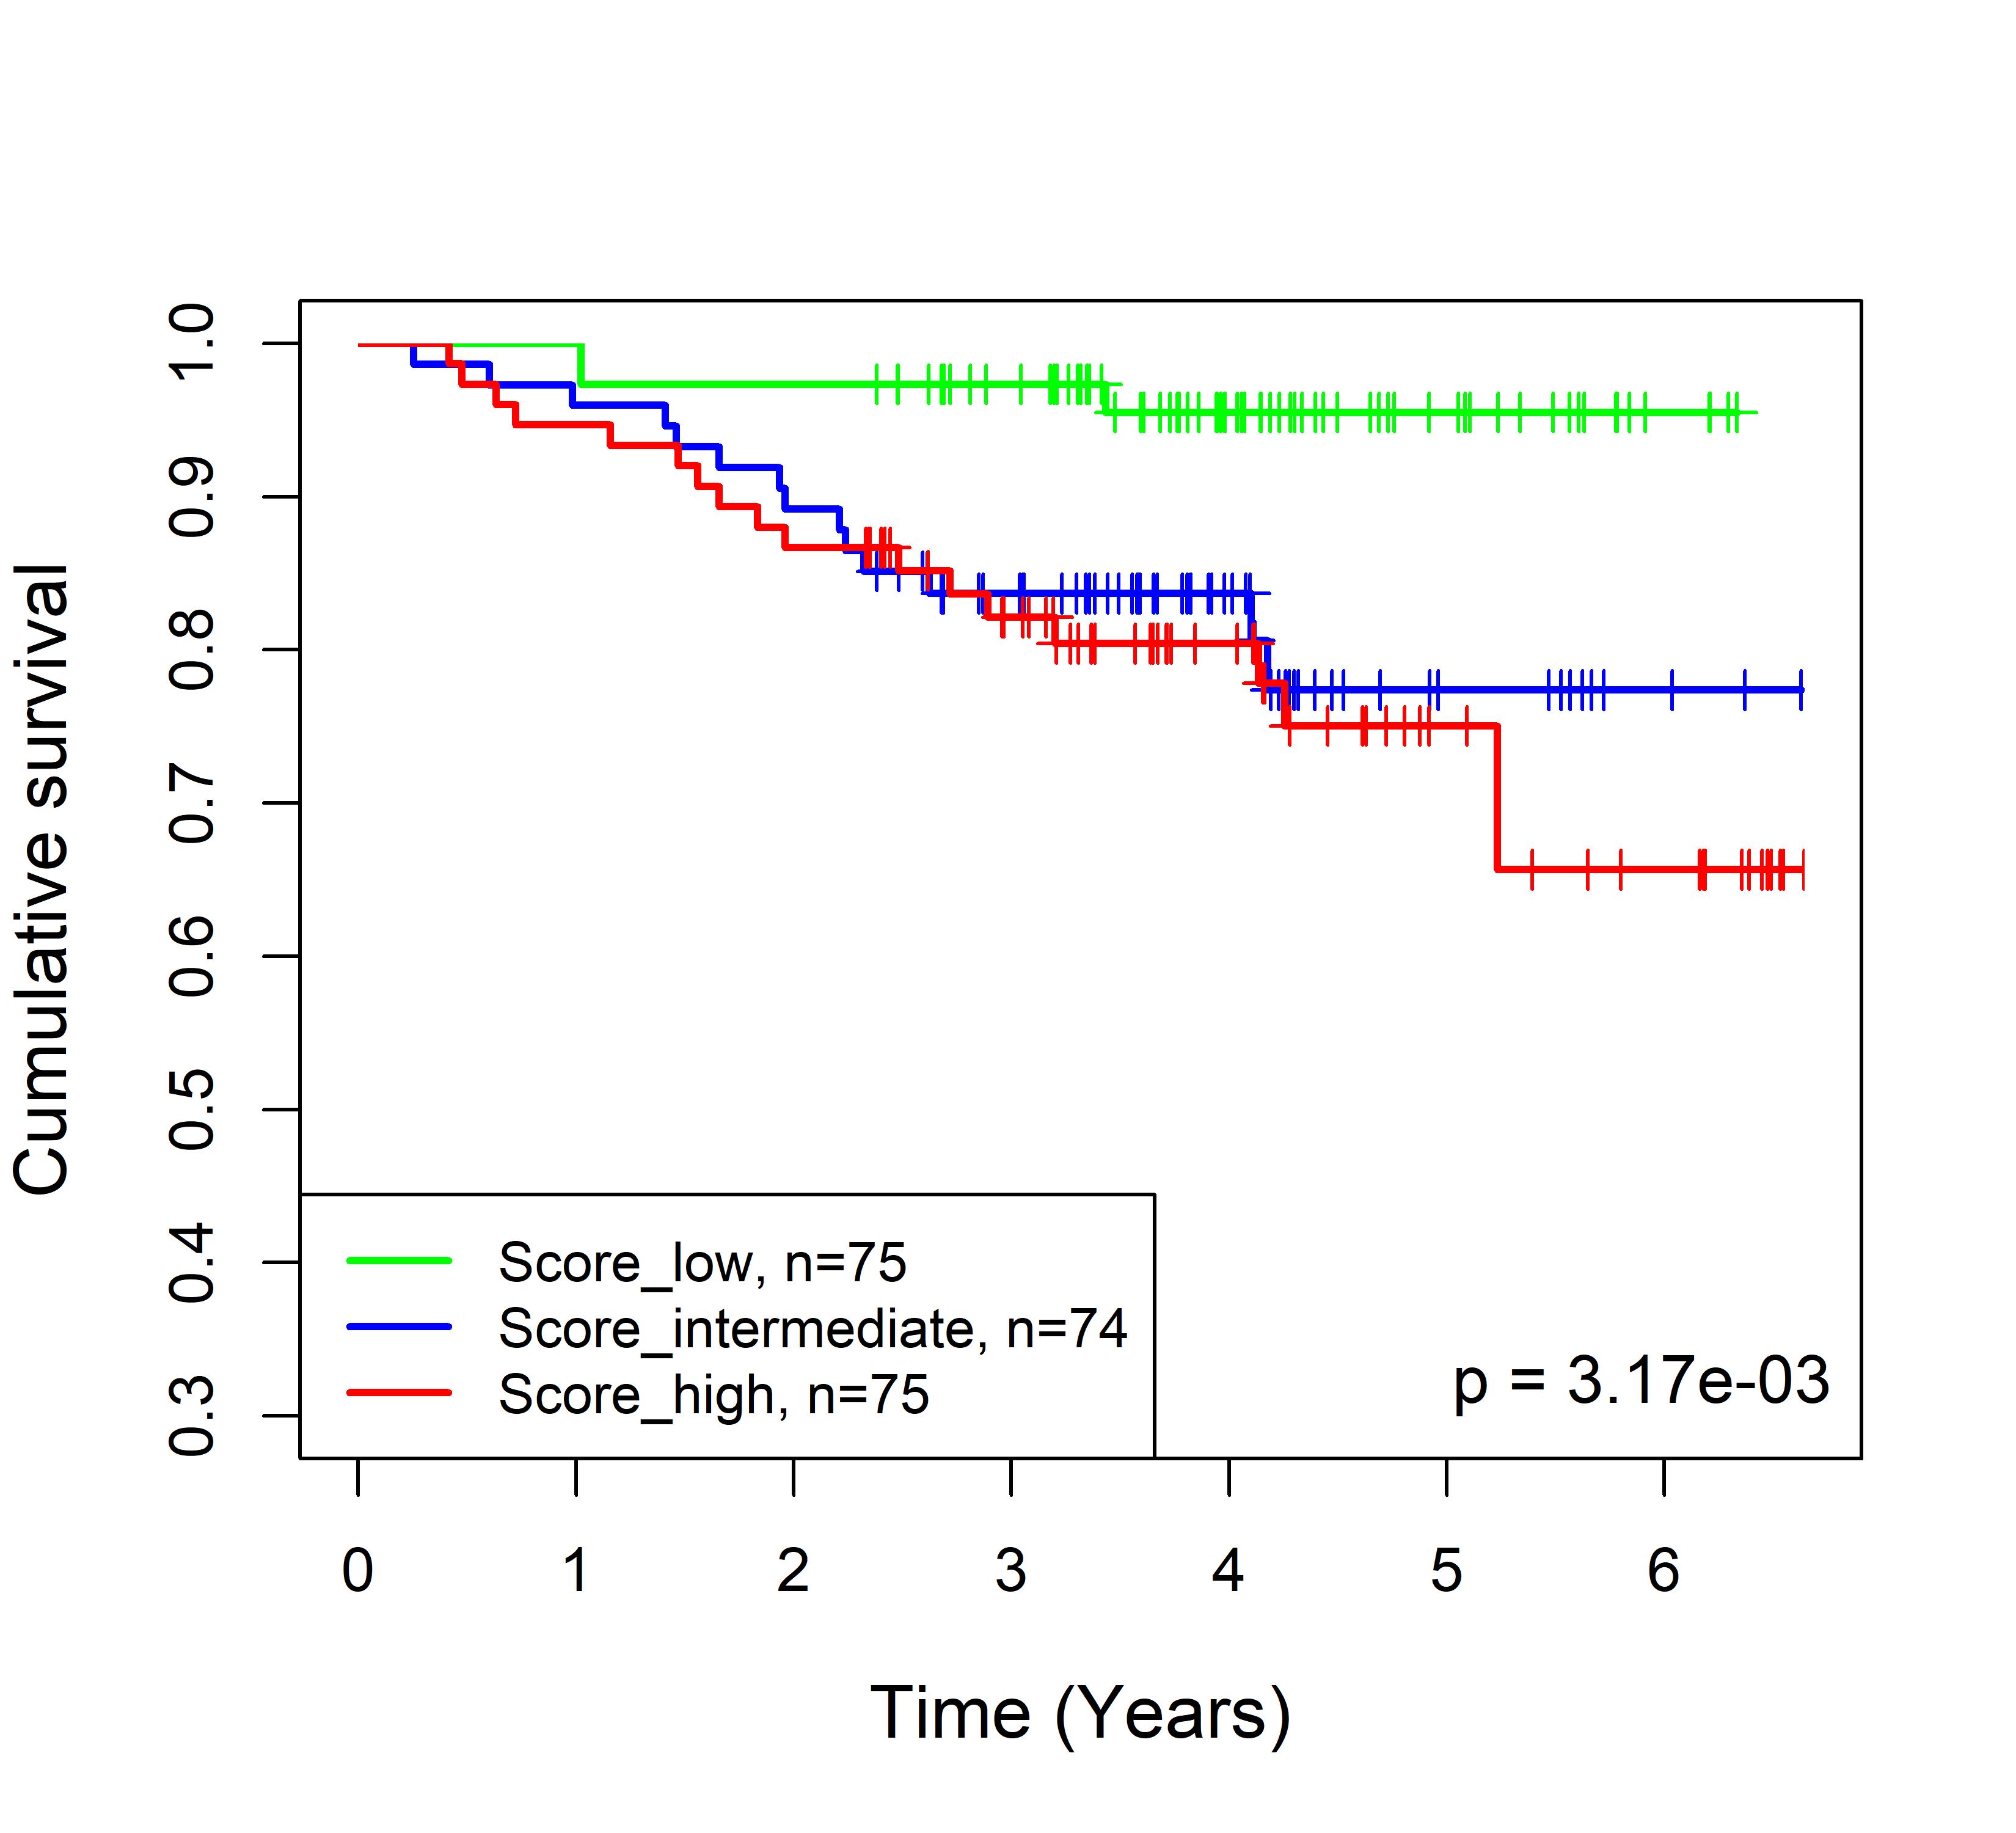
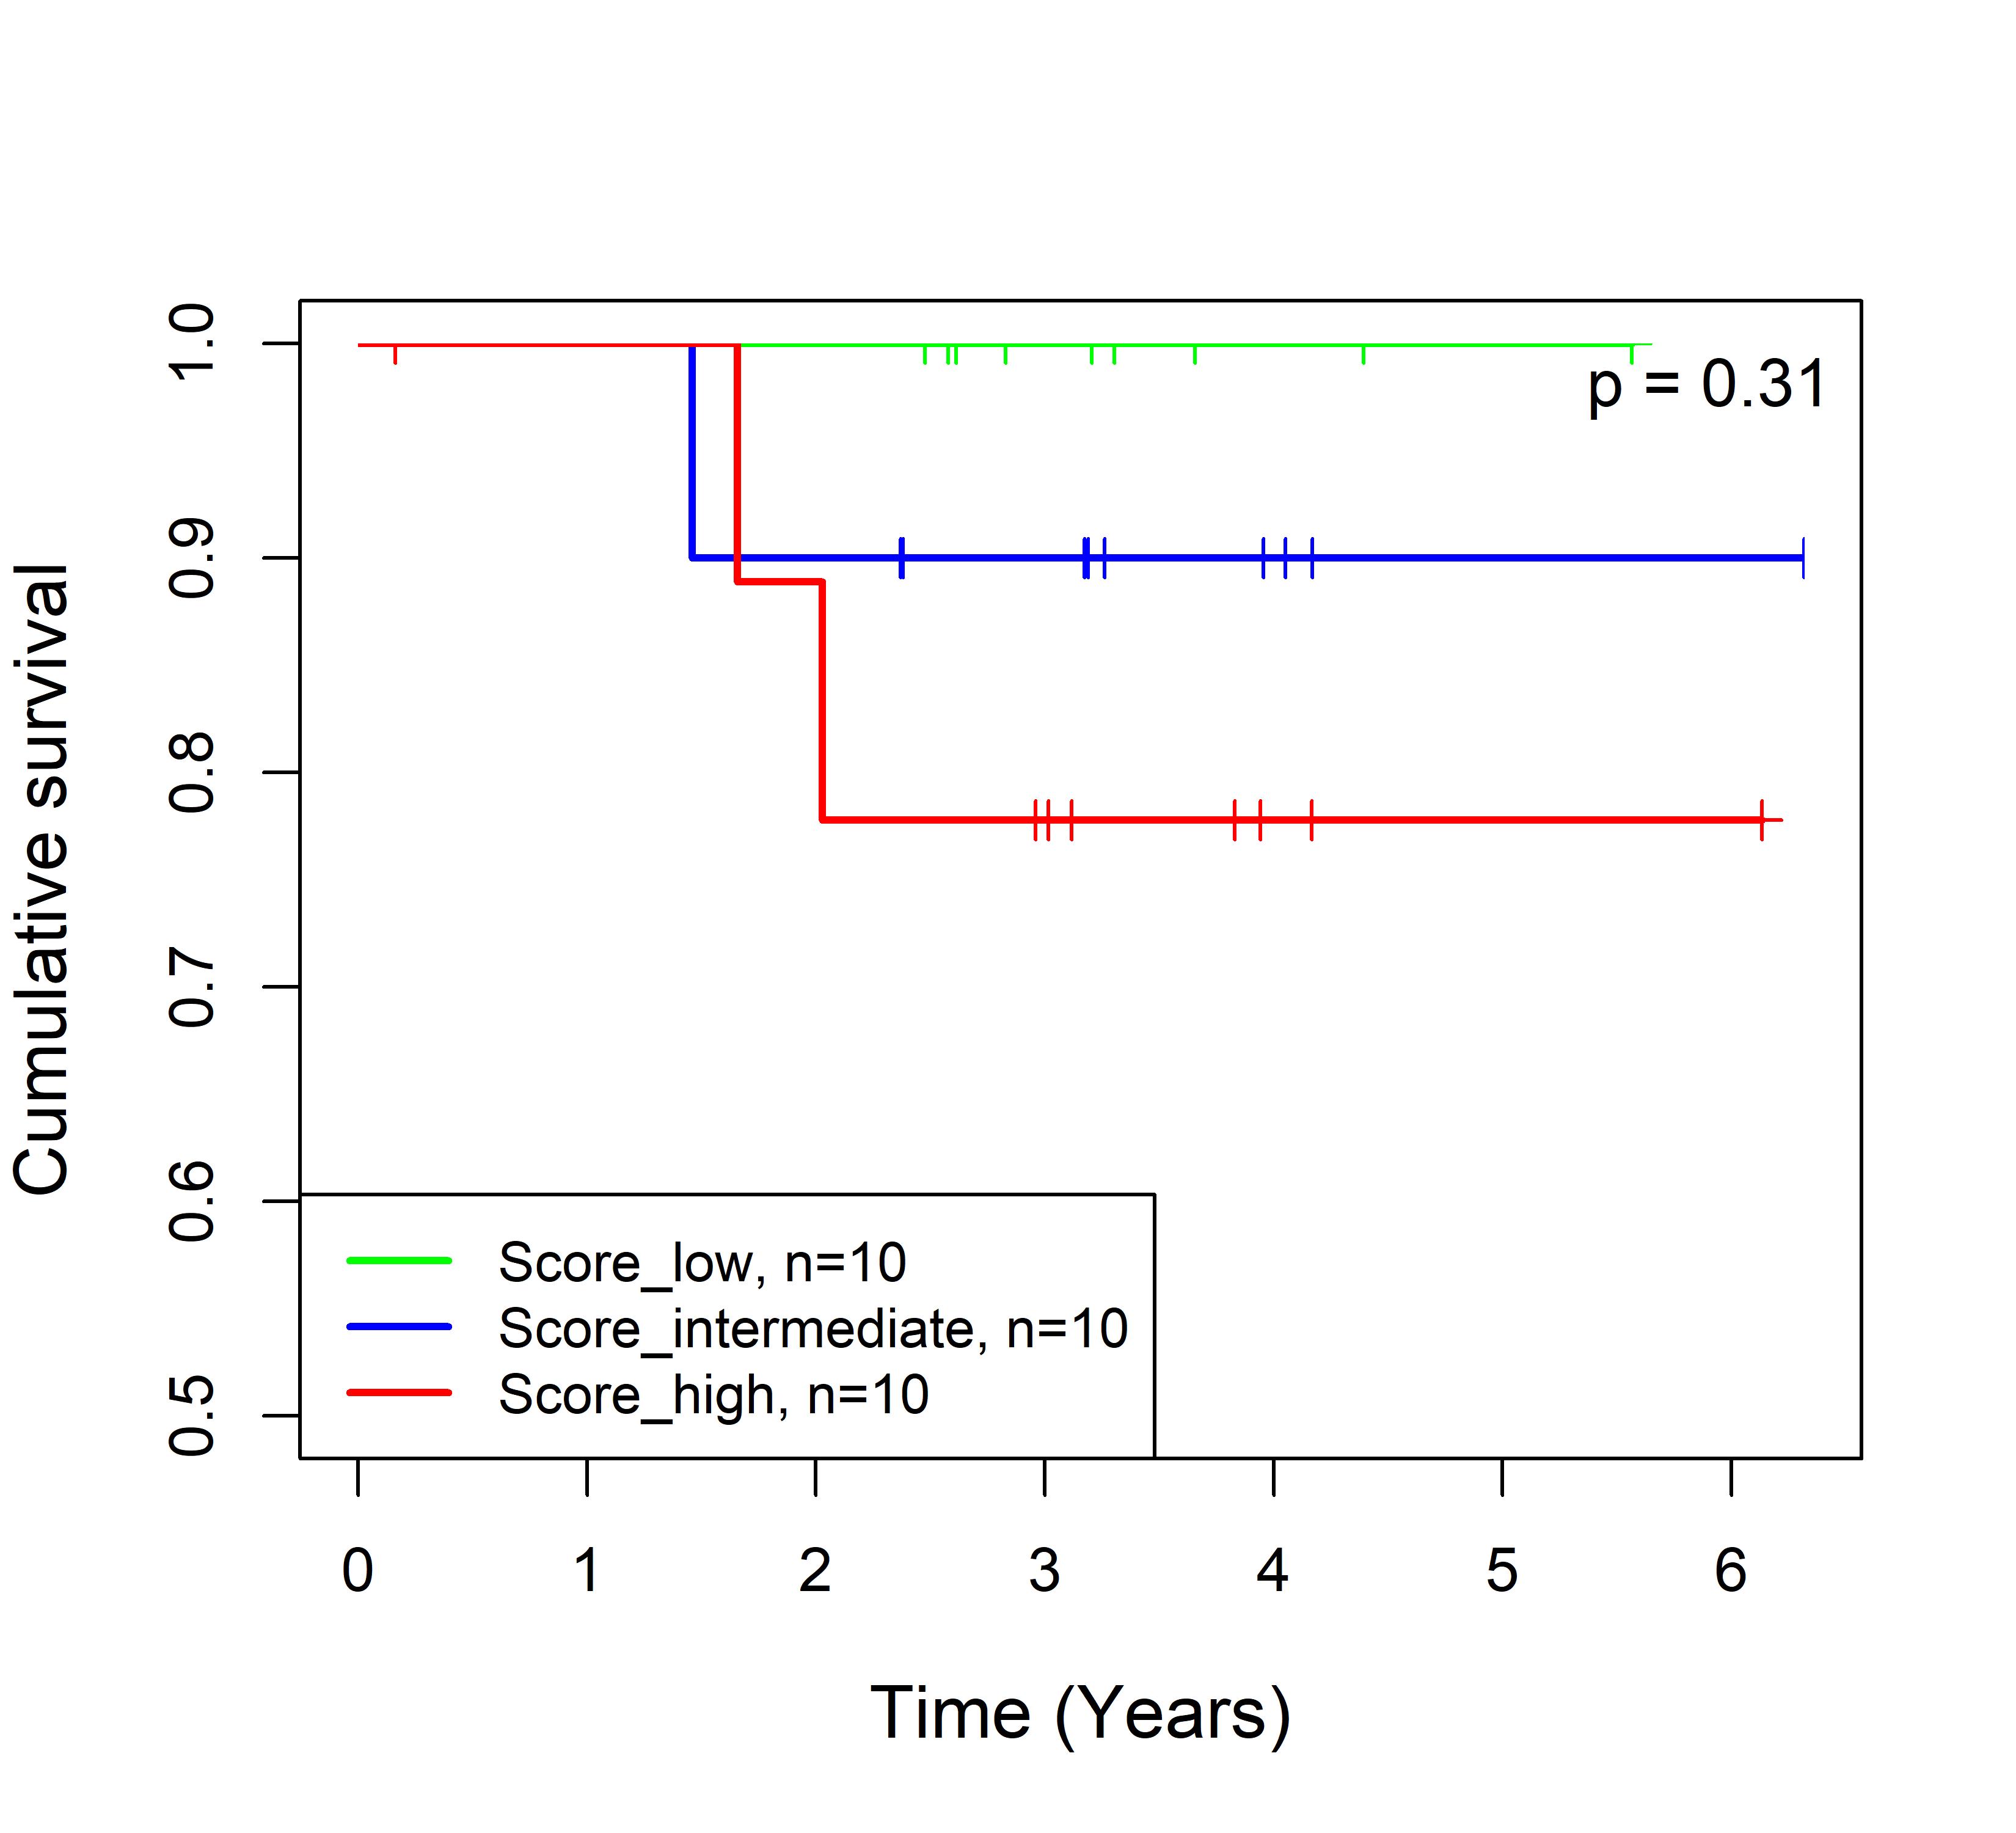
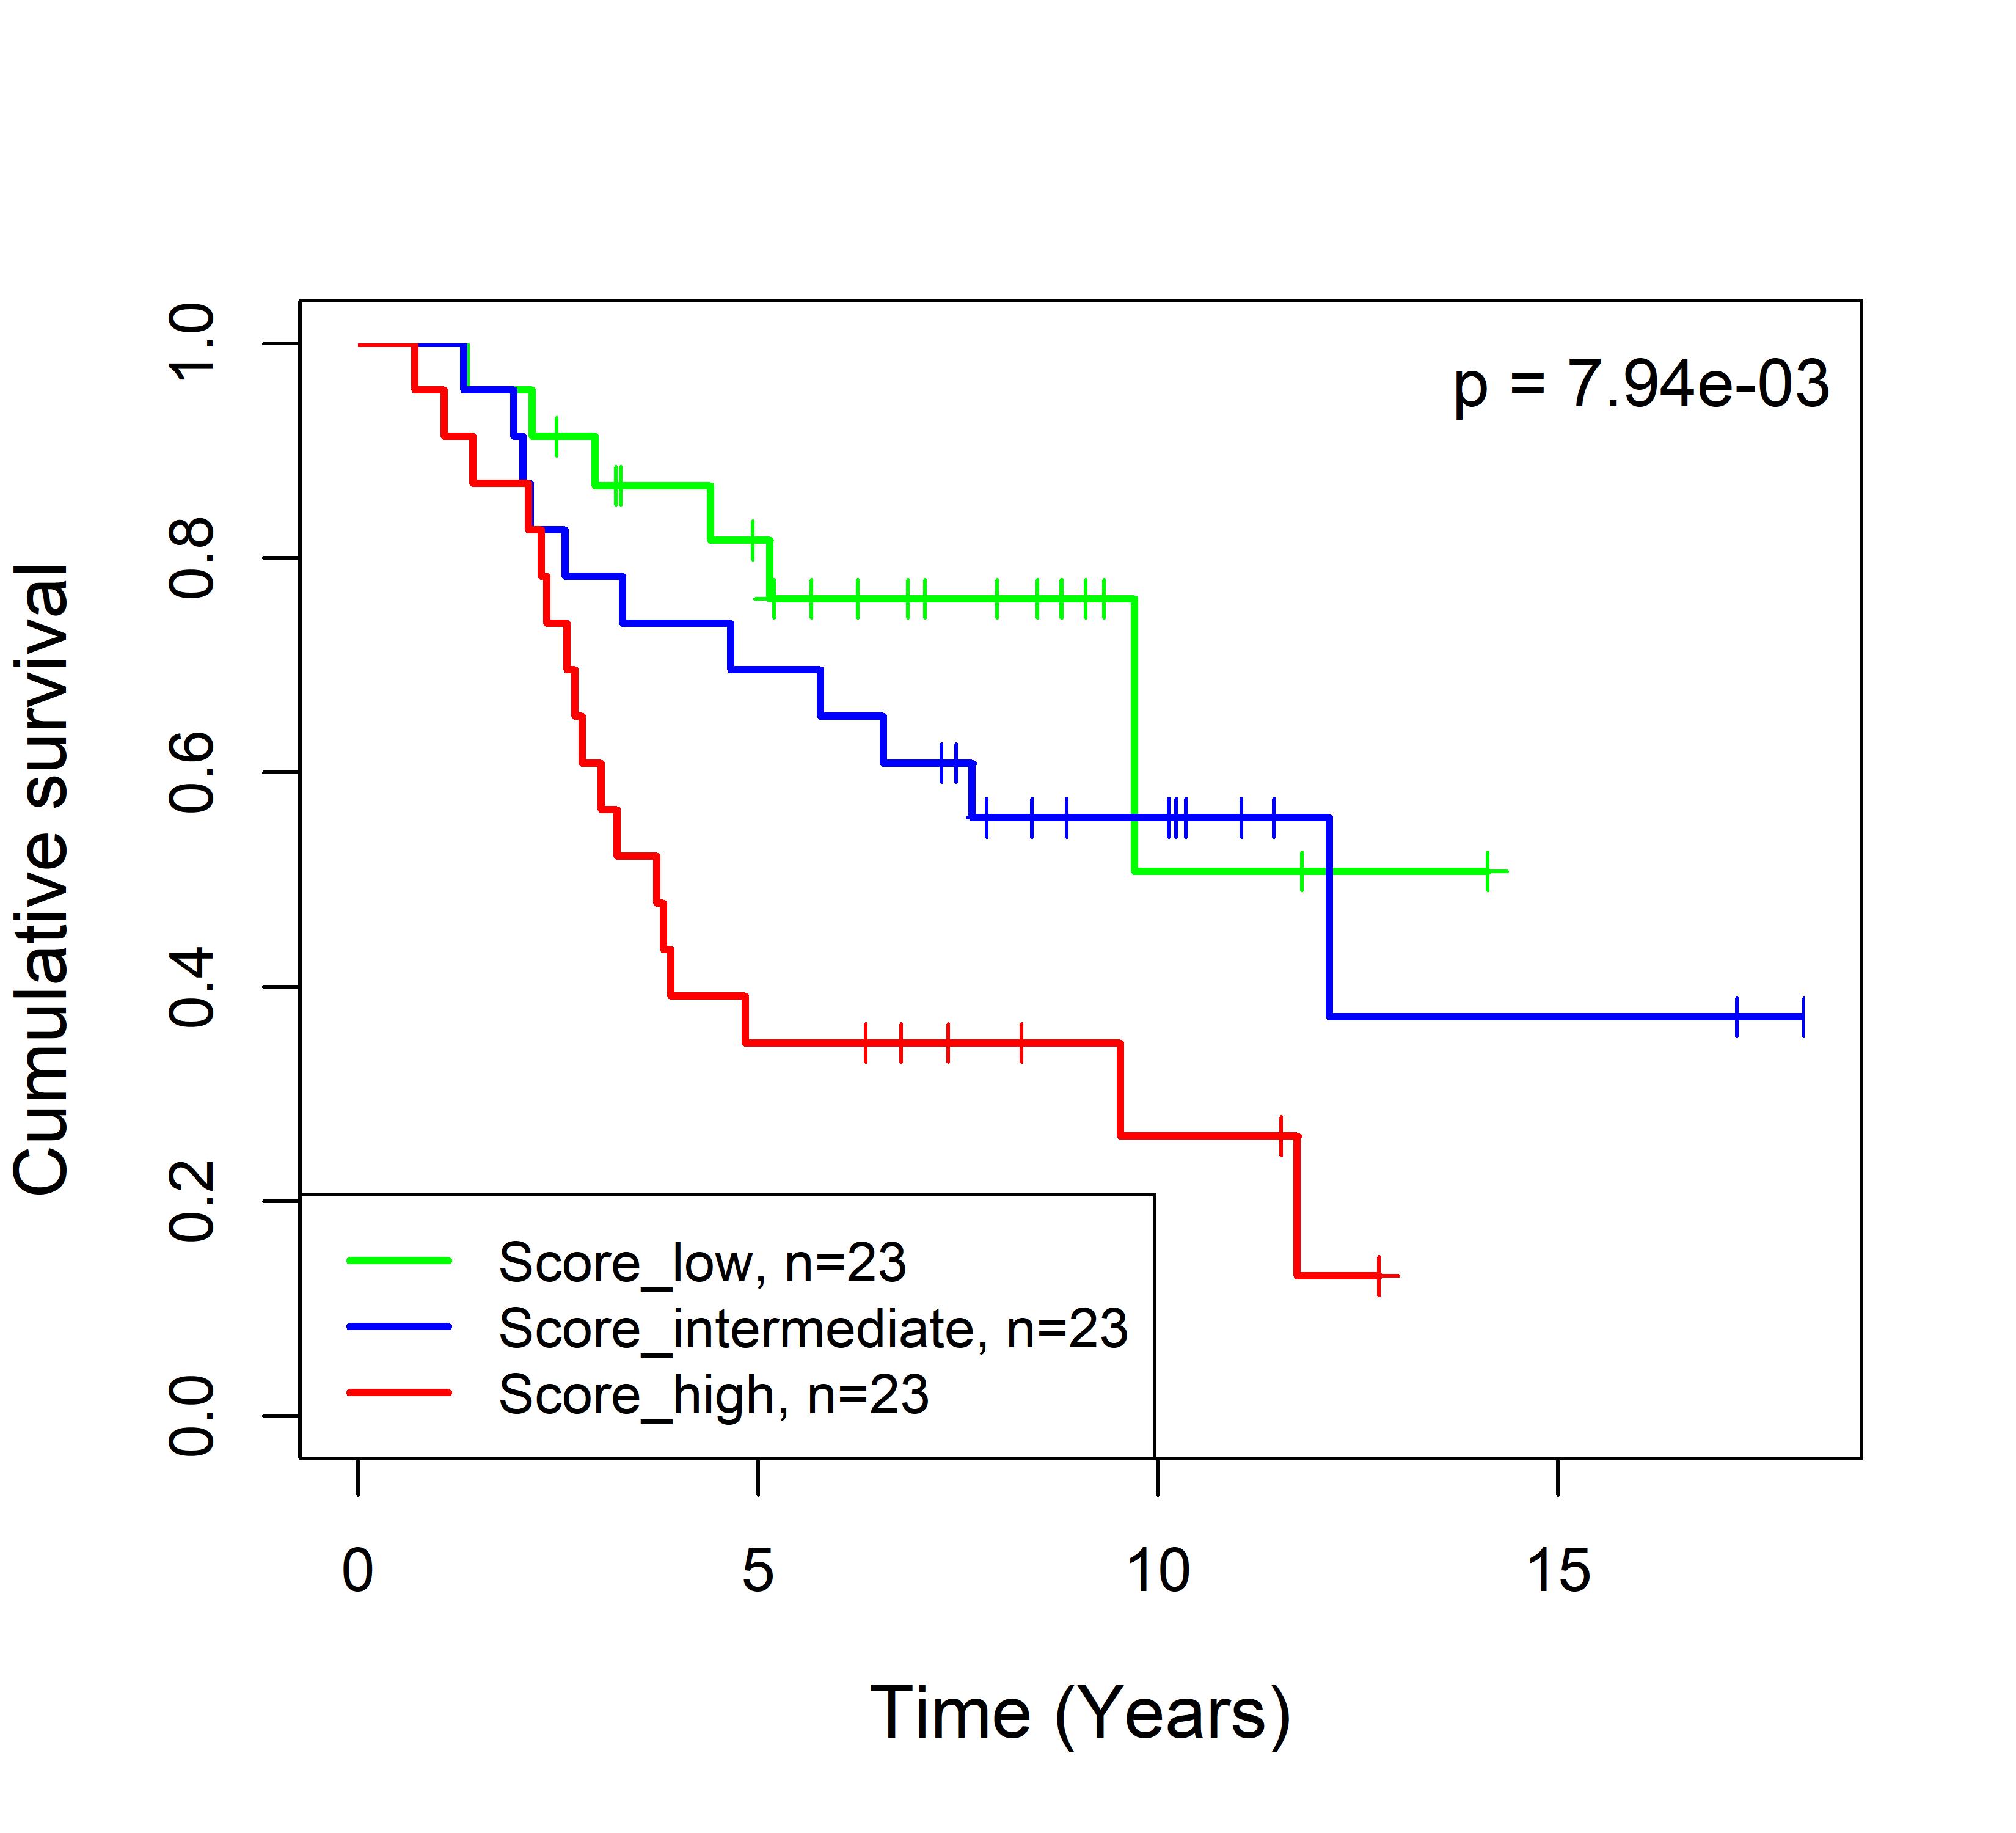
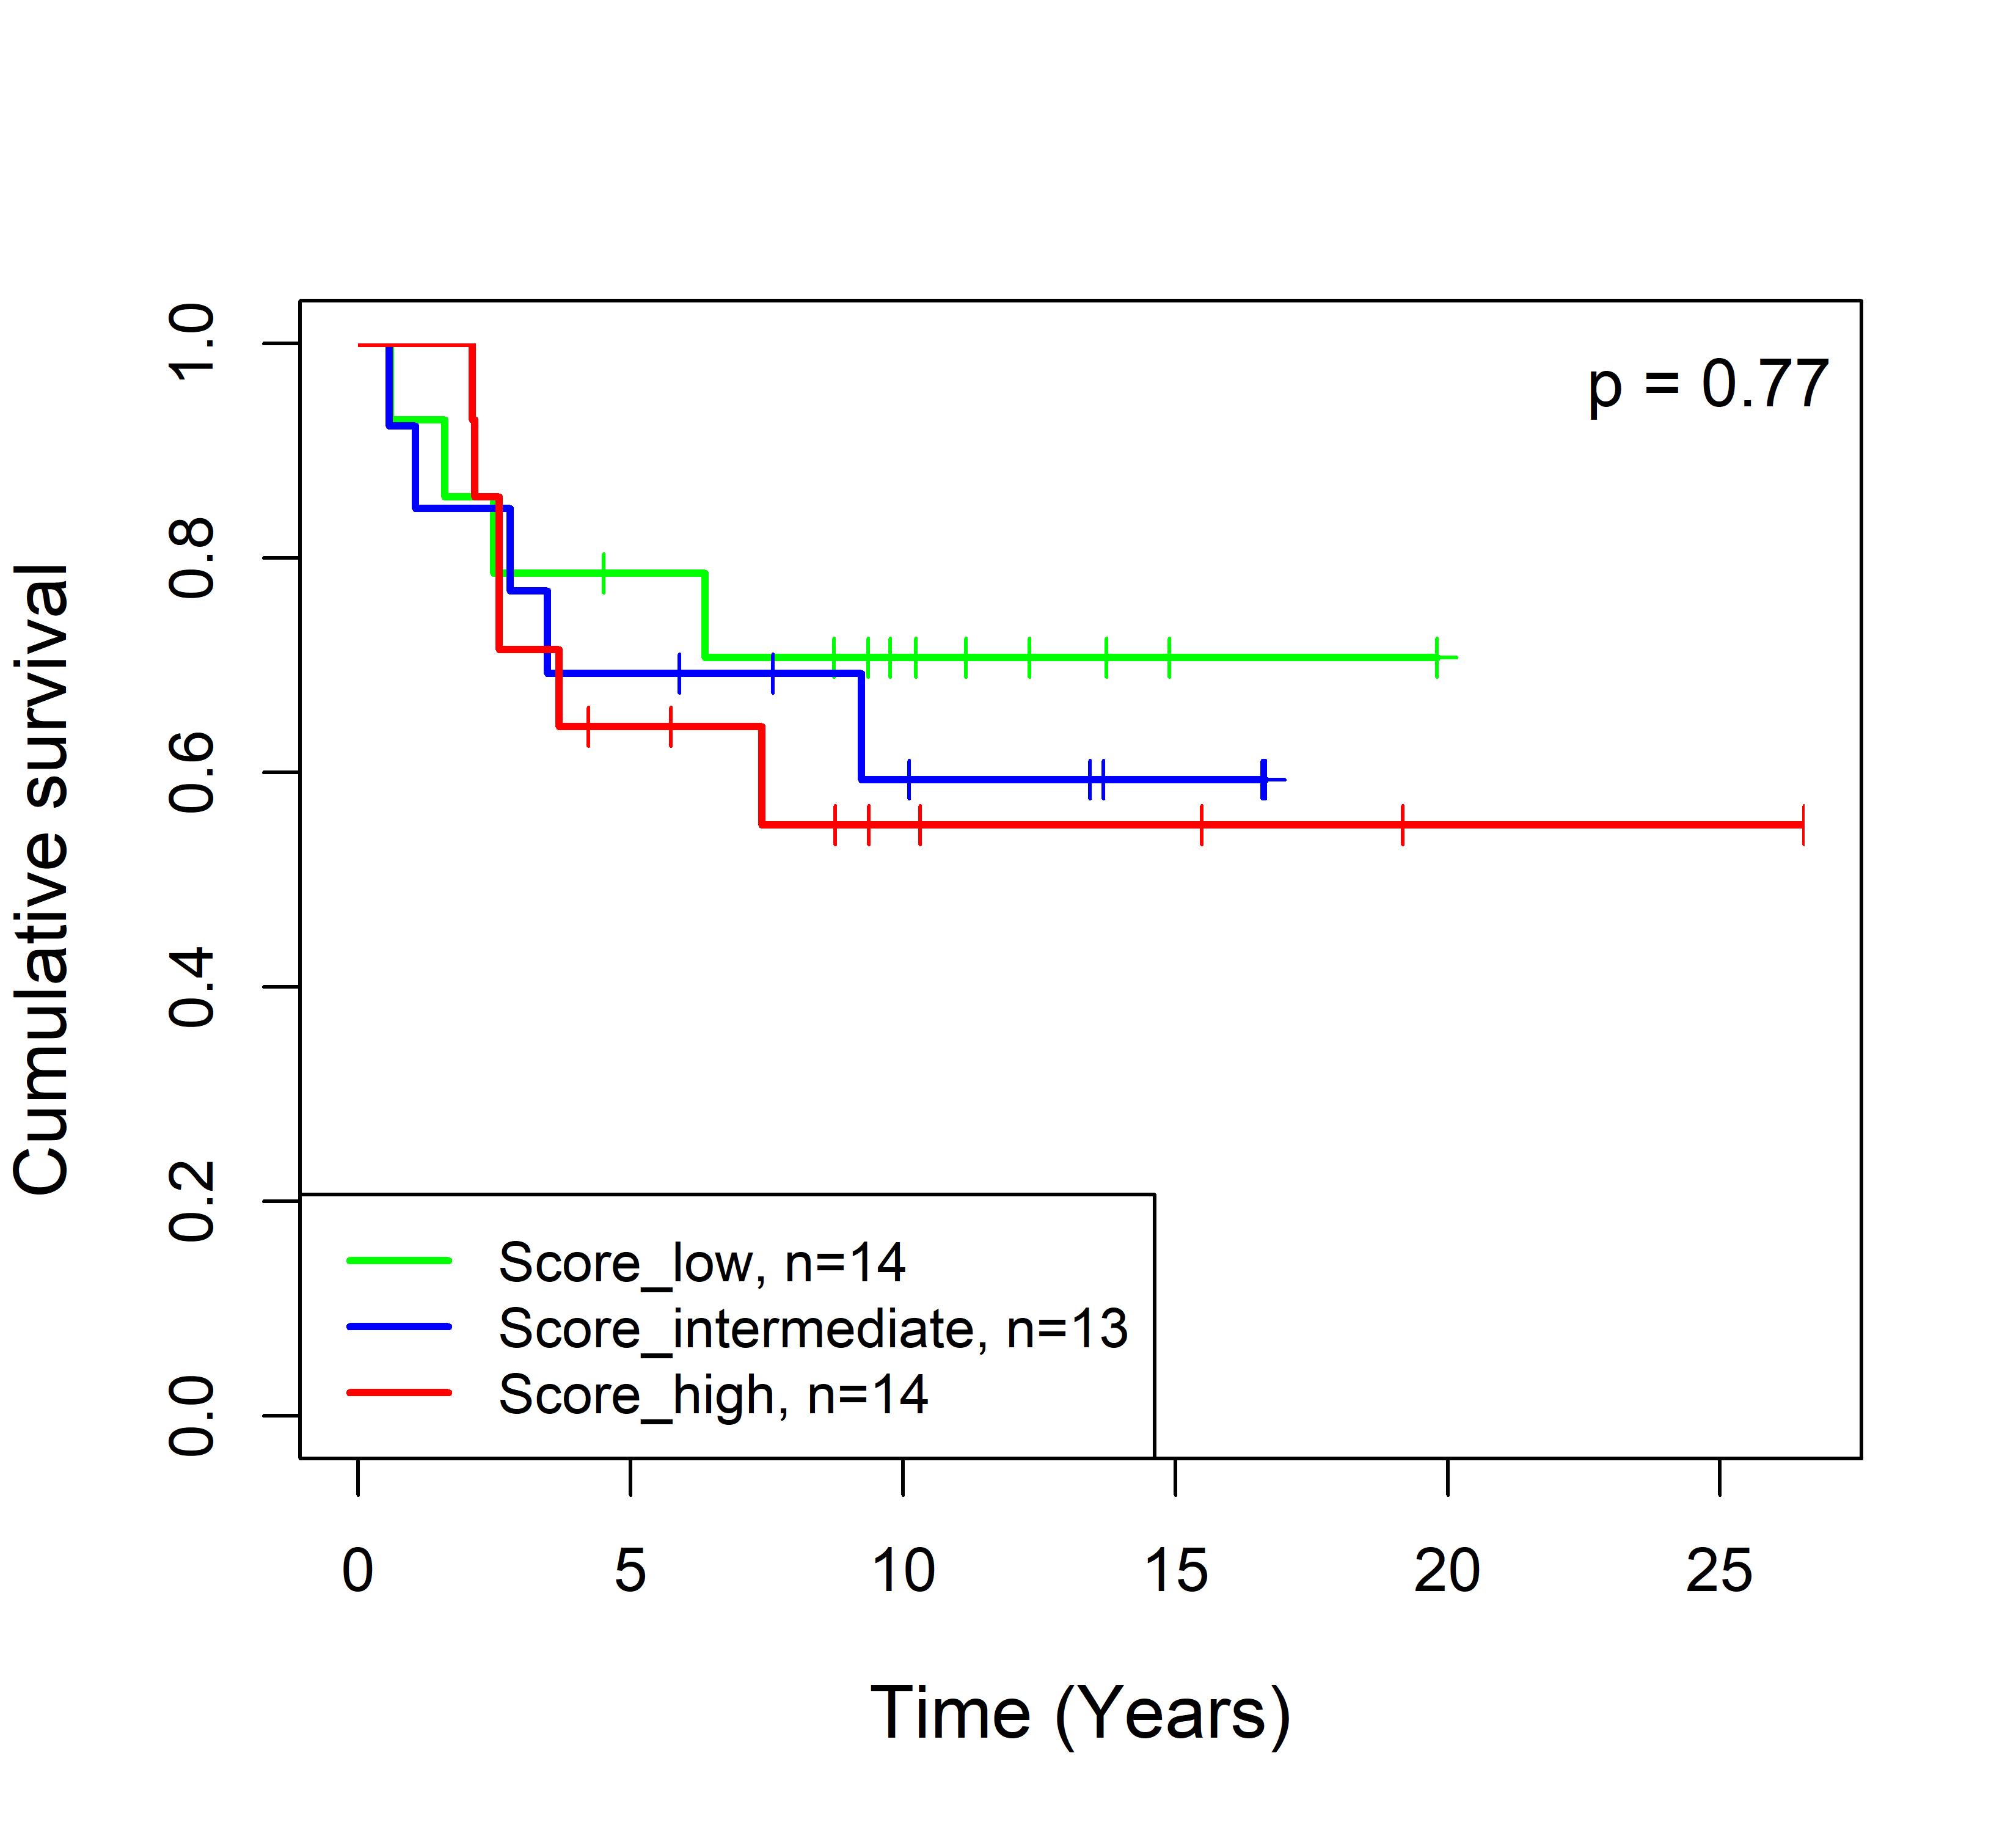
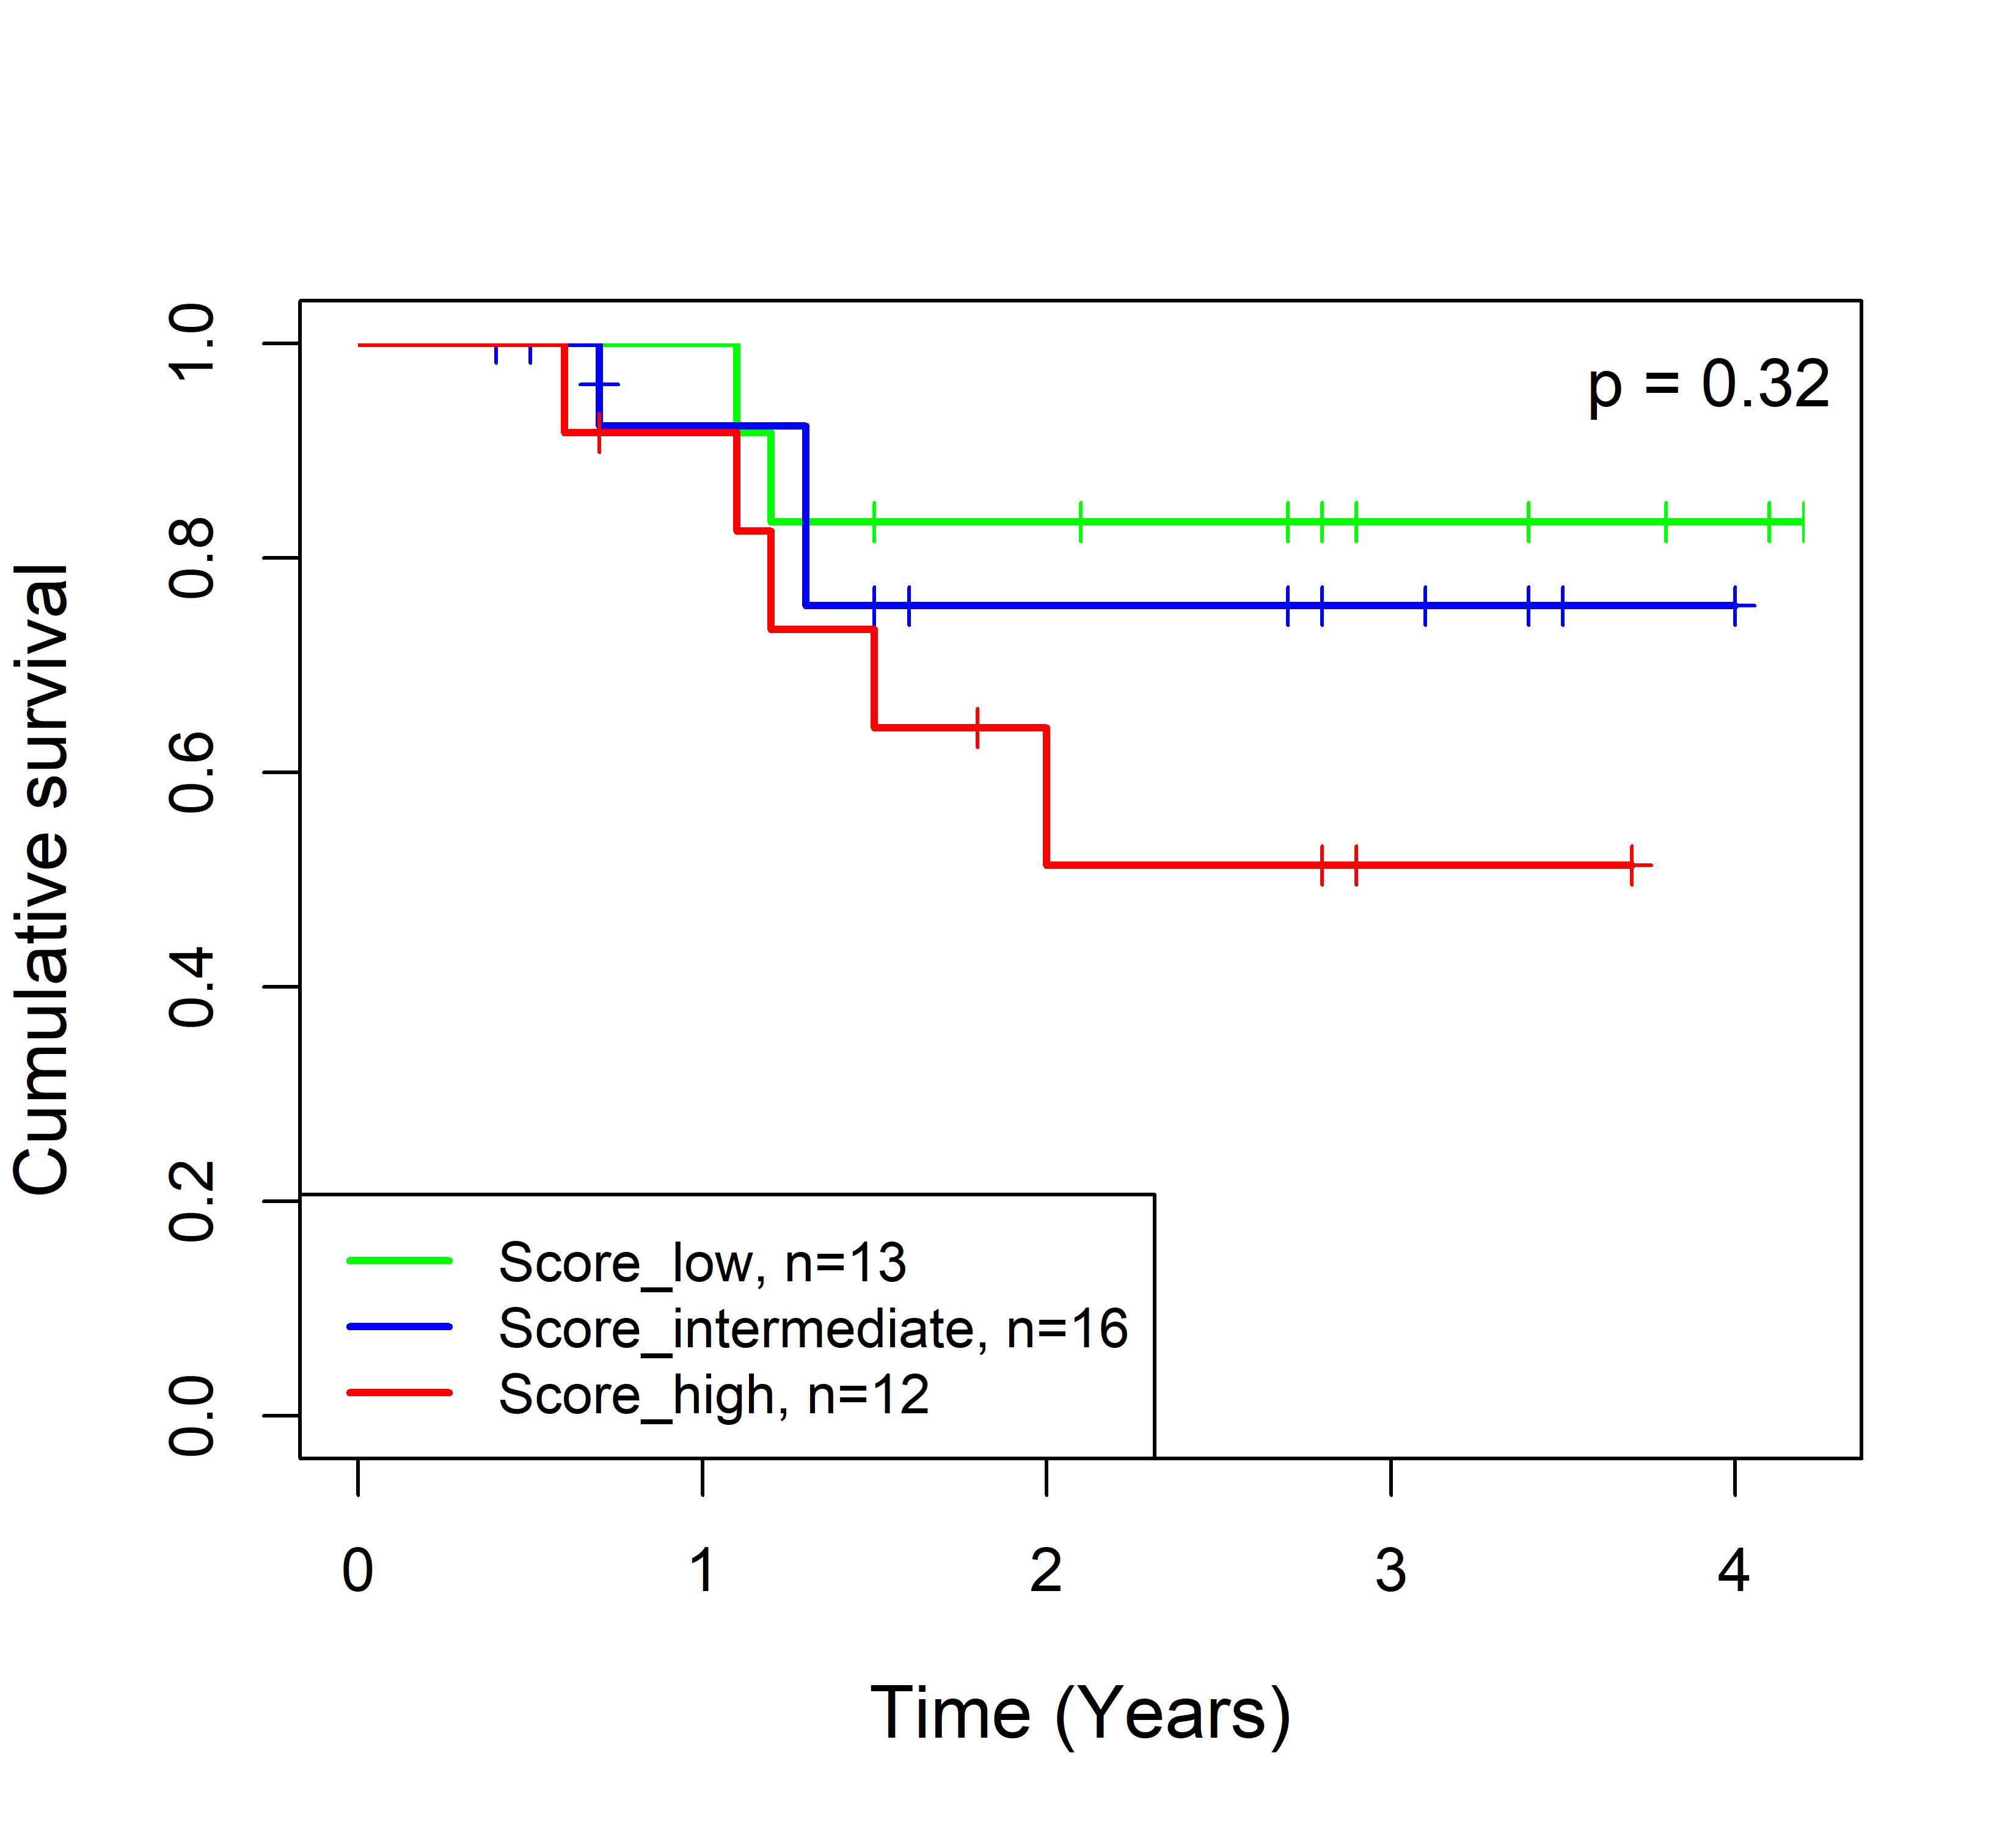
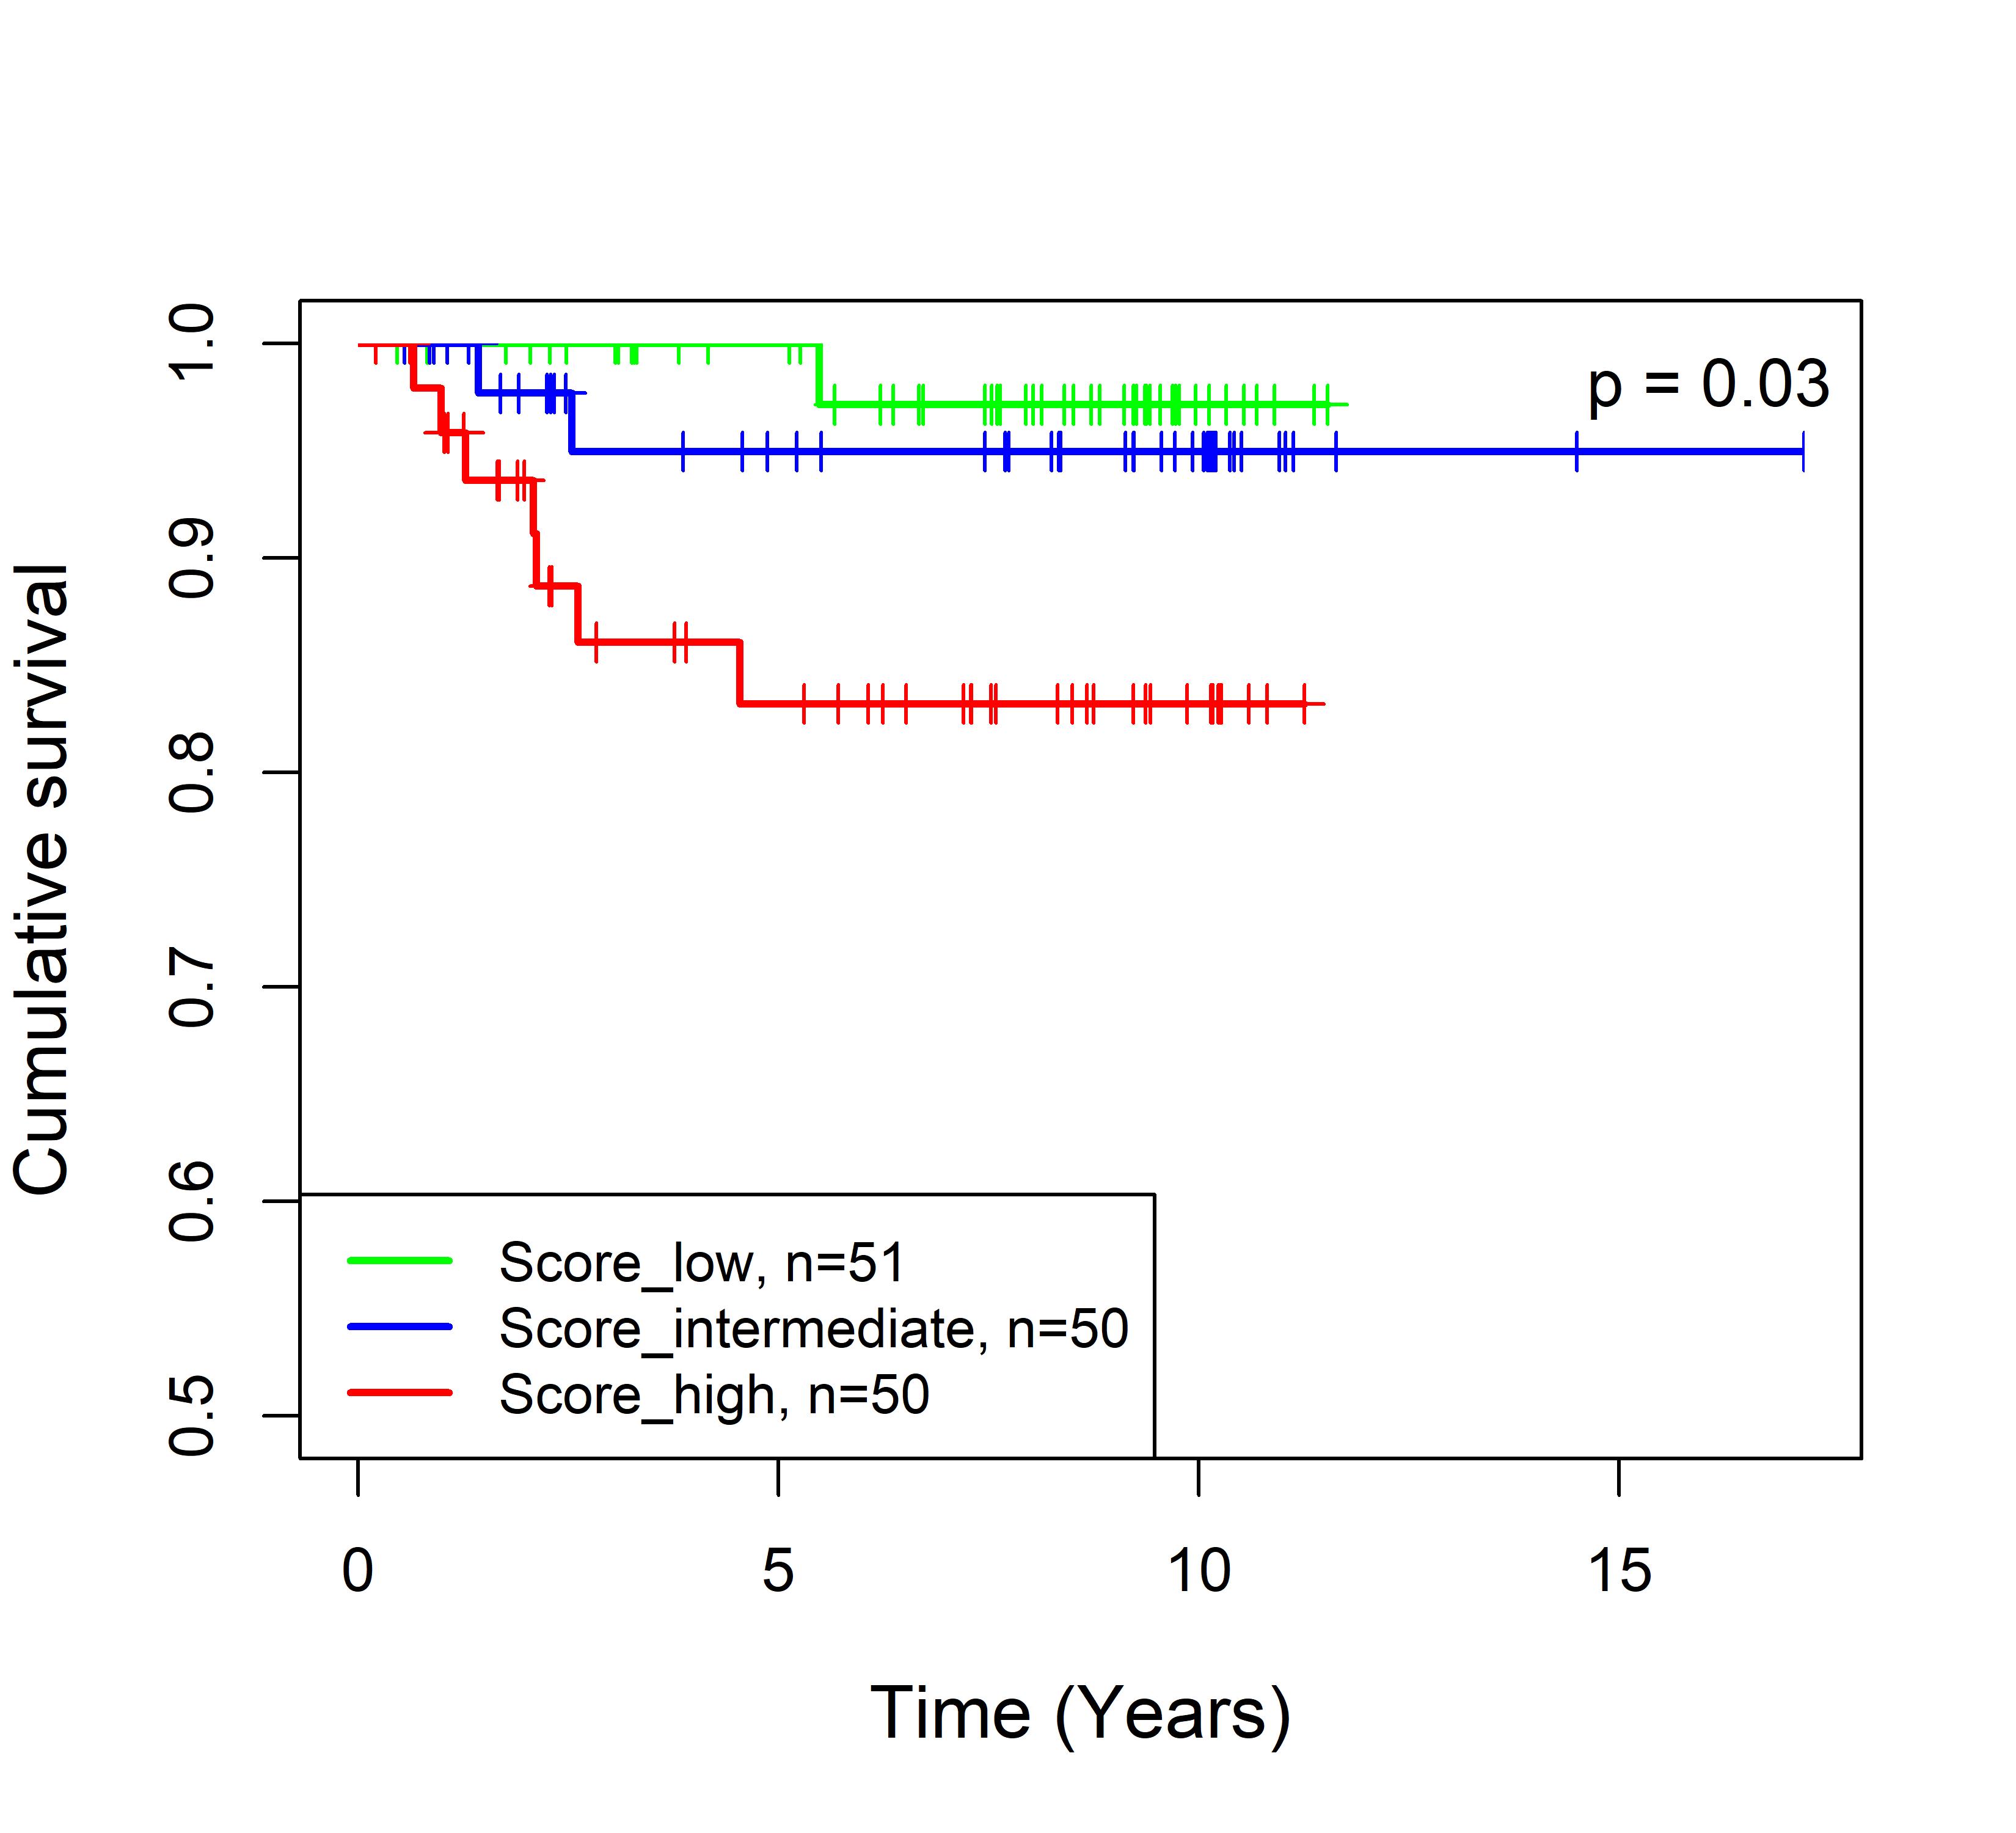
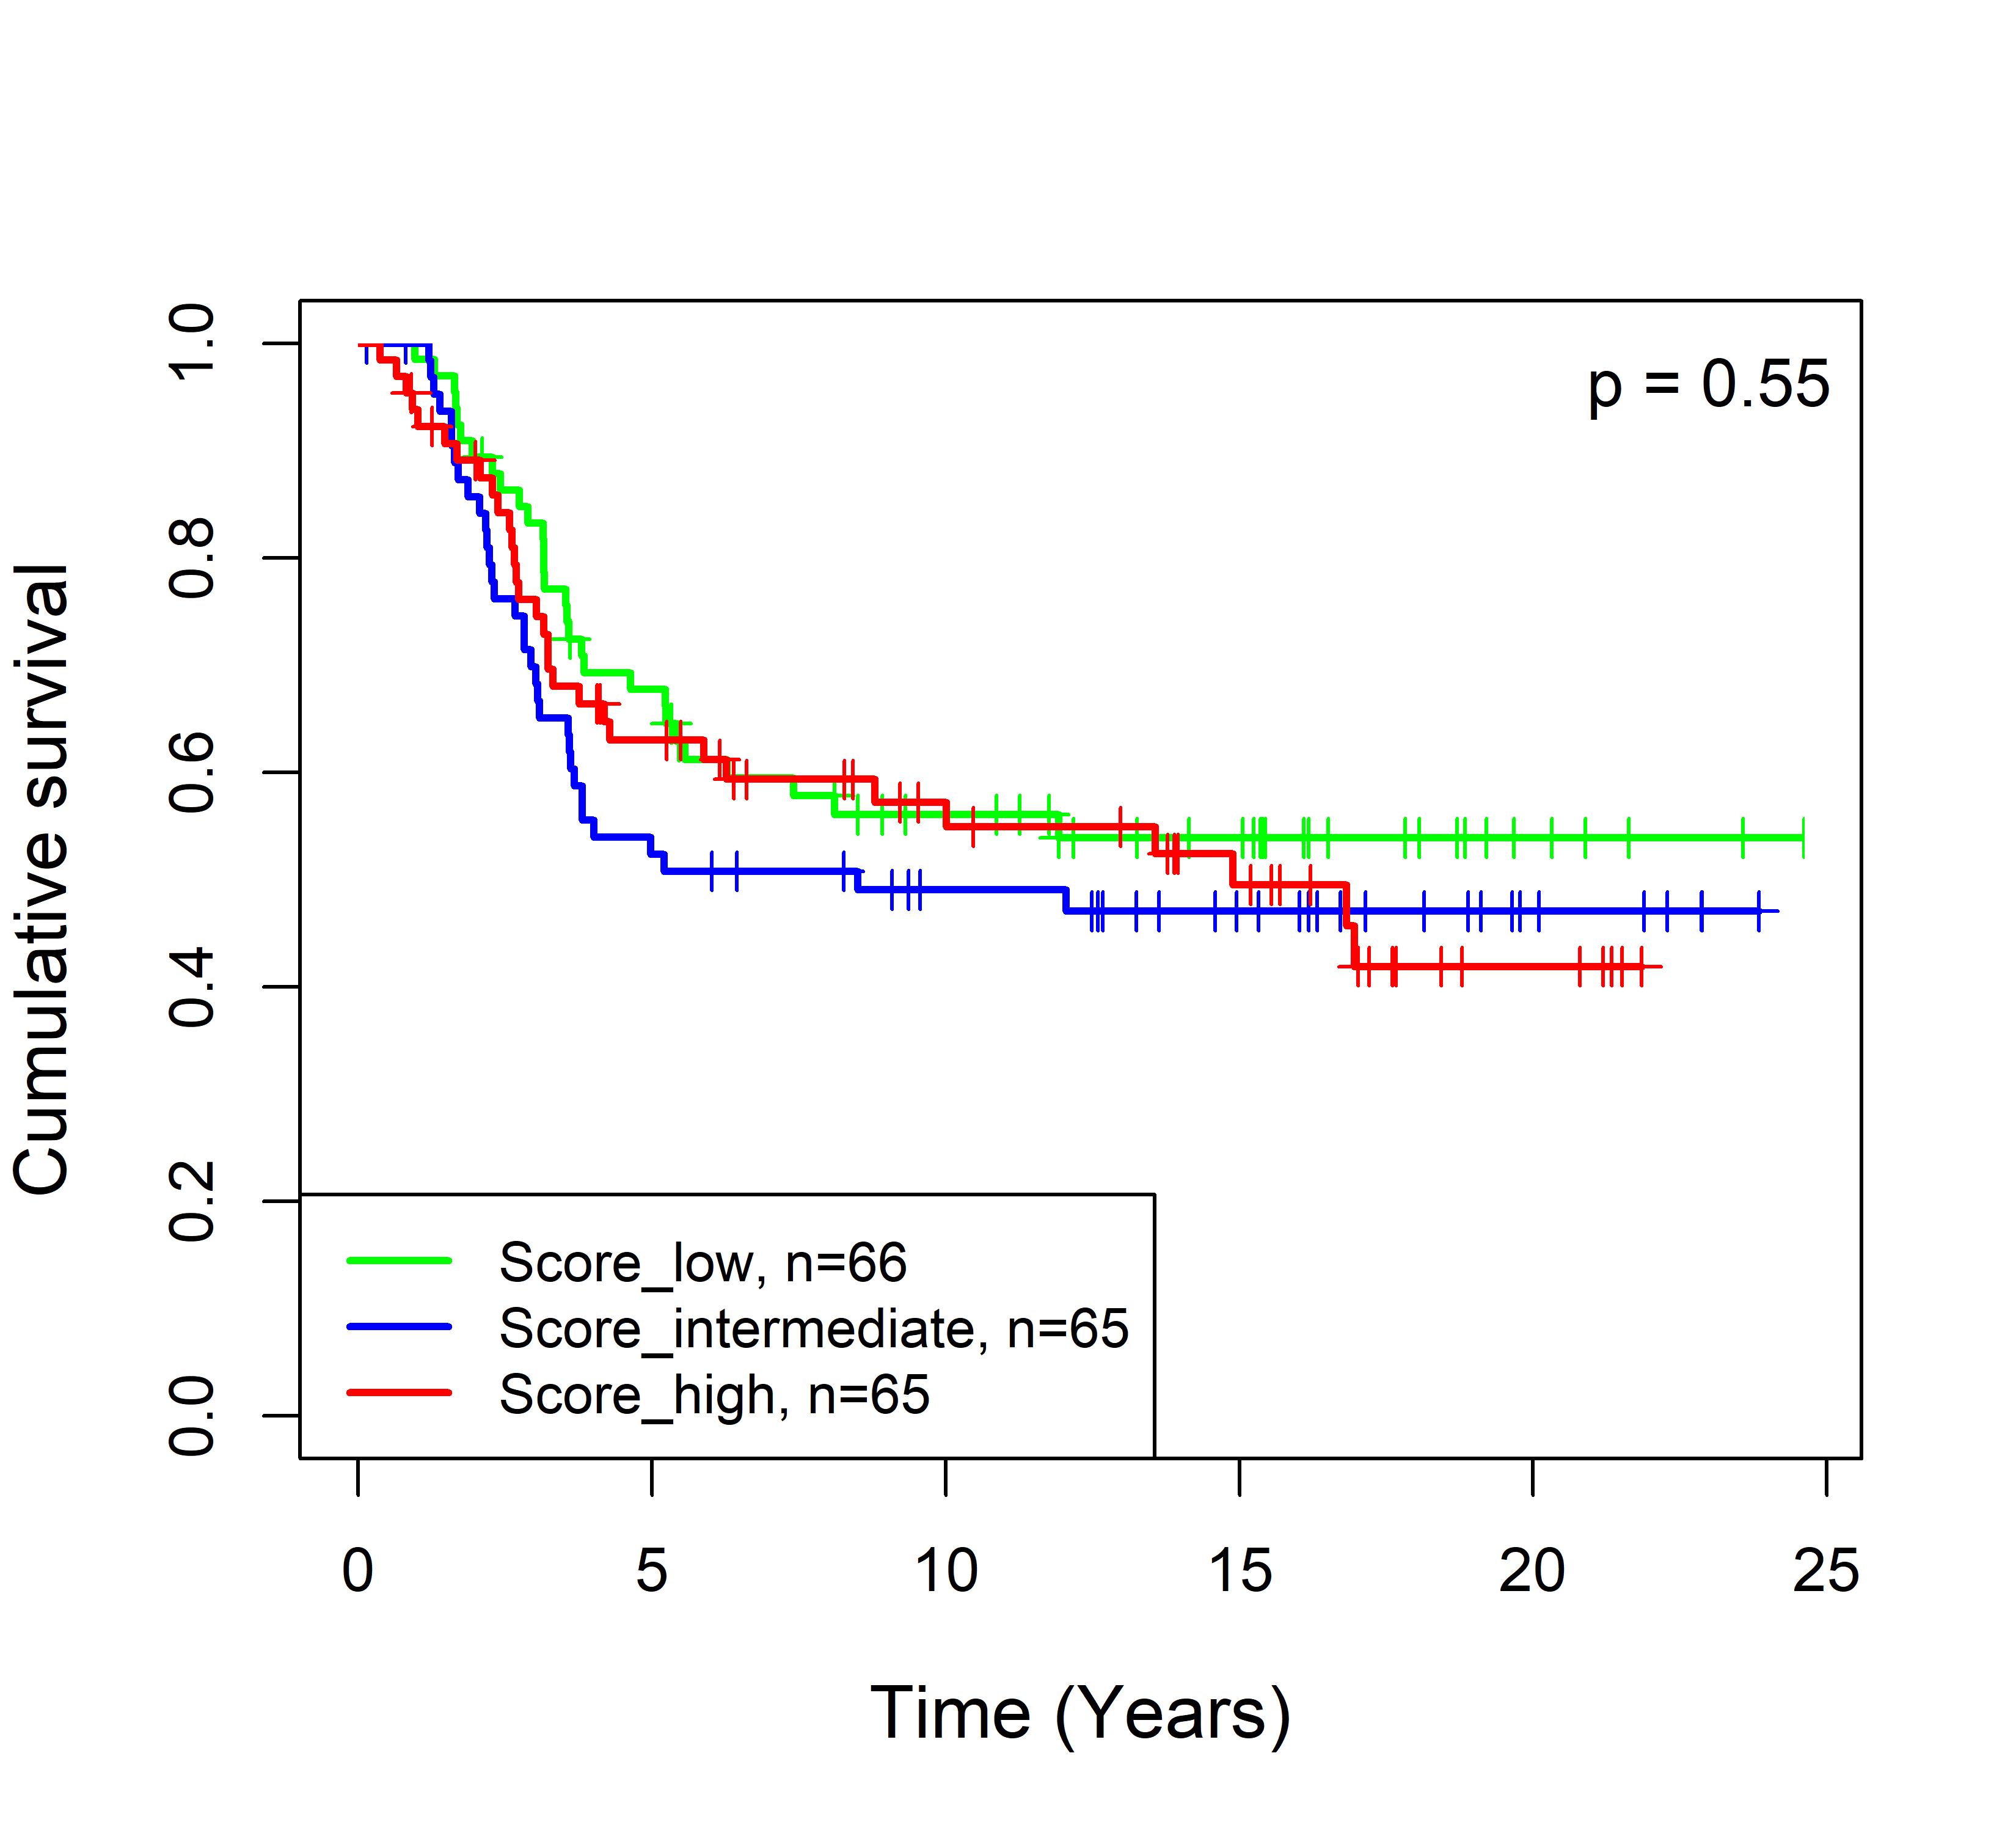
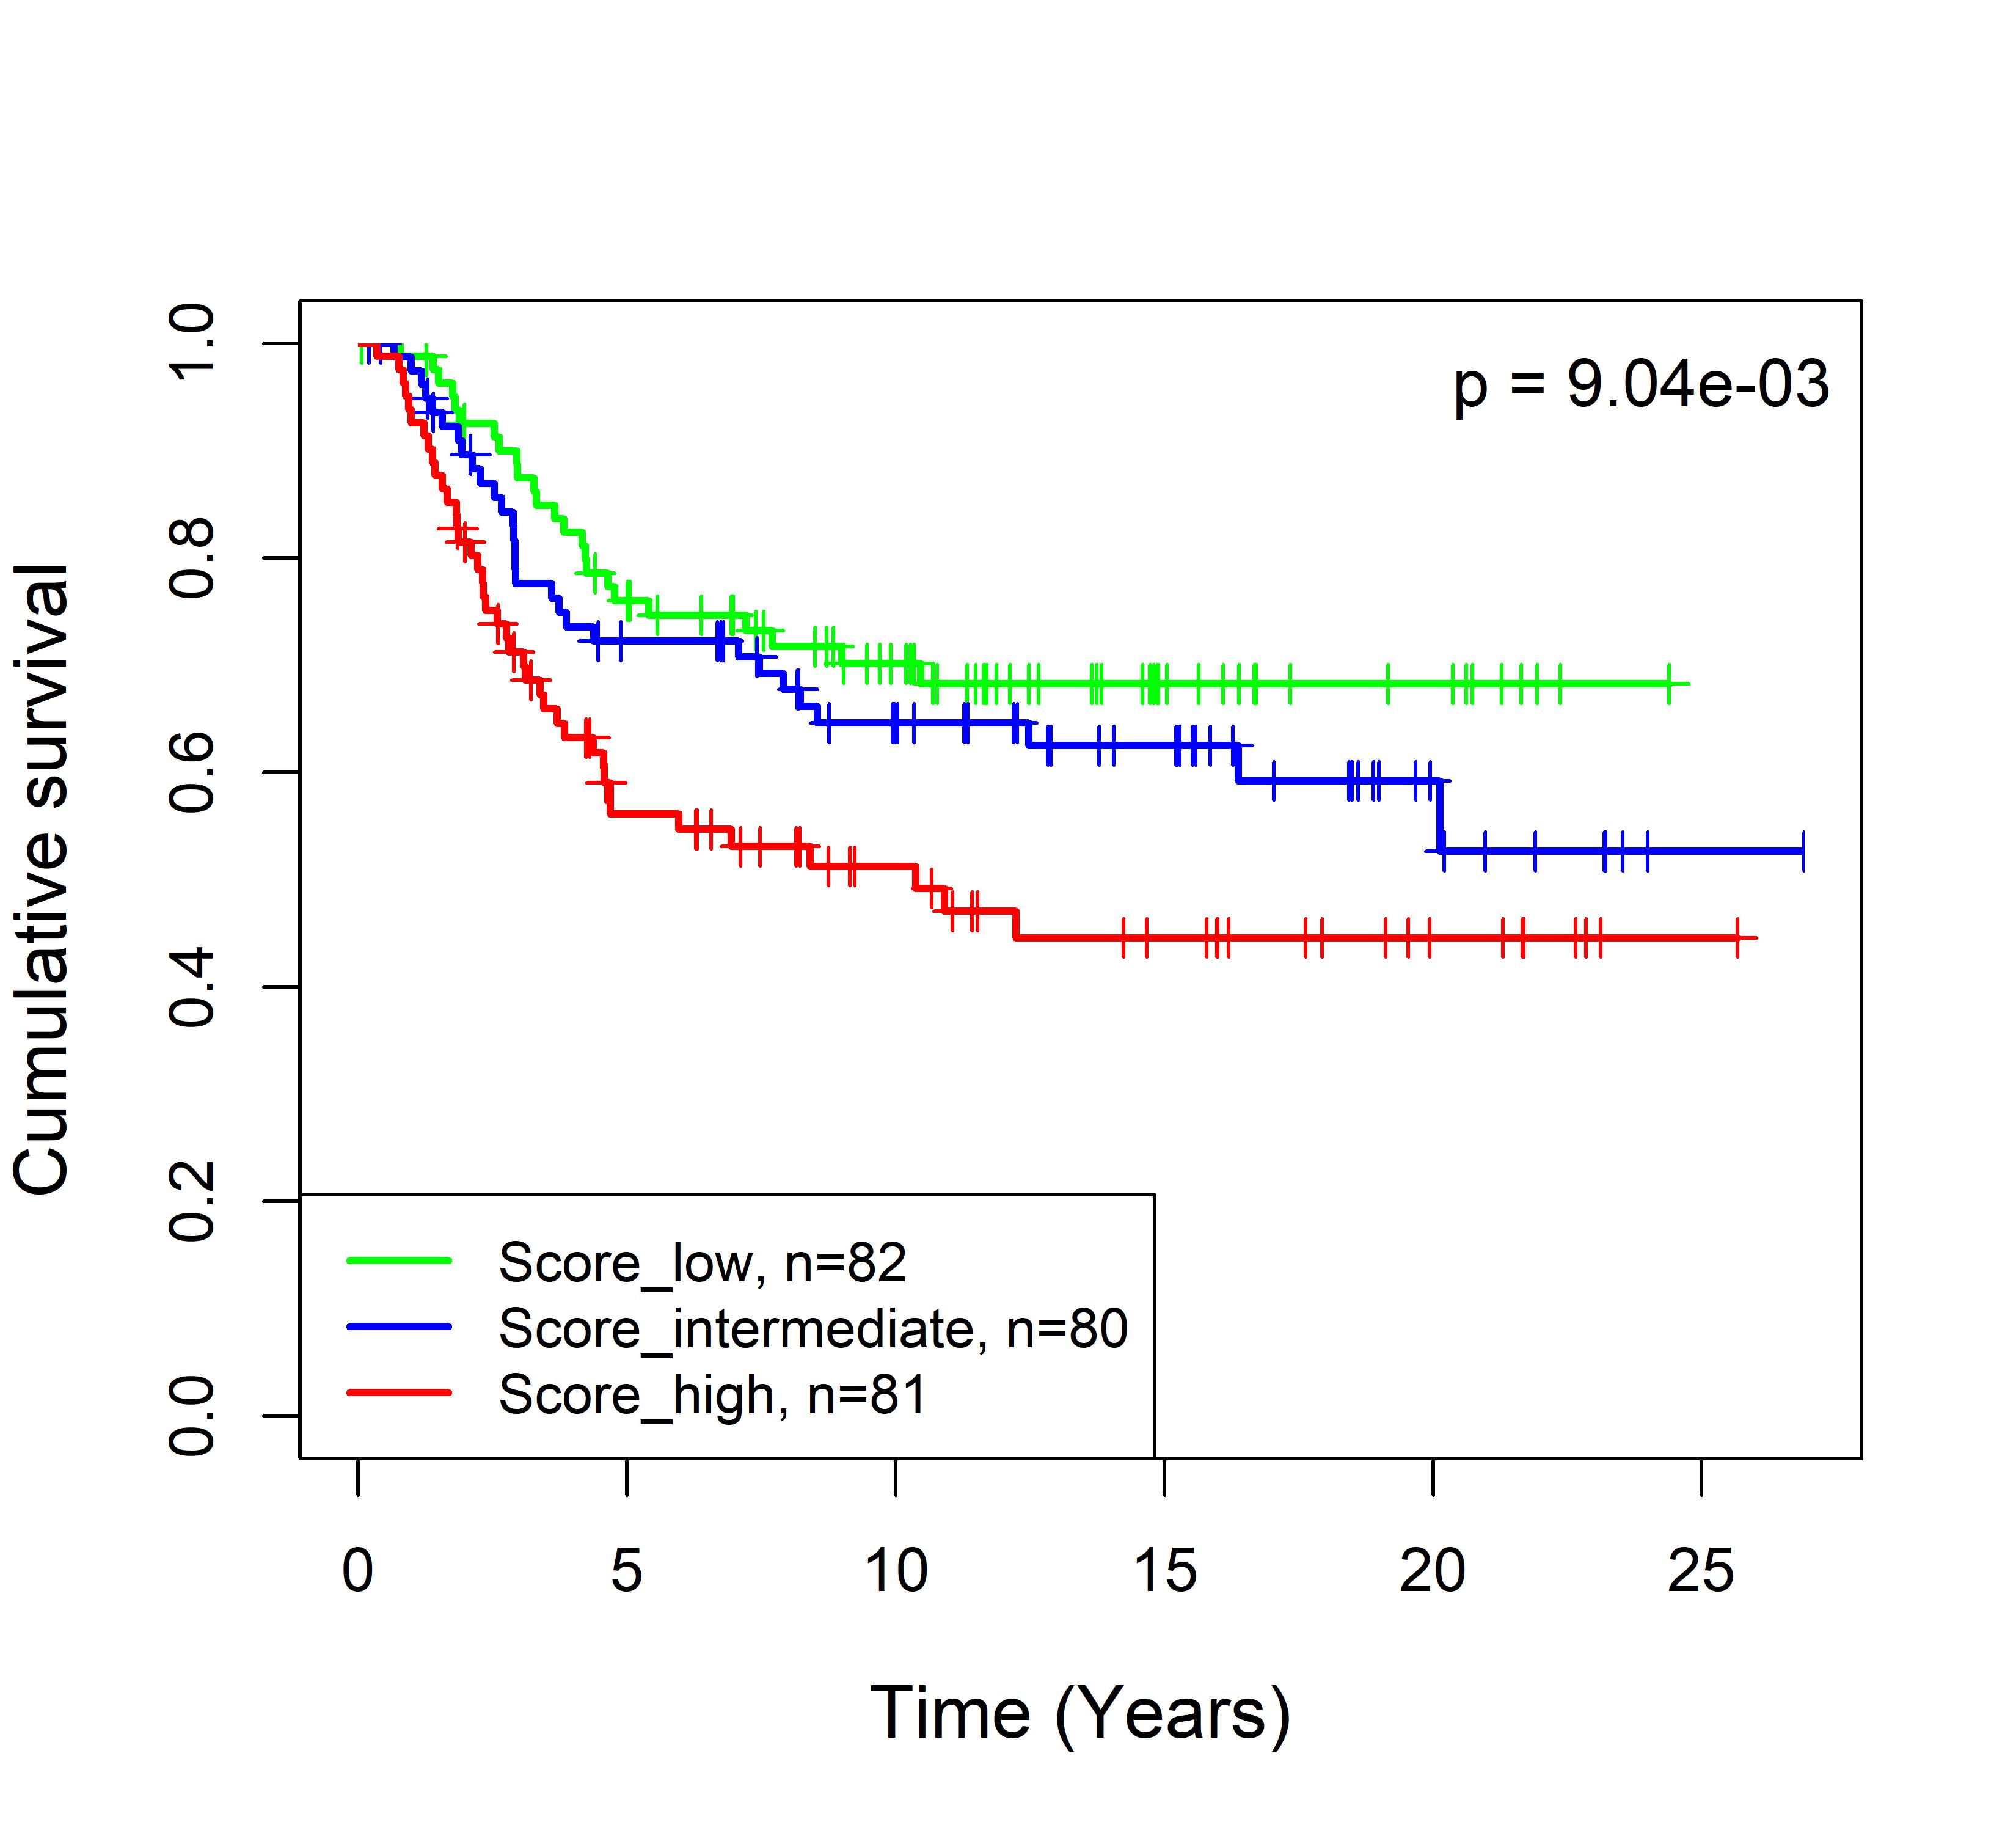
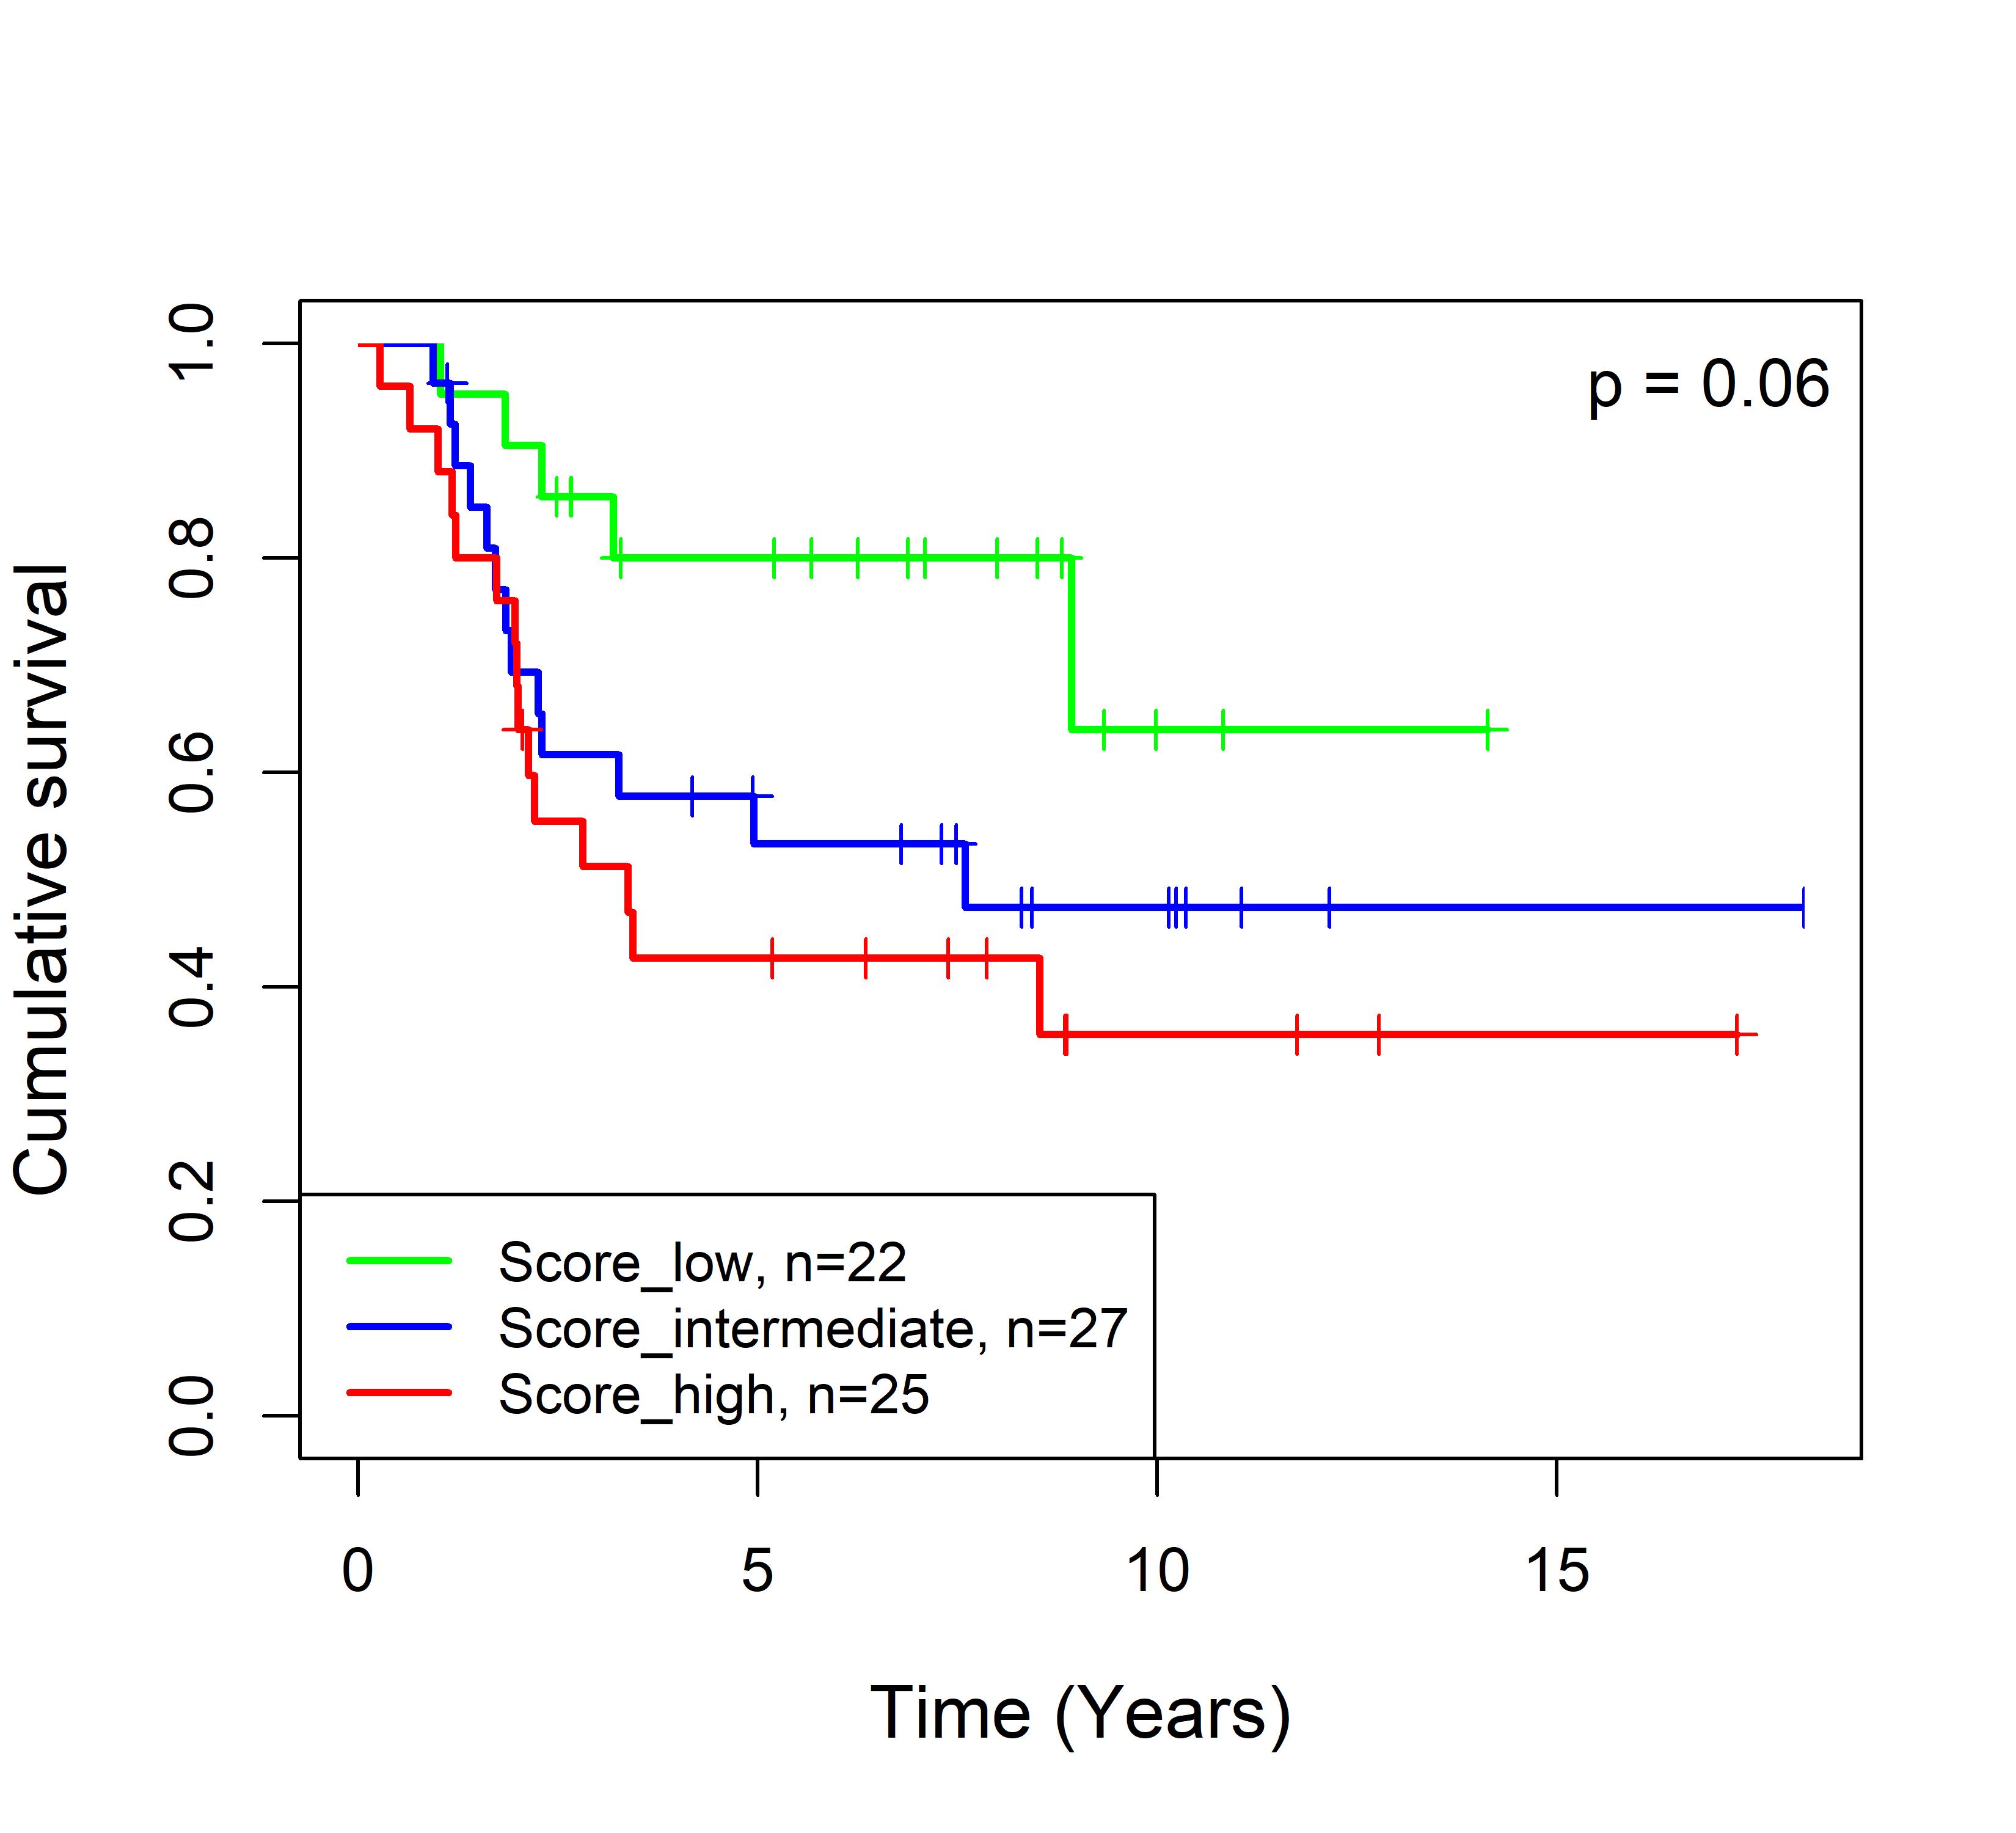
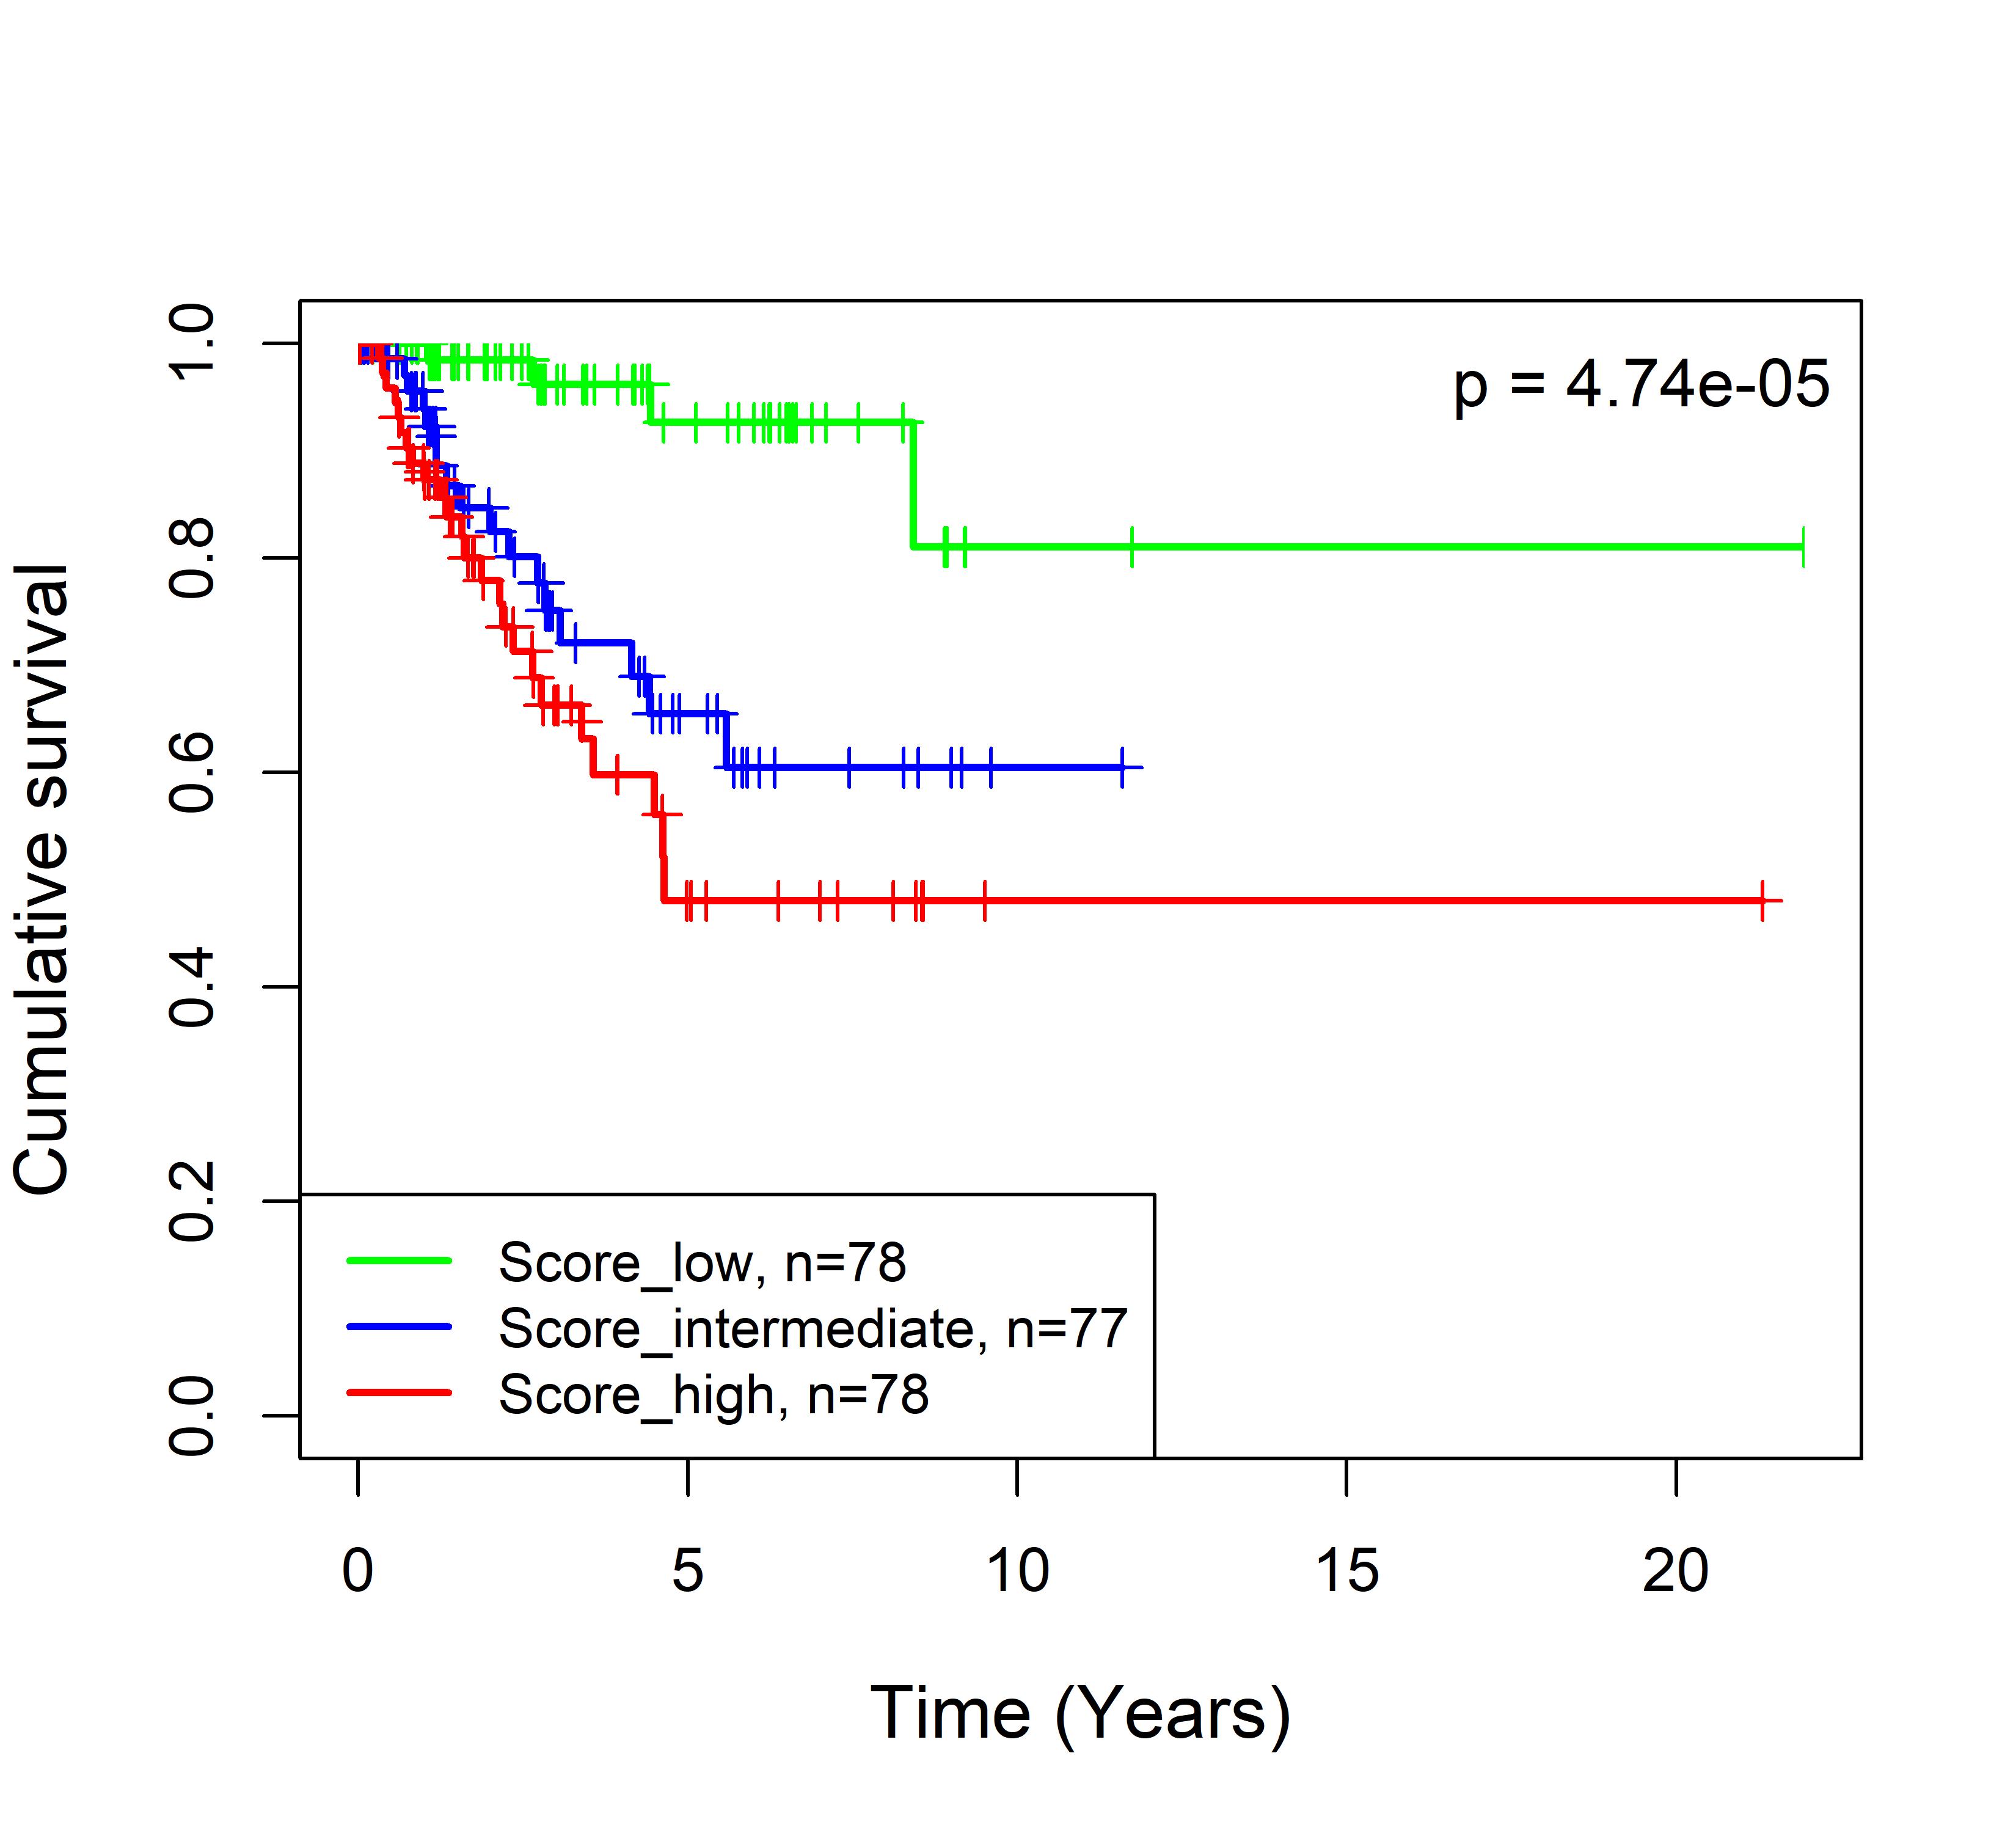
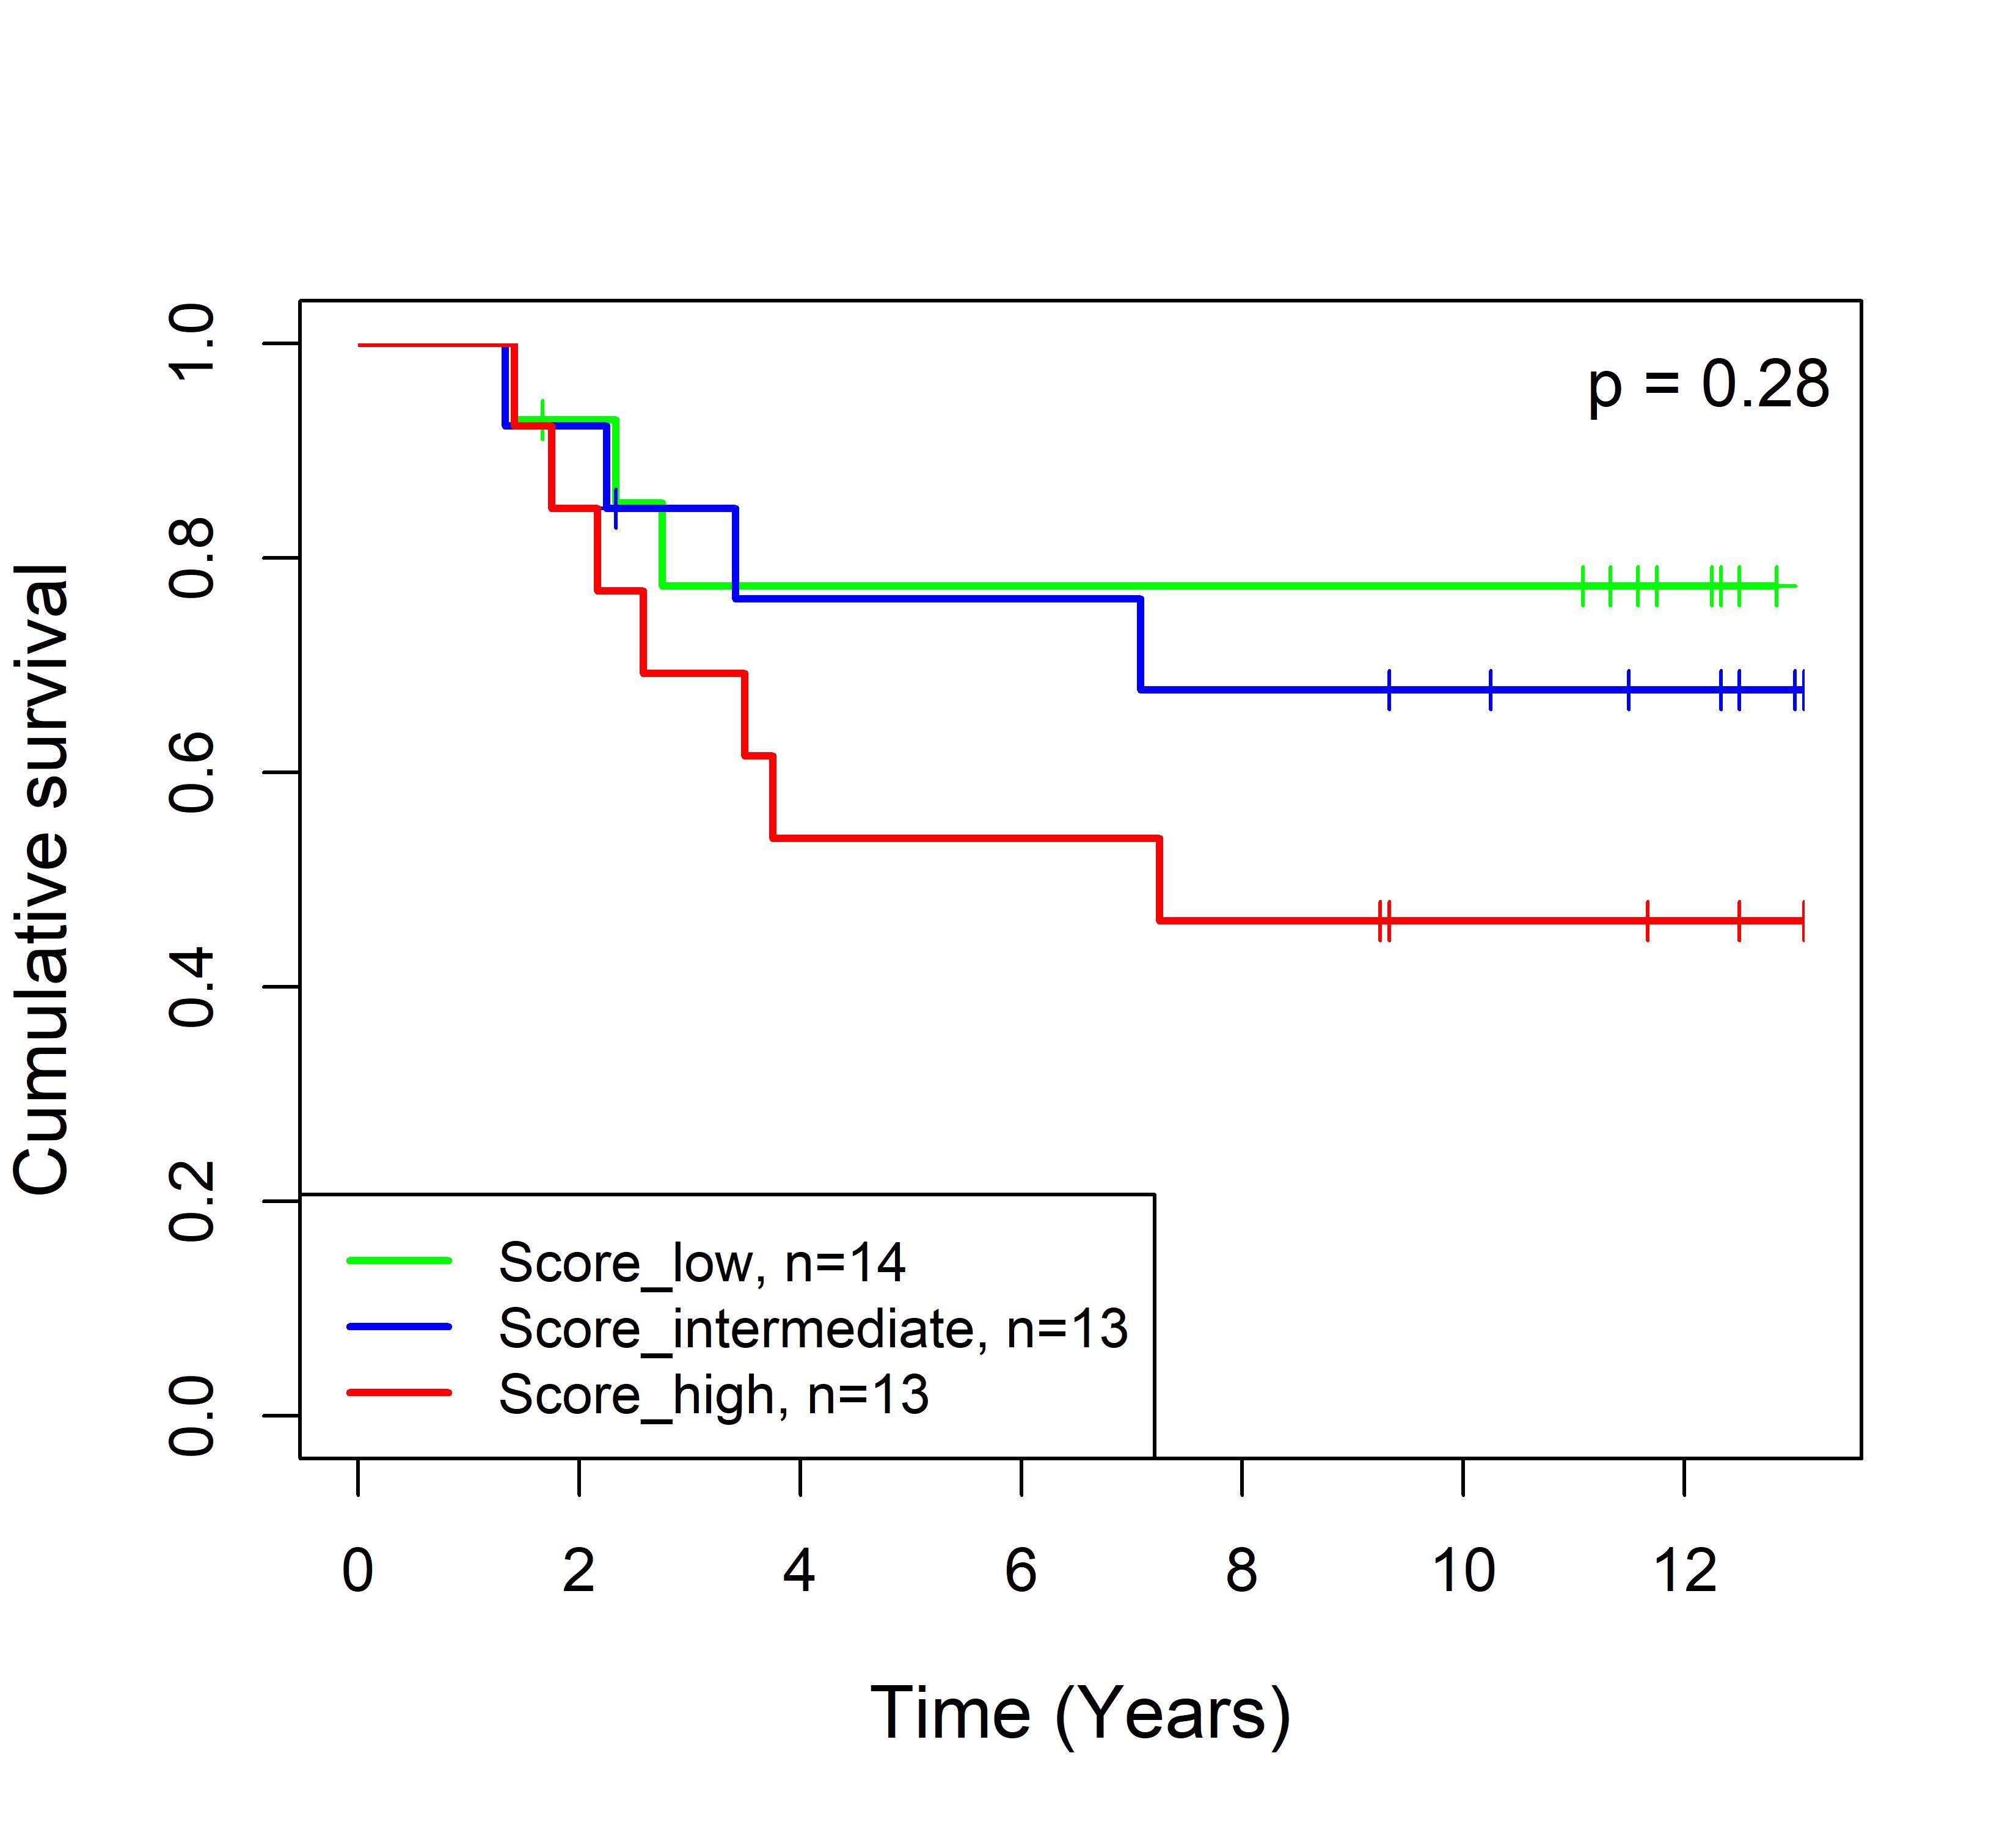
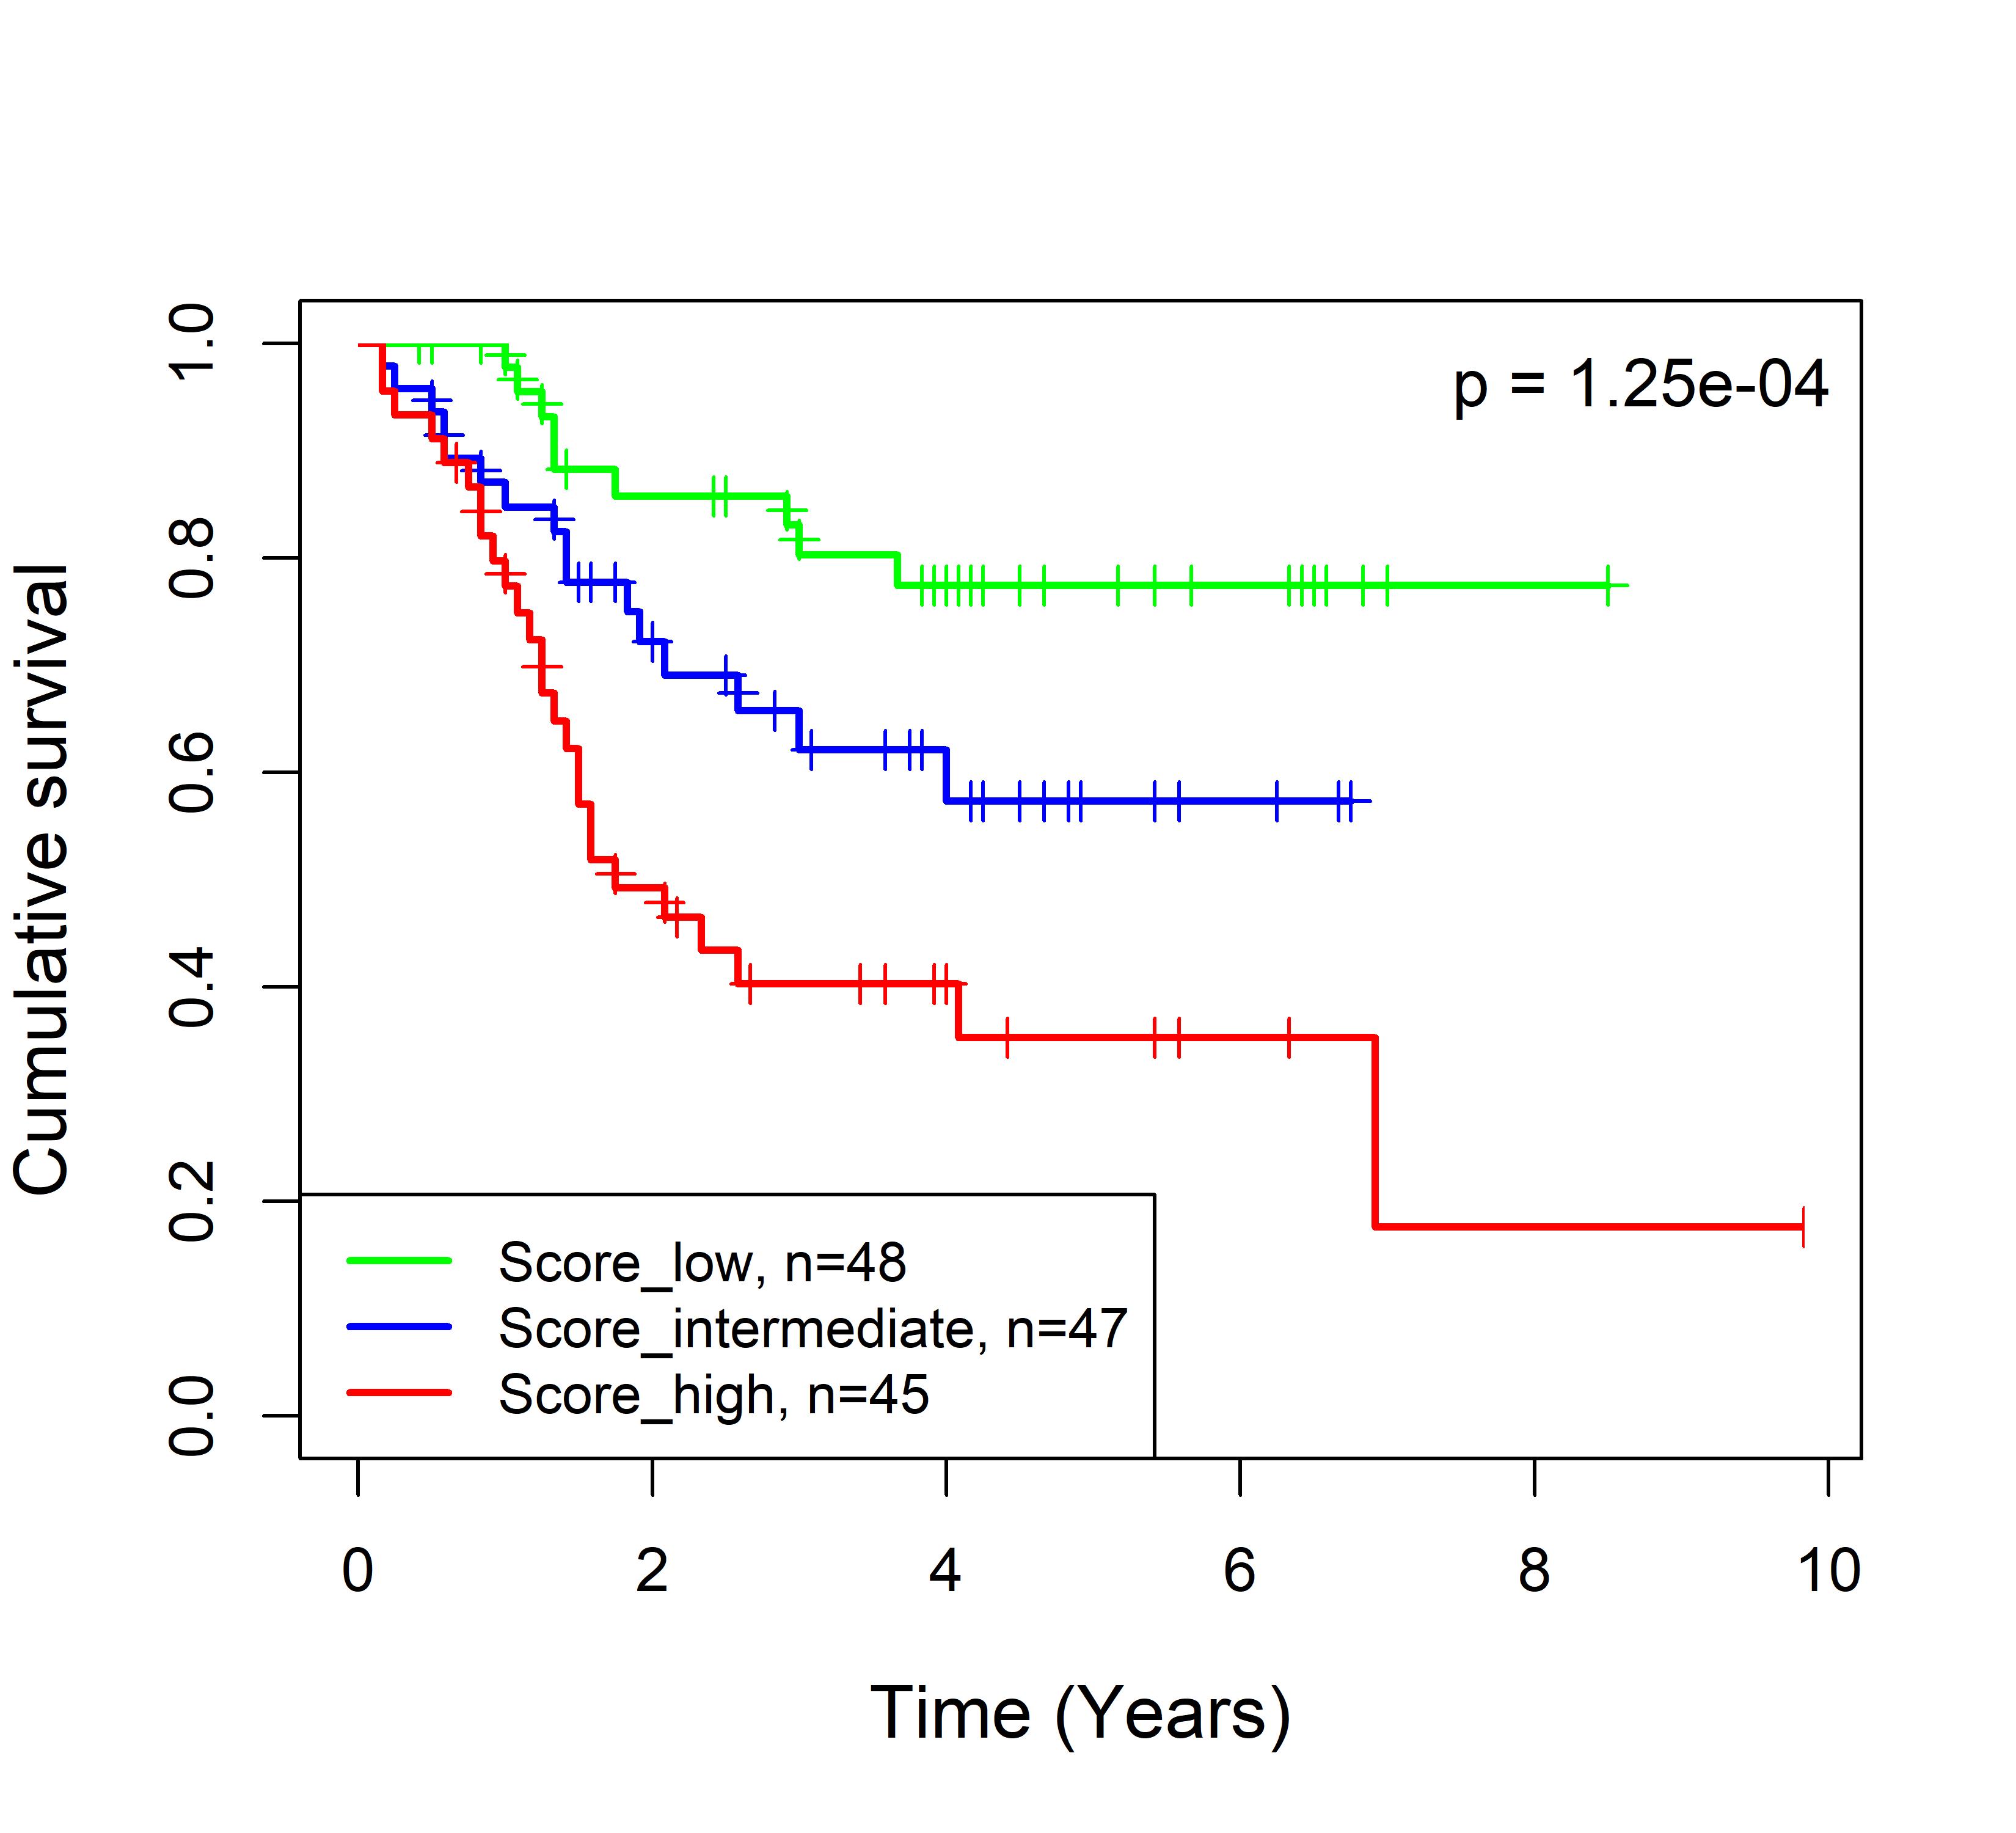
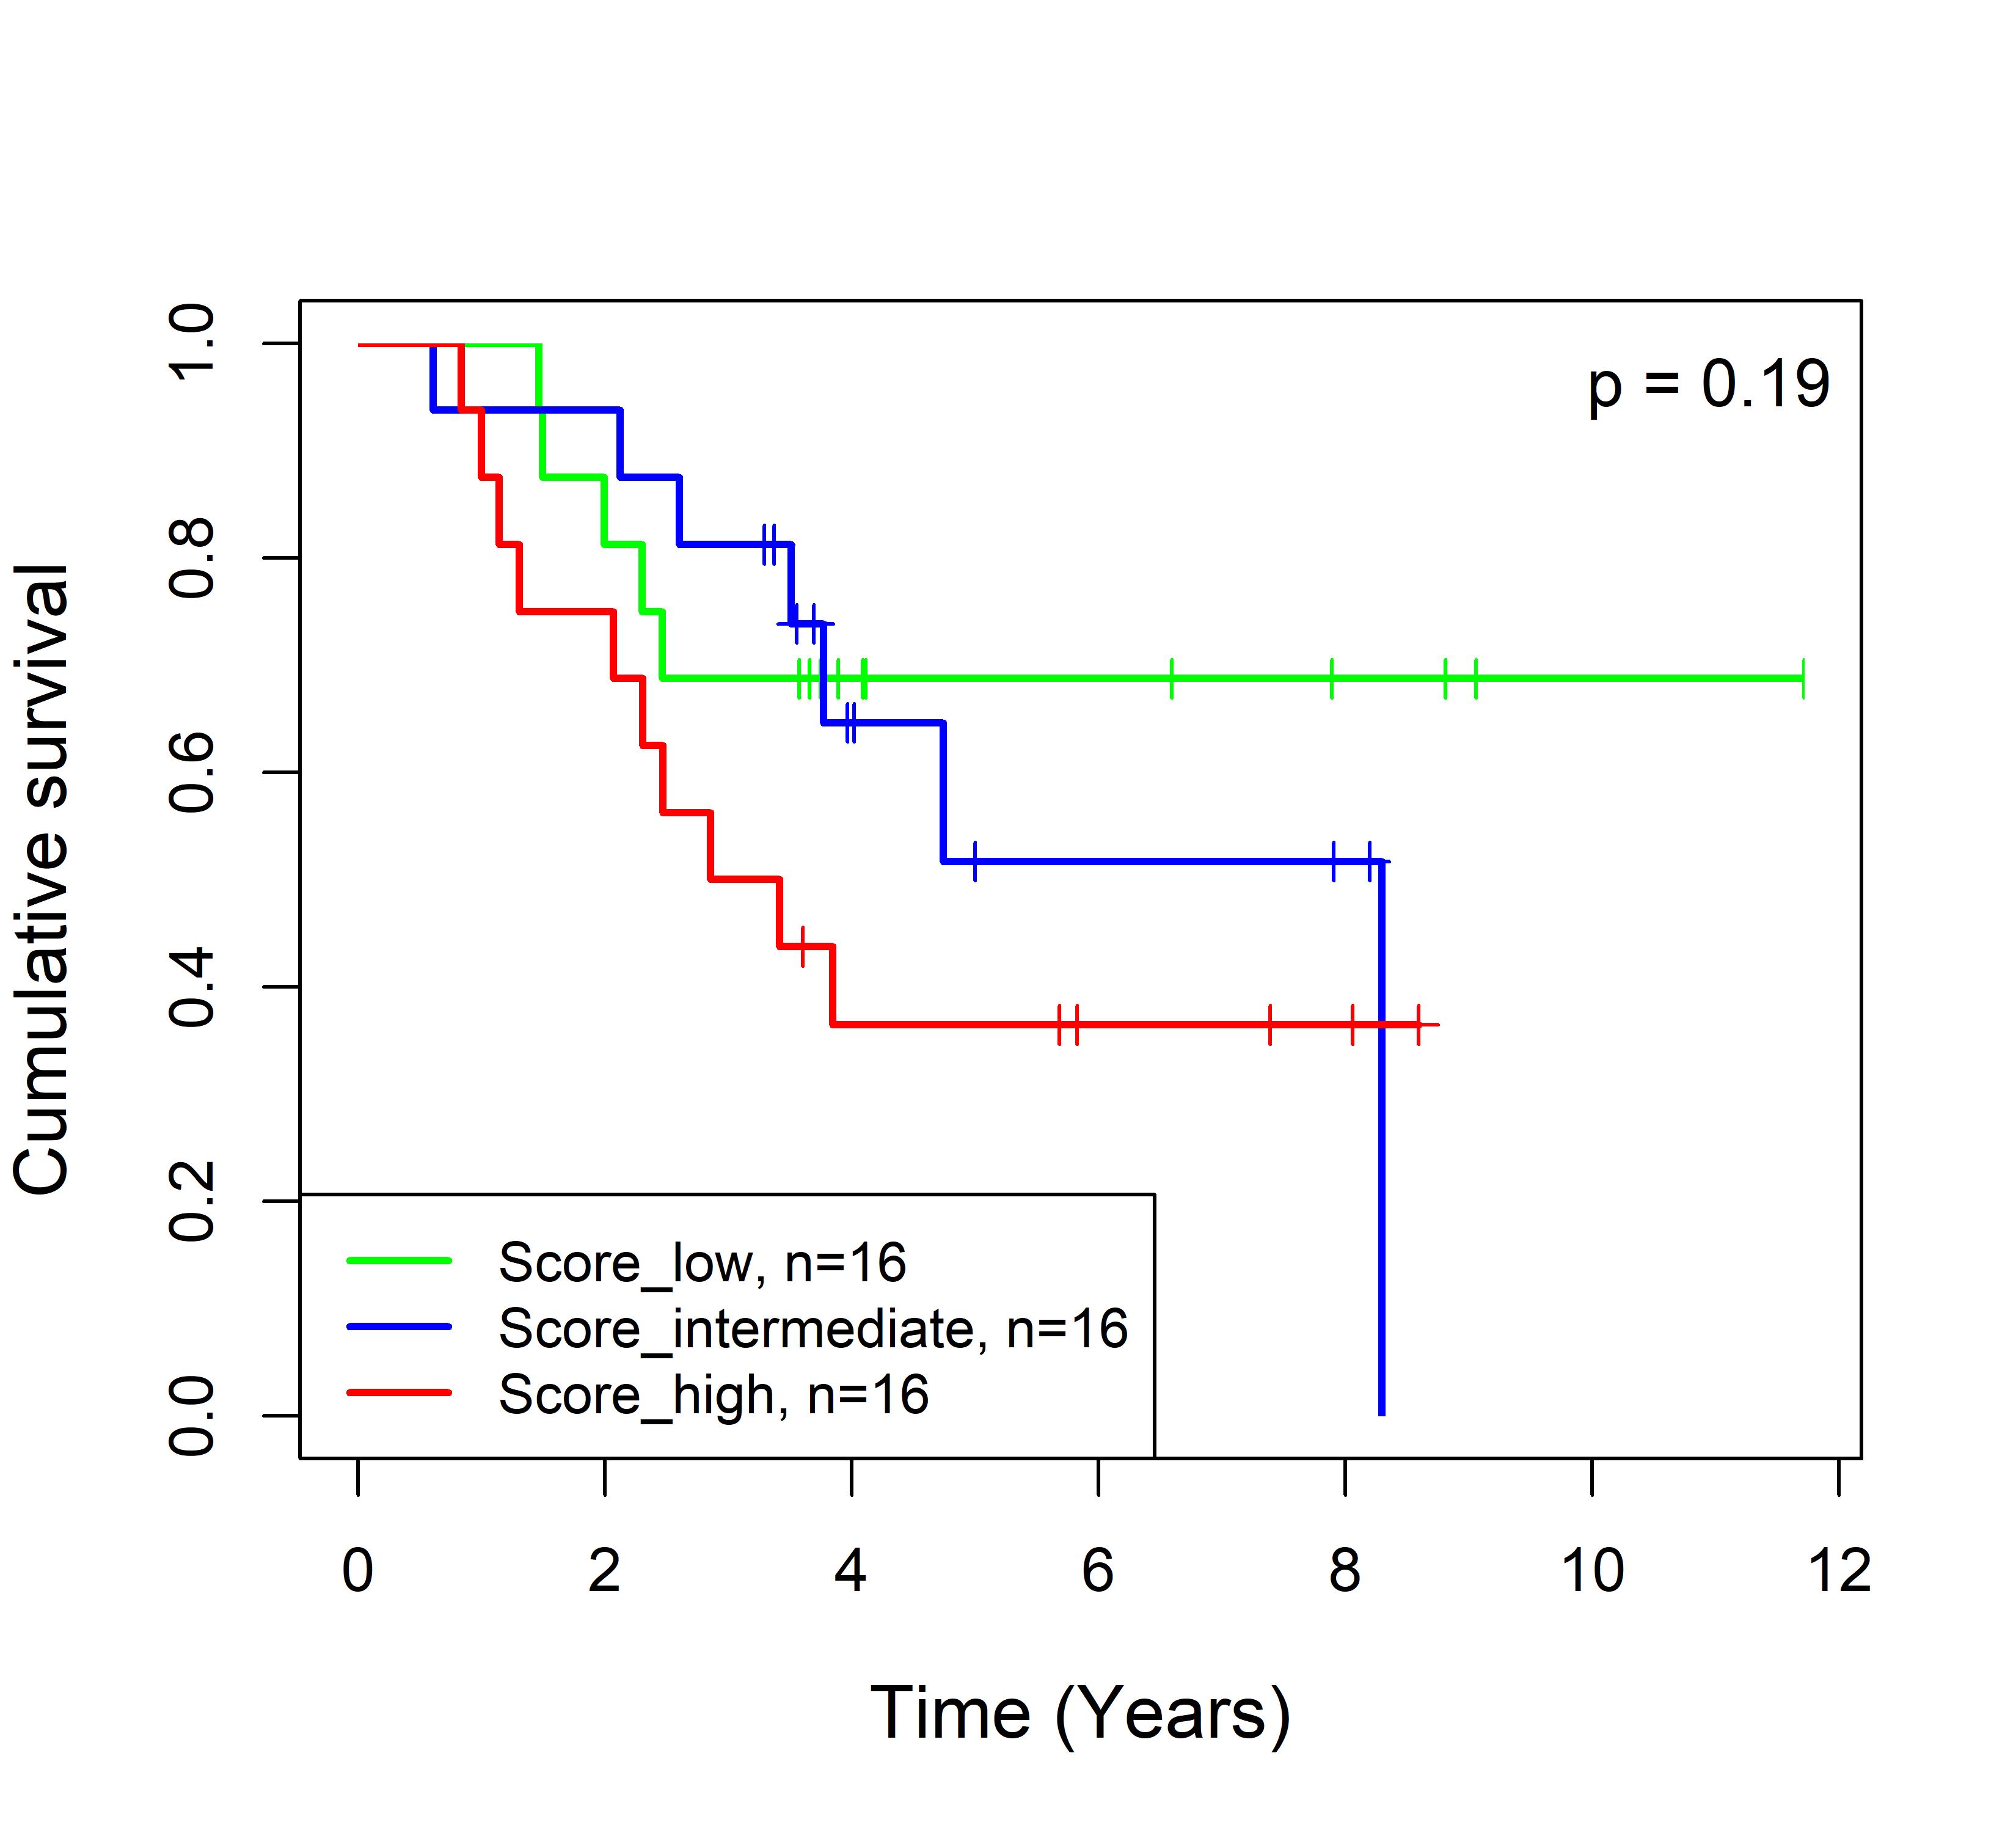
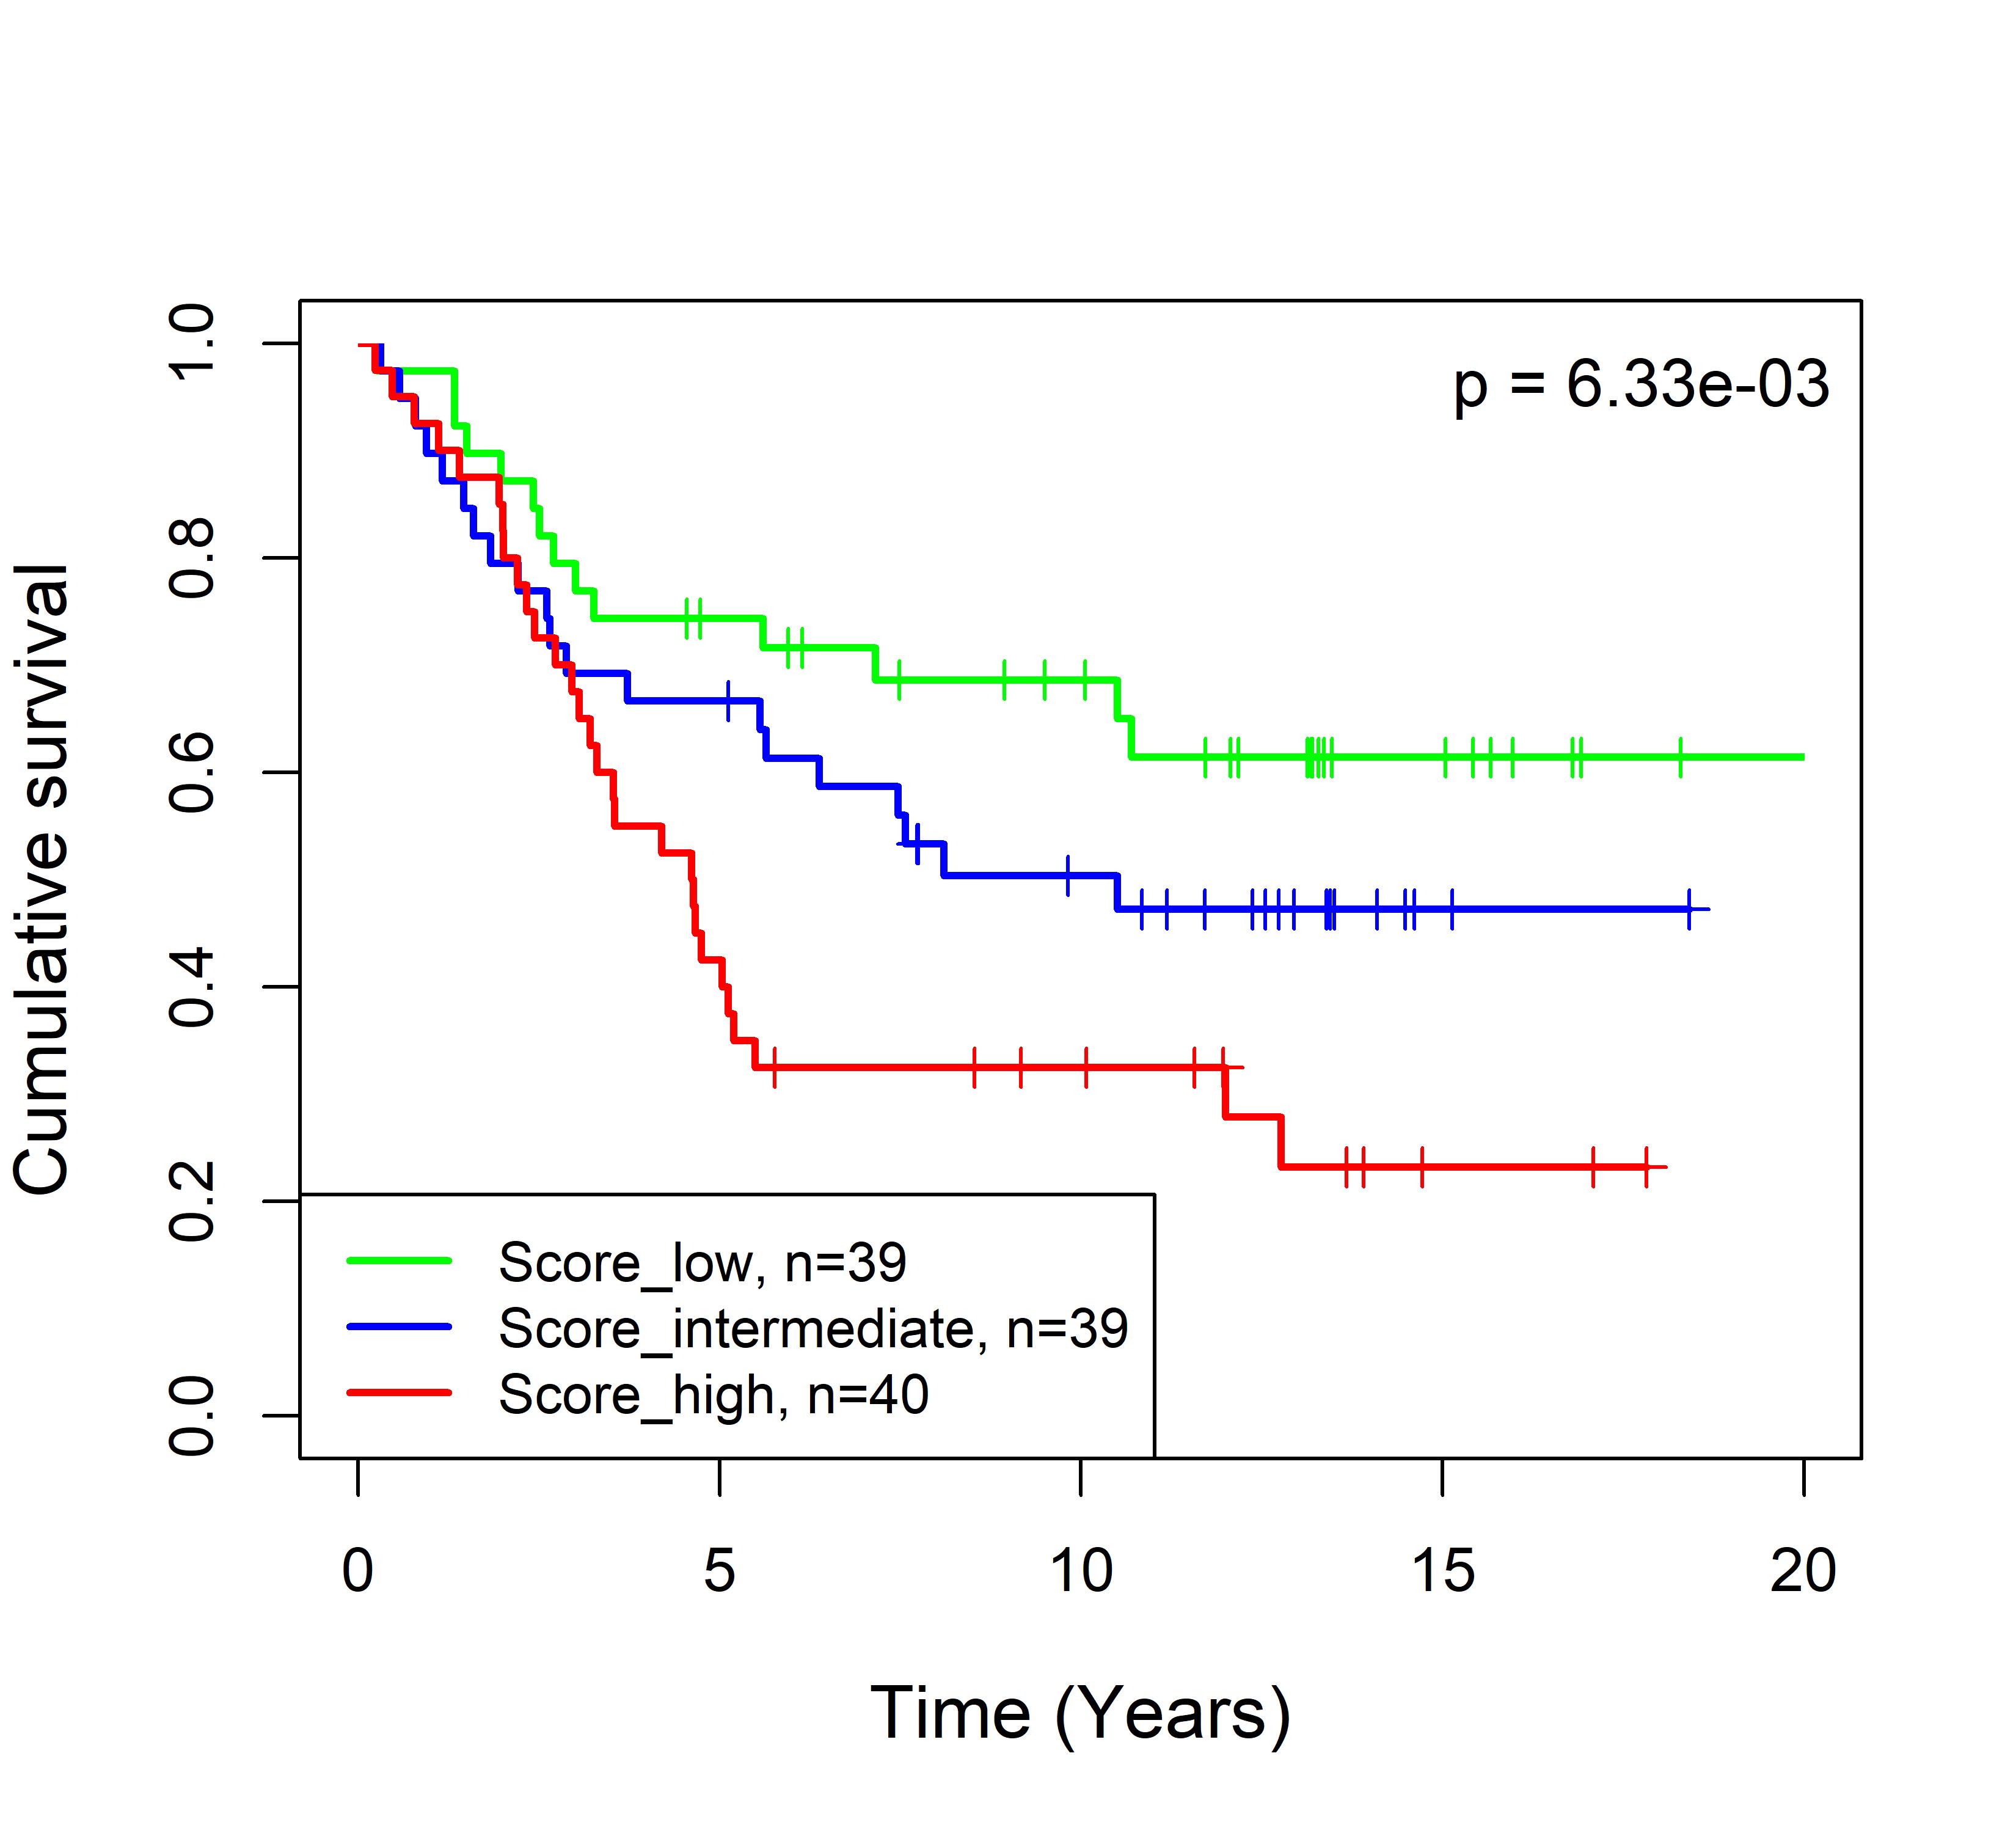
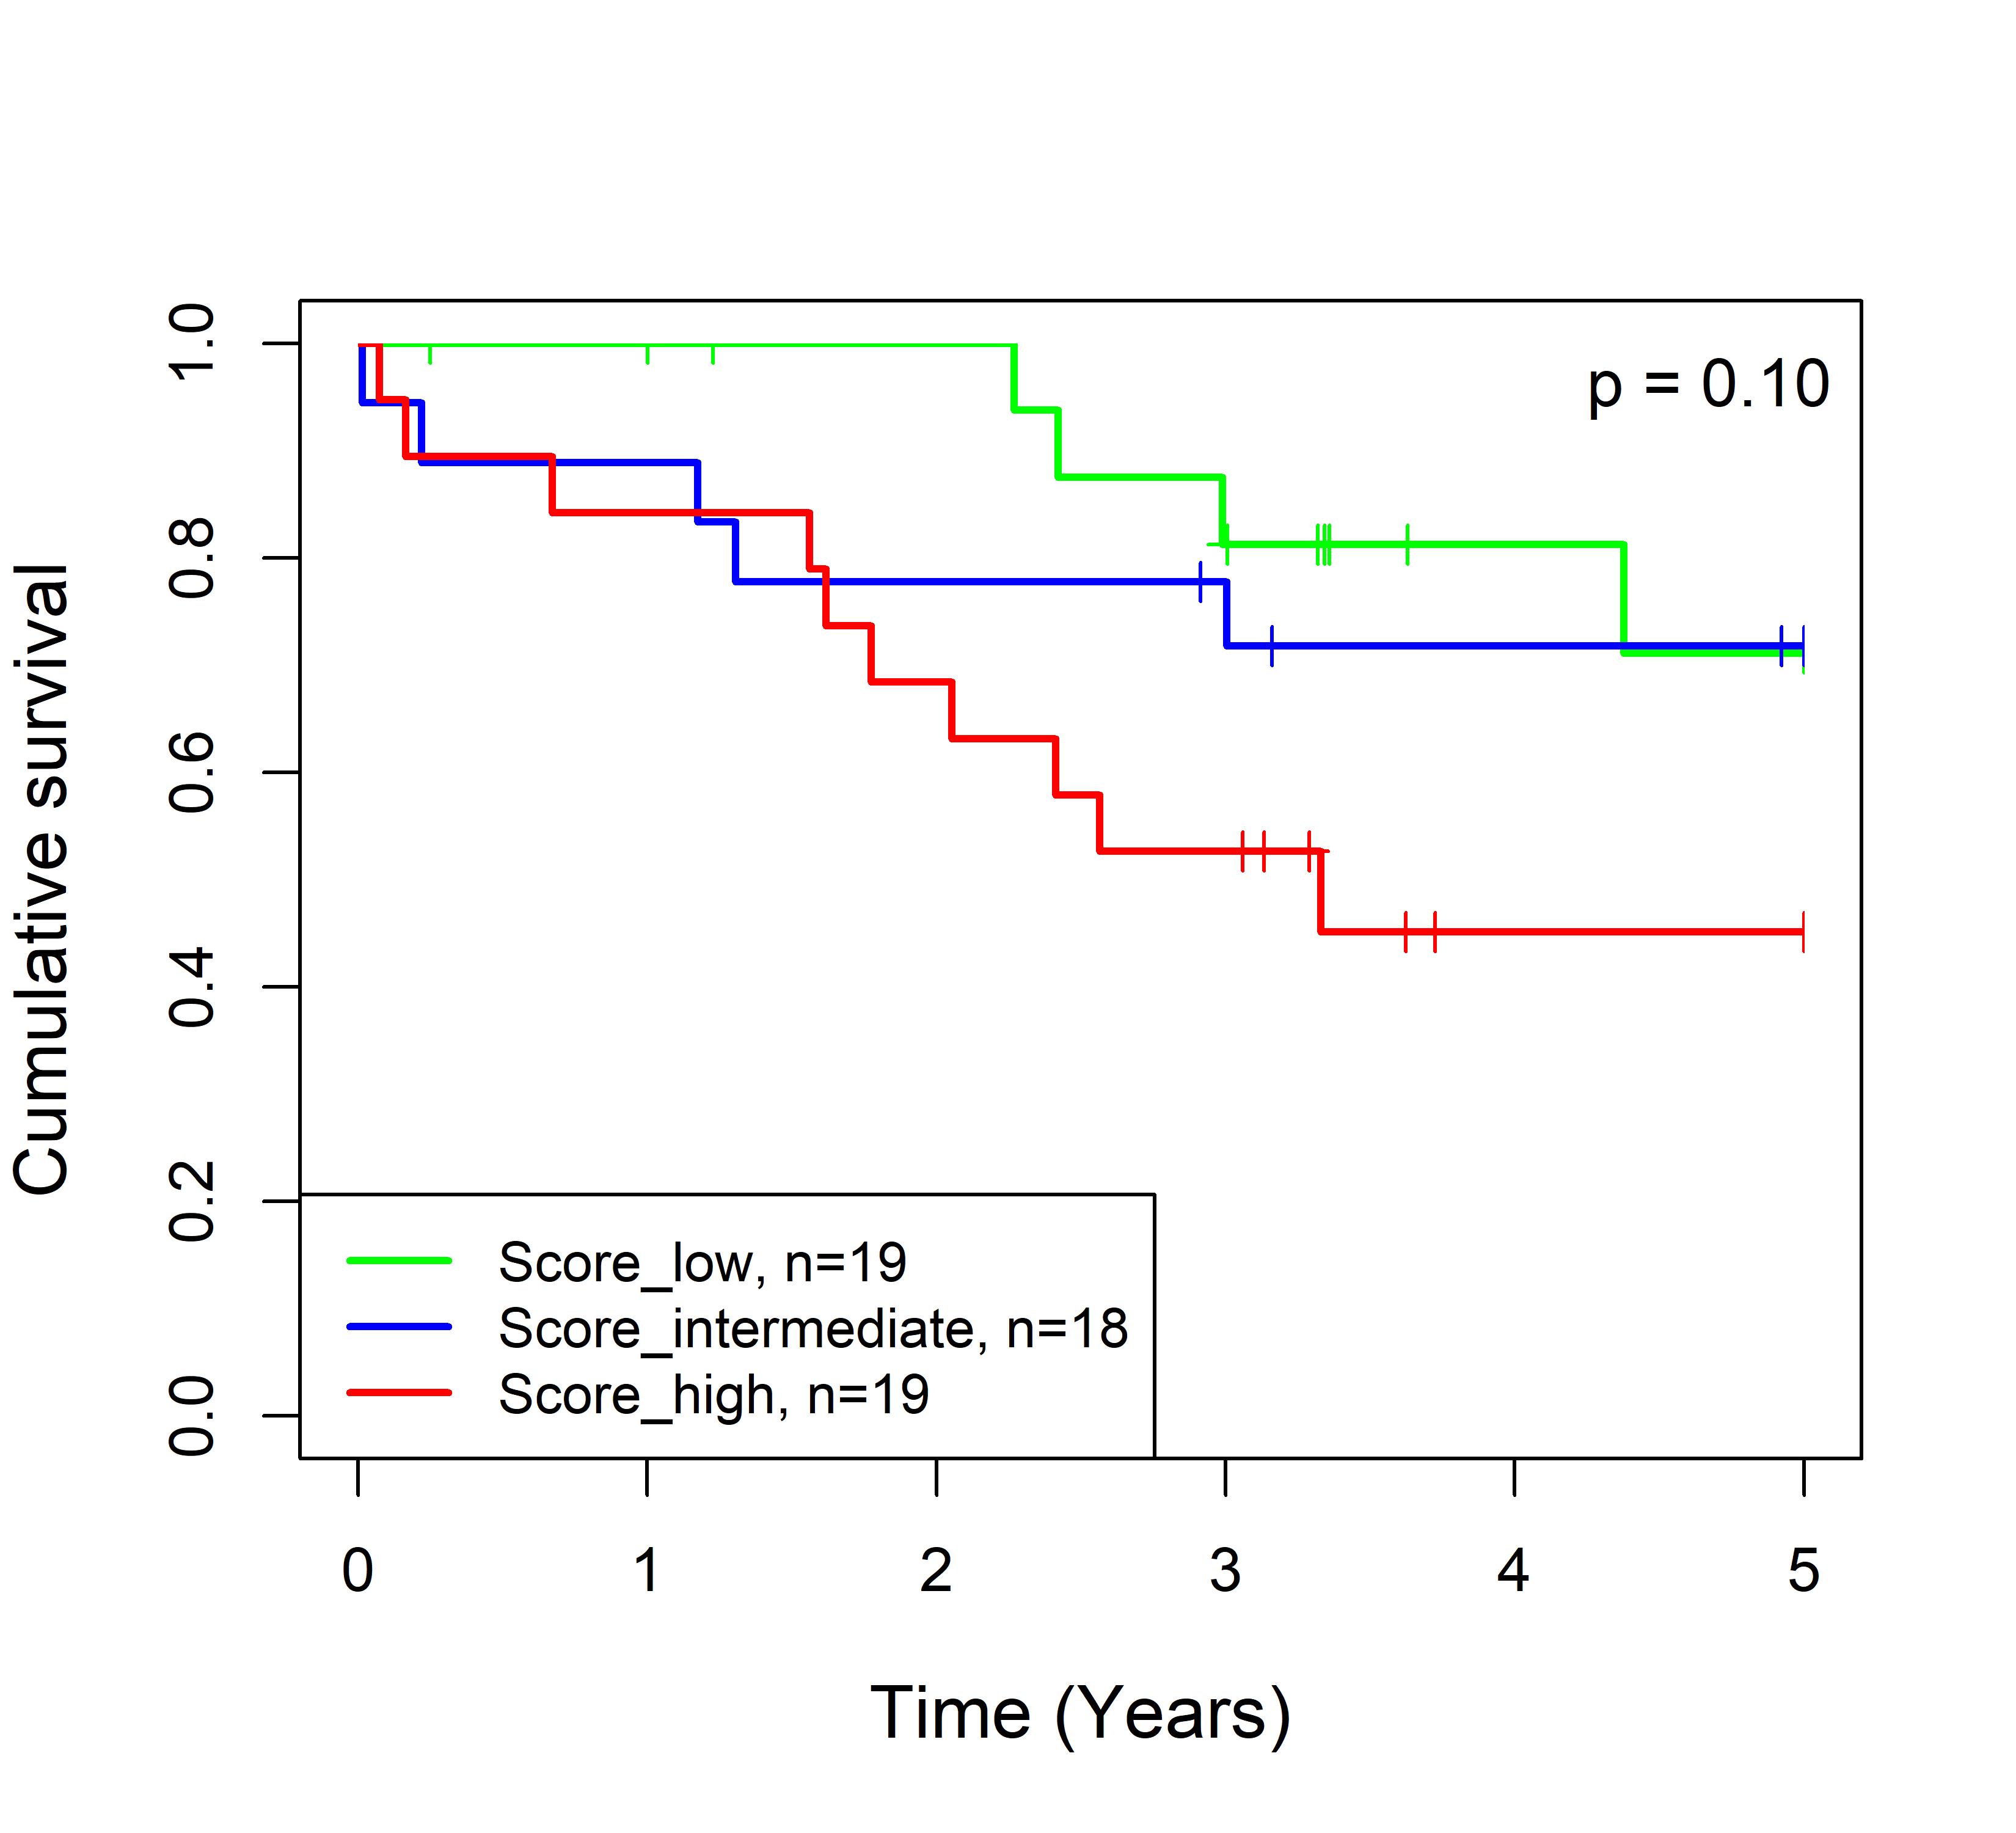
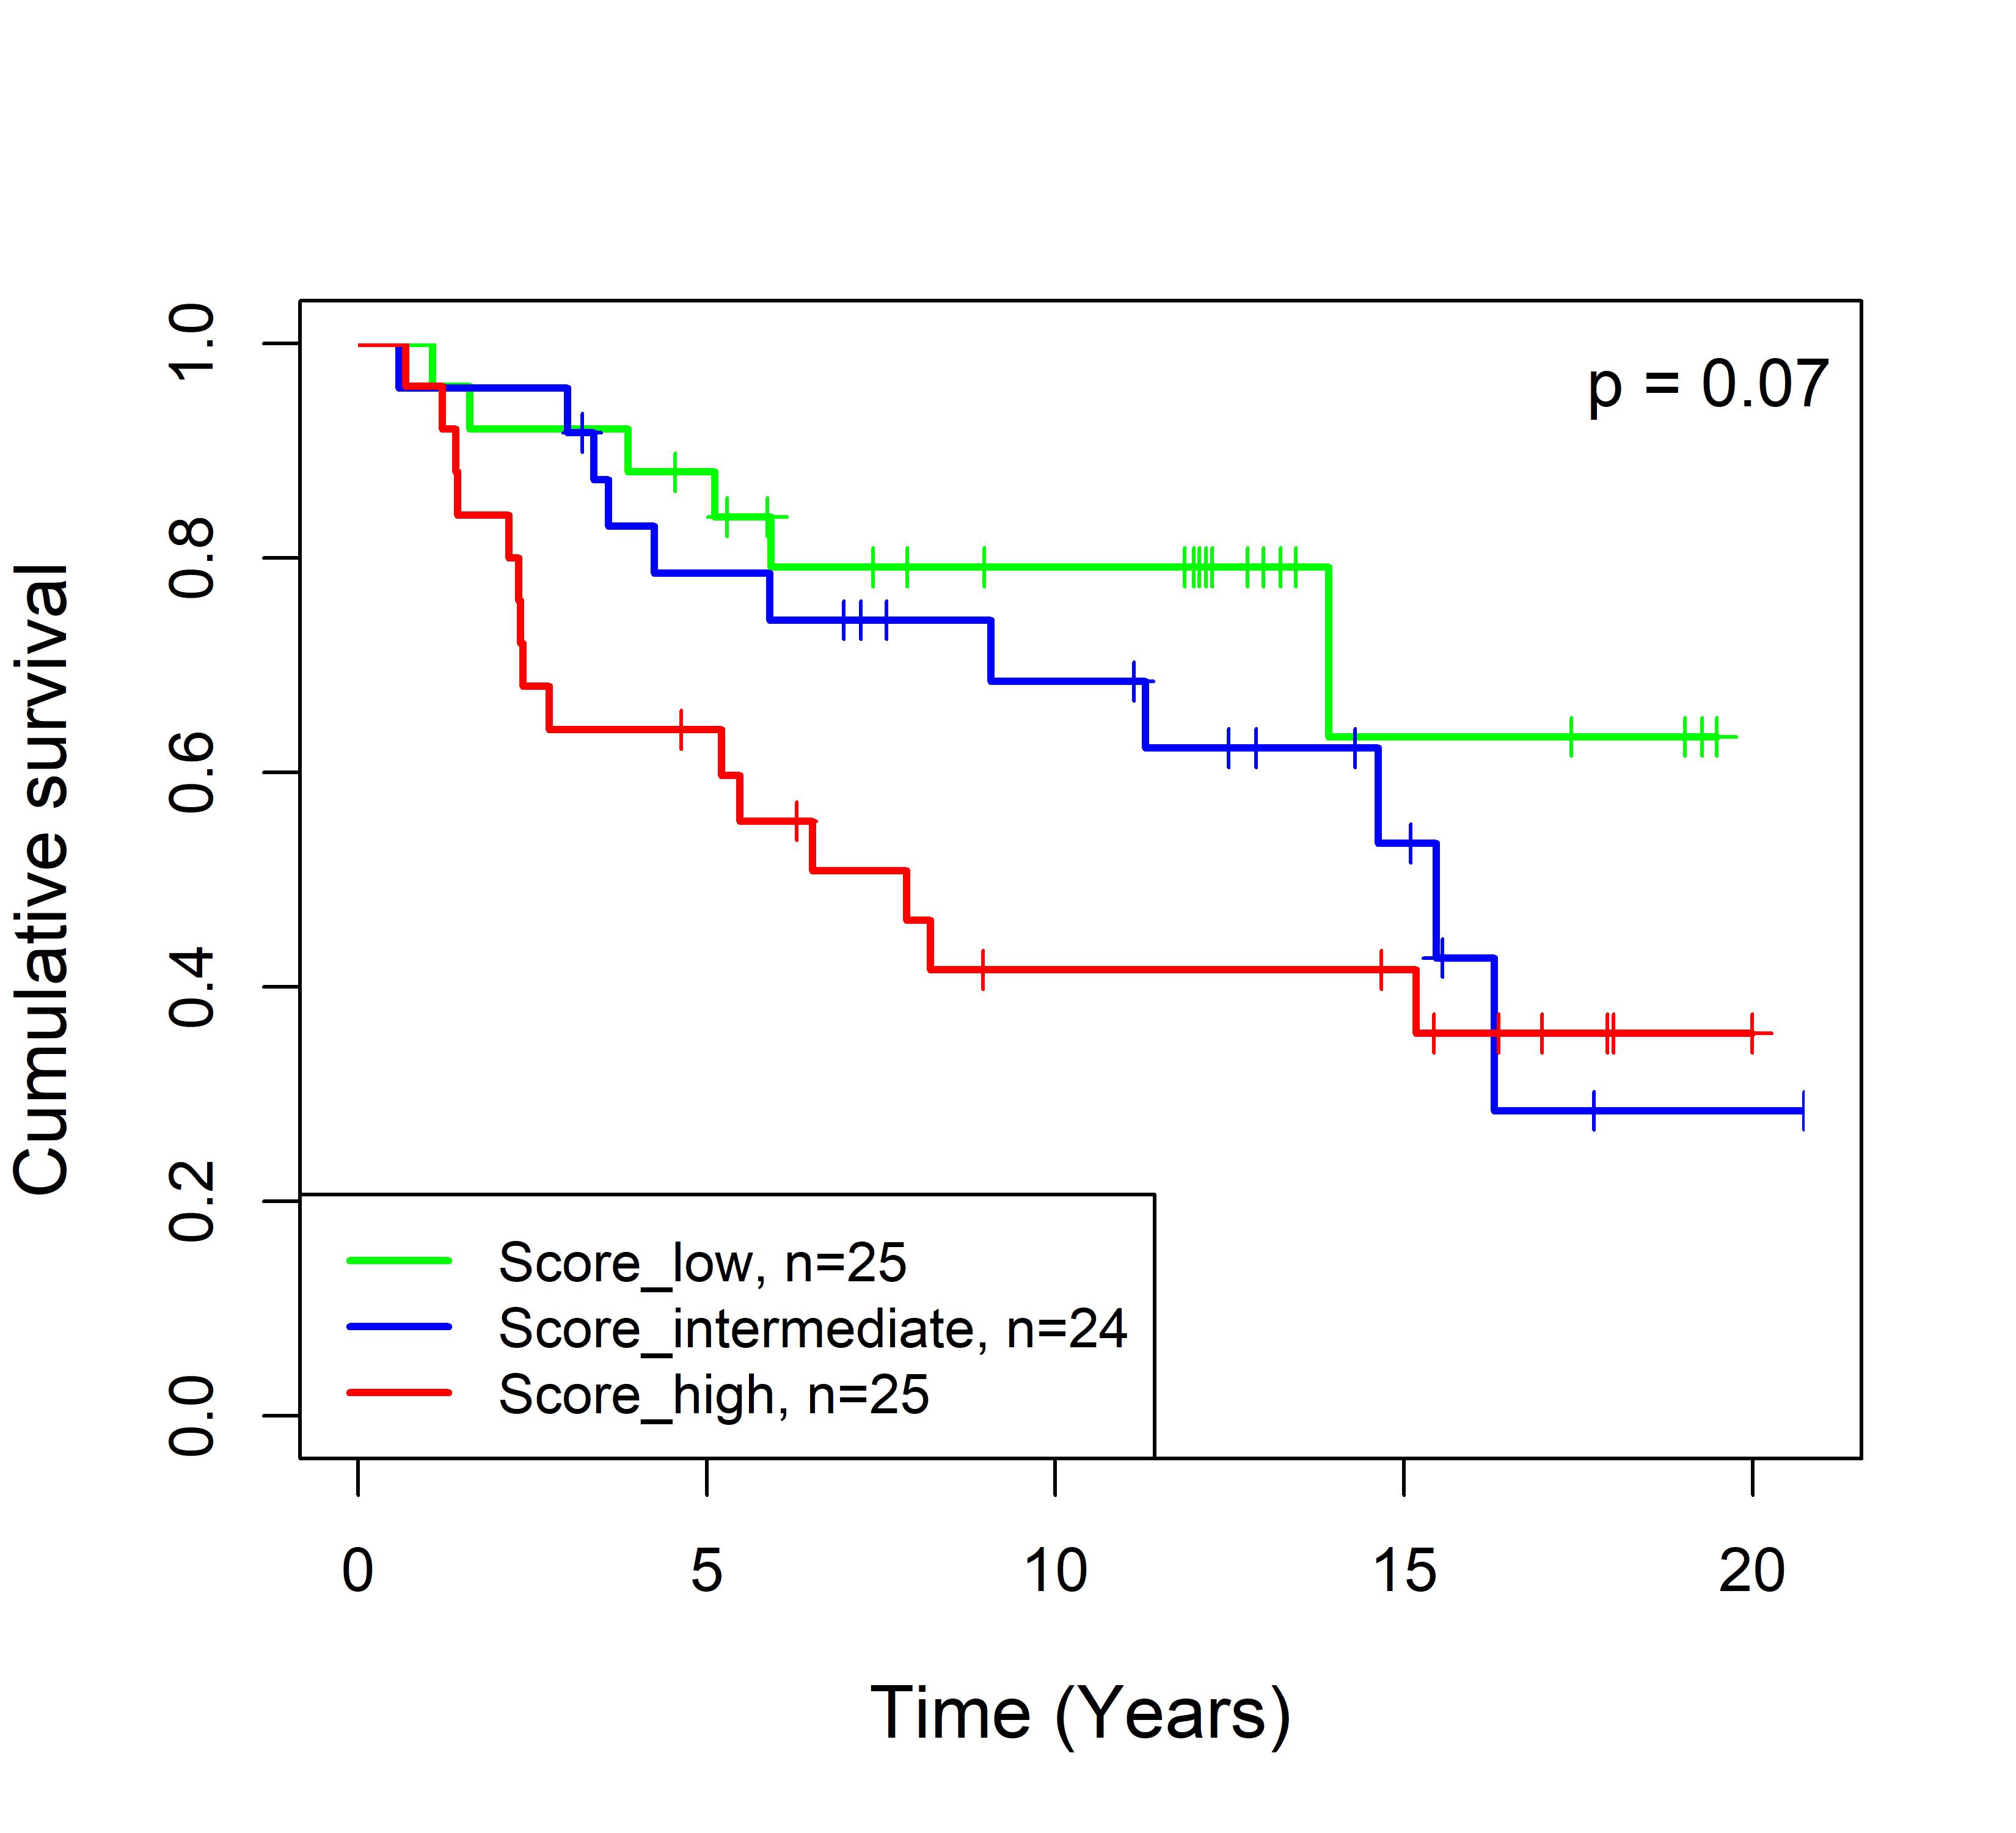
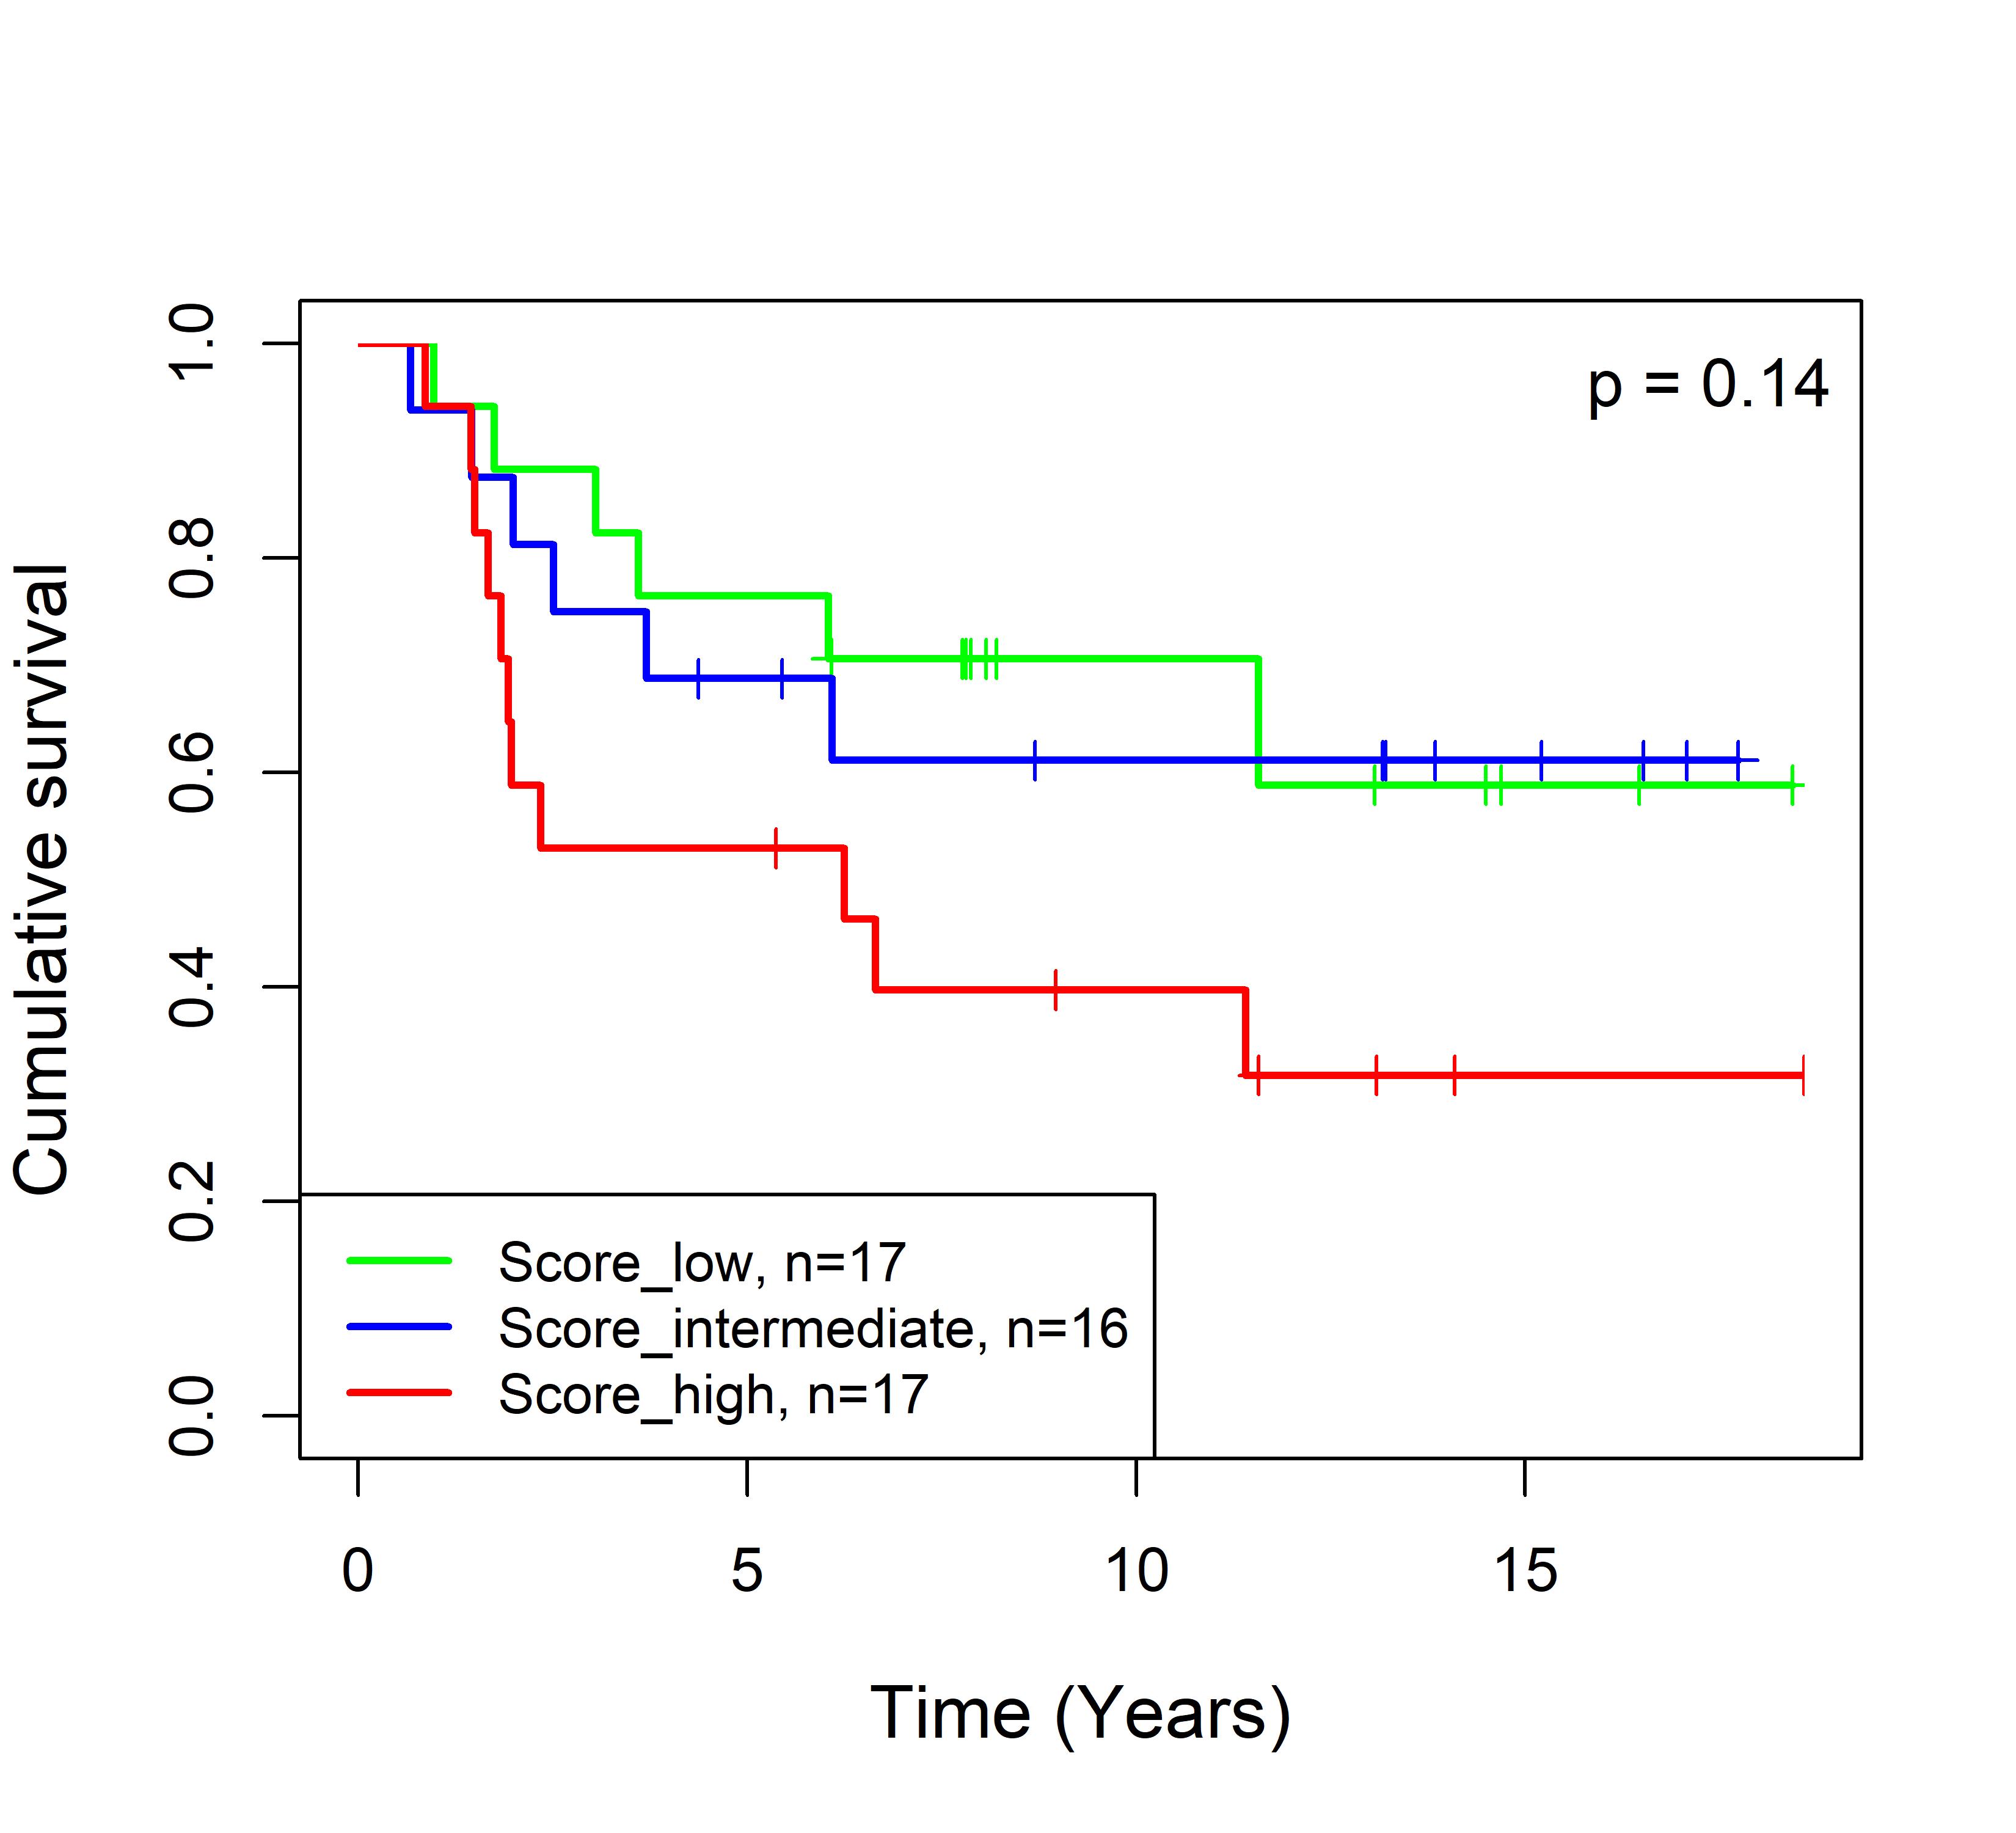
Fig. 3. Association between the Blue_TNBC signature score and patient survival in triple-negative/basal-like breast cancer across 27 non-TMO-based cohorts. Each Kaplan-Meier plot represents the analysis of a single, independent cohort, except for the first plot, which combines datasets assembled by Rody et al. (PMID: 21978456) . Since direct comparison of signature scores across these non-TMO-based gene expression profiles is currently not feasible, samples within each cohort were stratified using tertile splits of the signature score (i.e. high: > 2/3 percentile; low ≤ 1/3 percentile; medium: ≤ 2/3 percentile and >1/3 percentile).