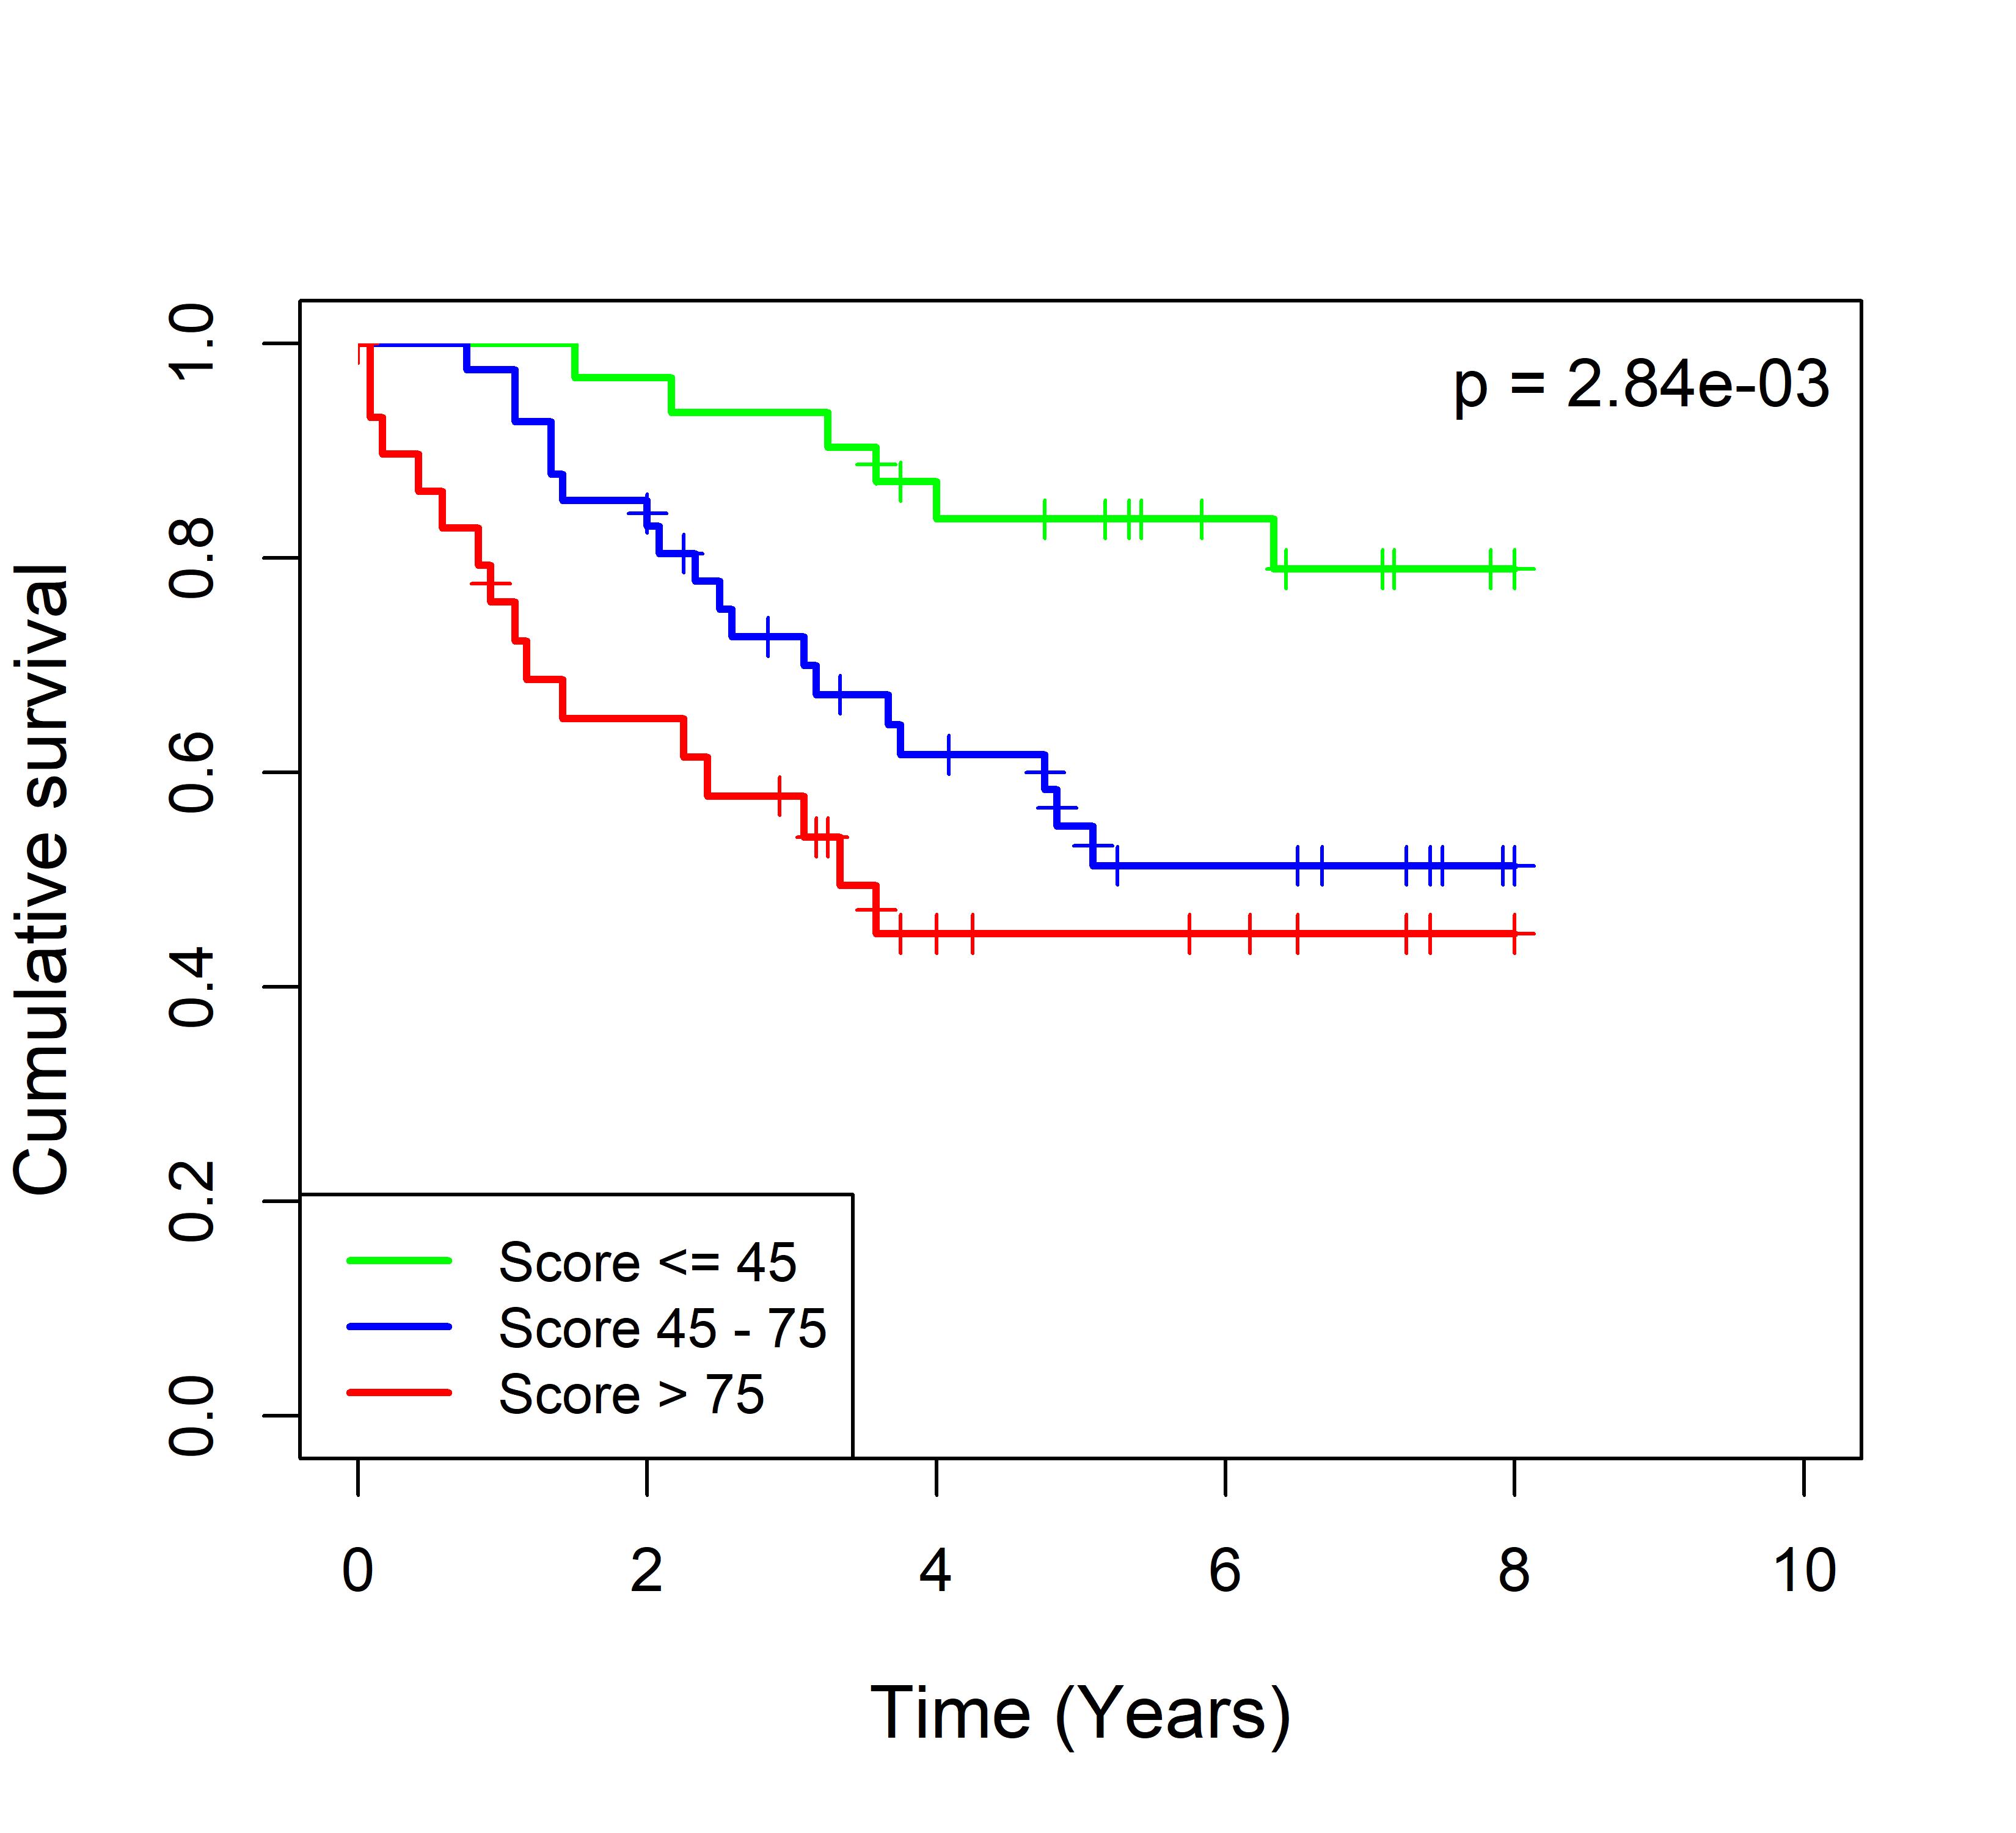
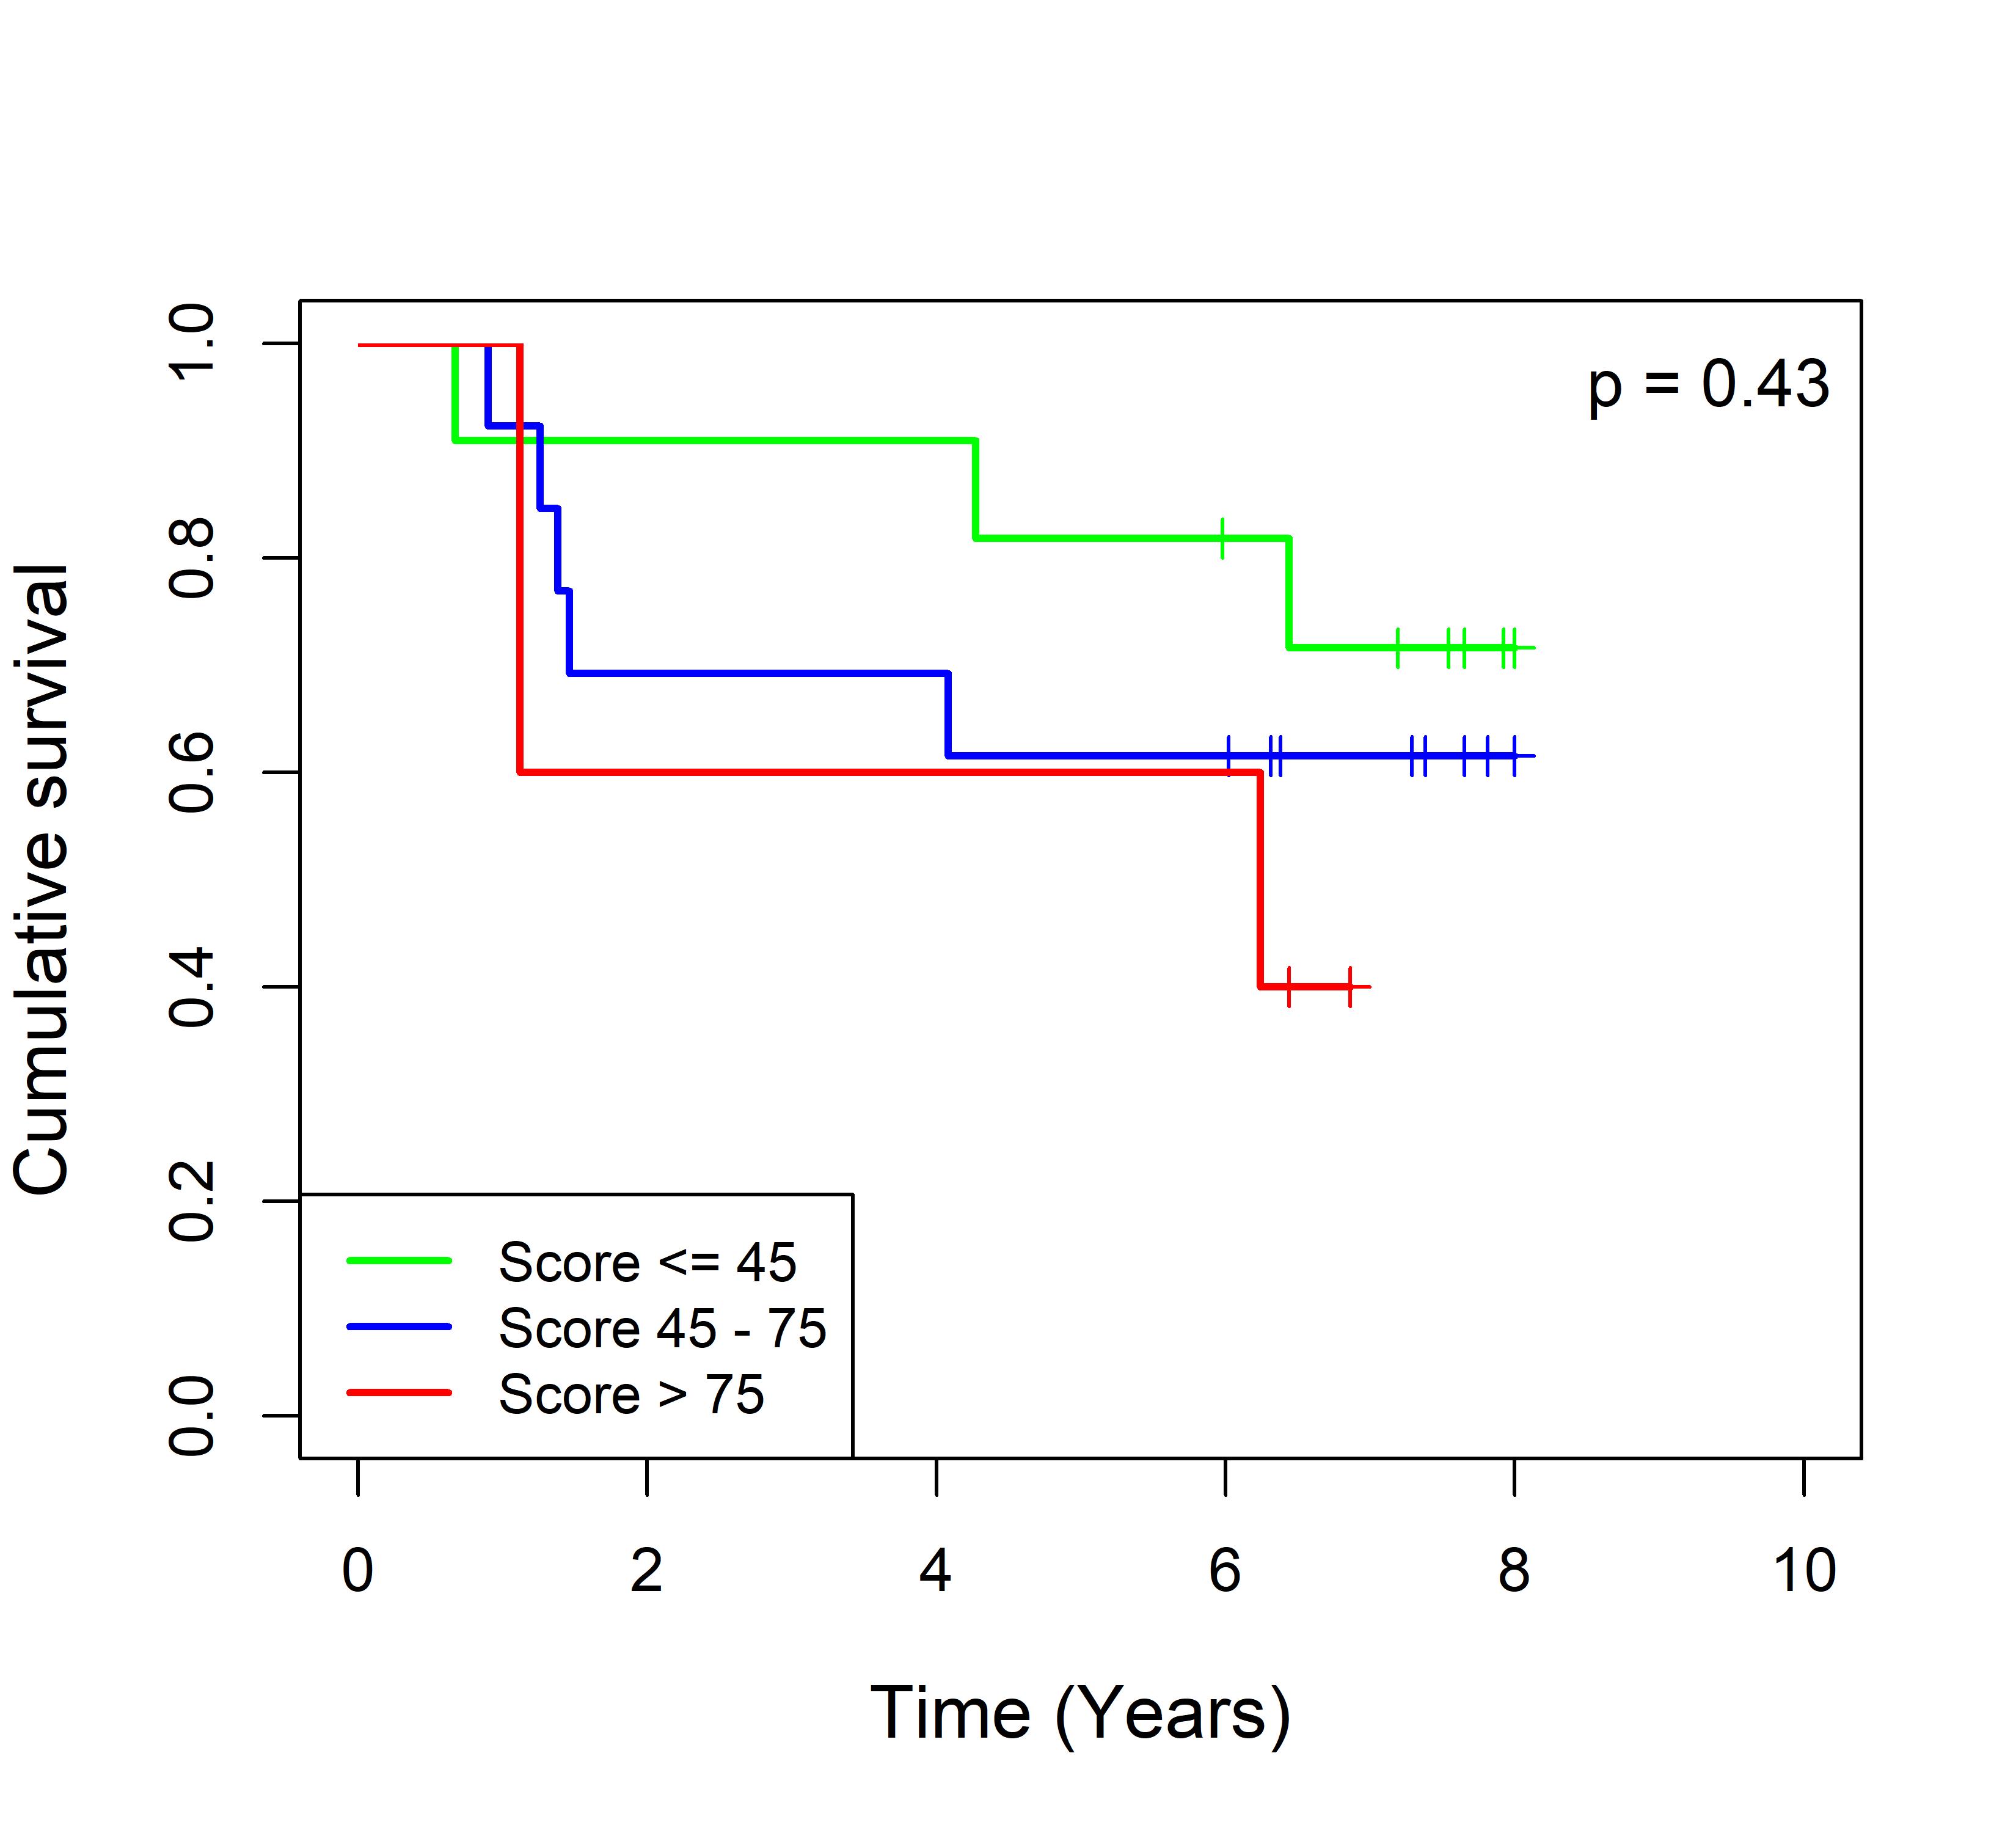
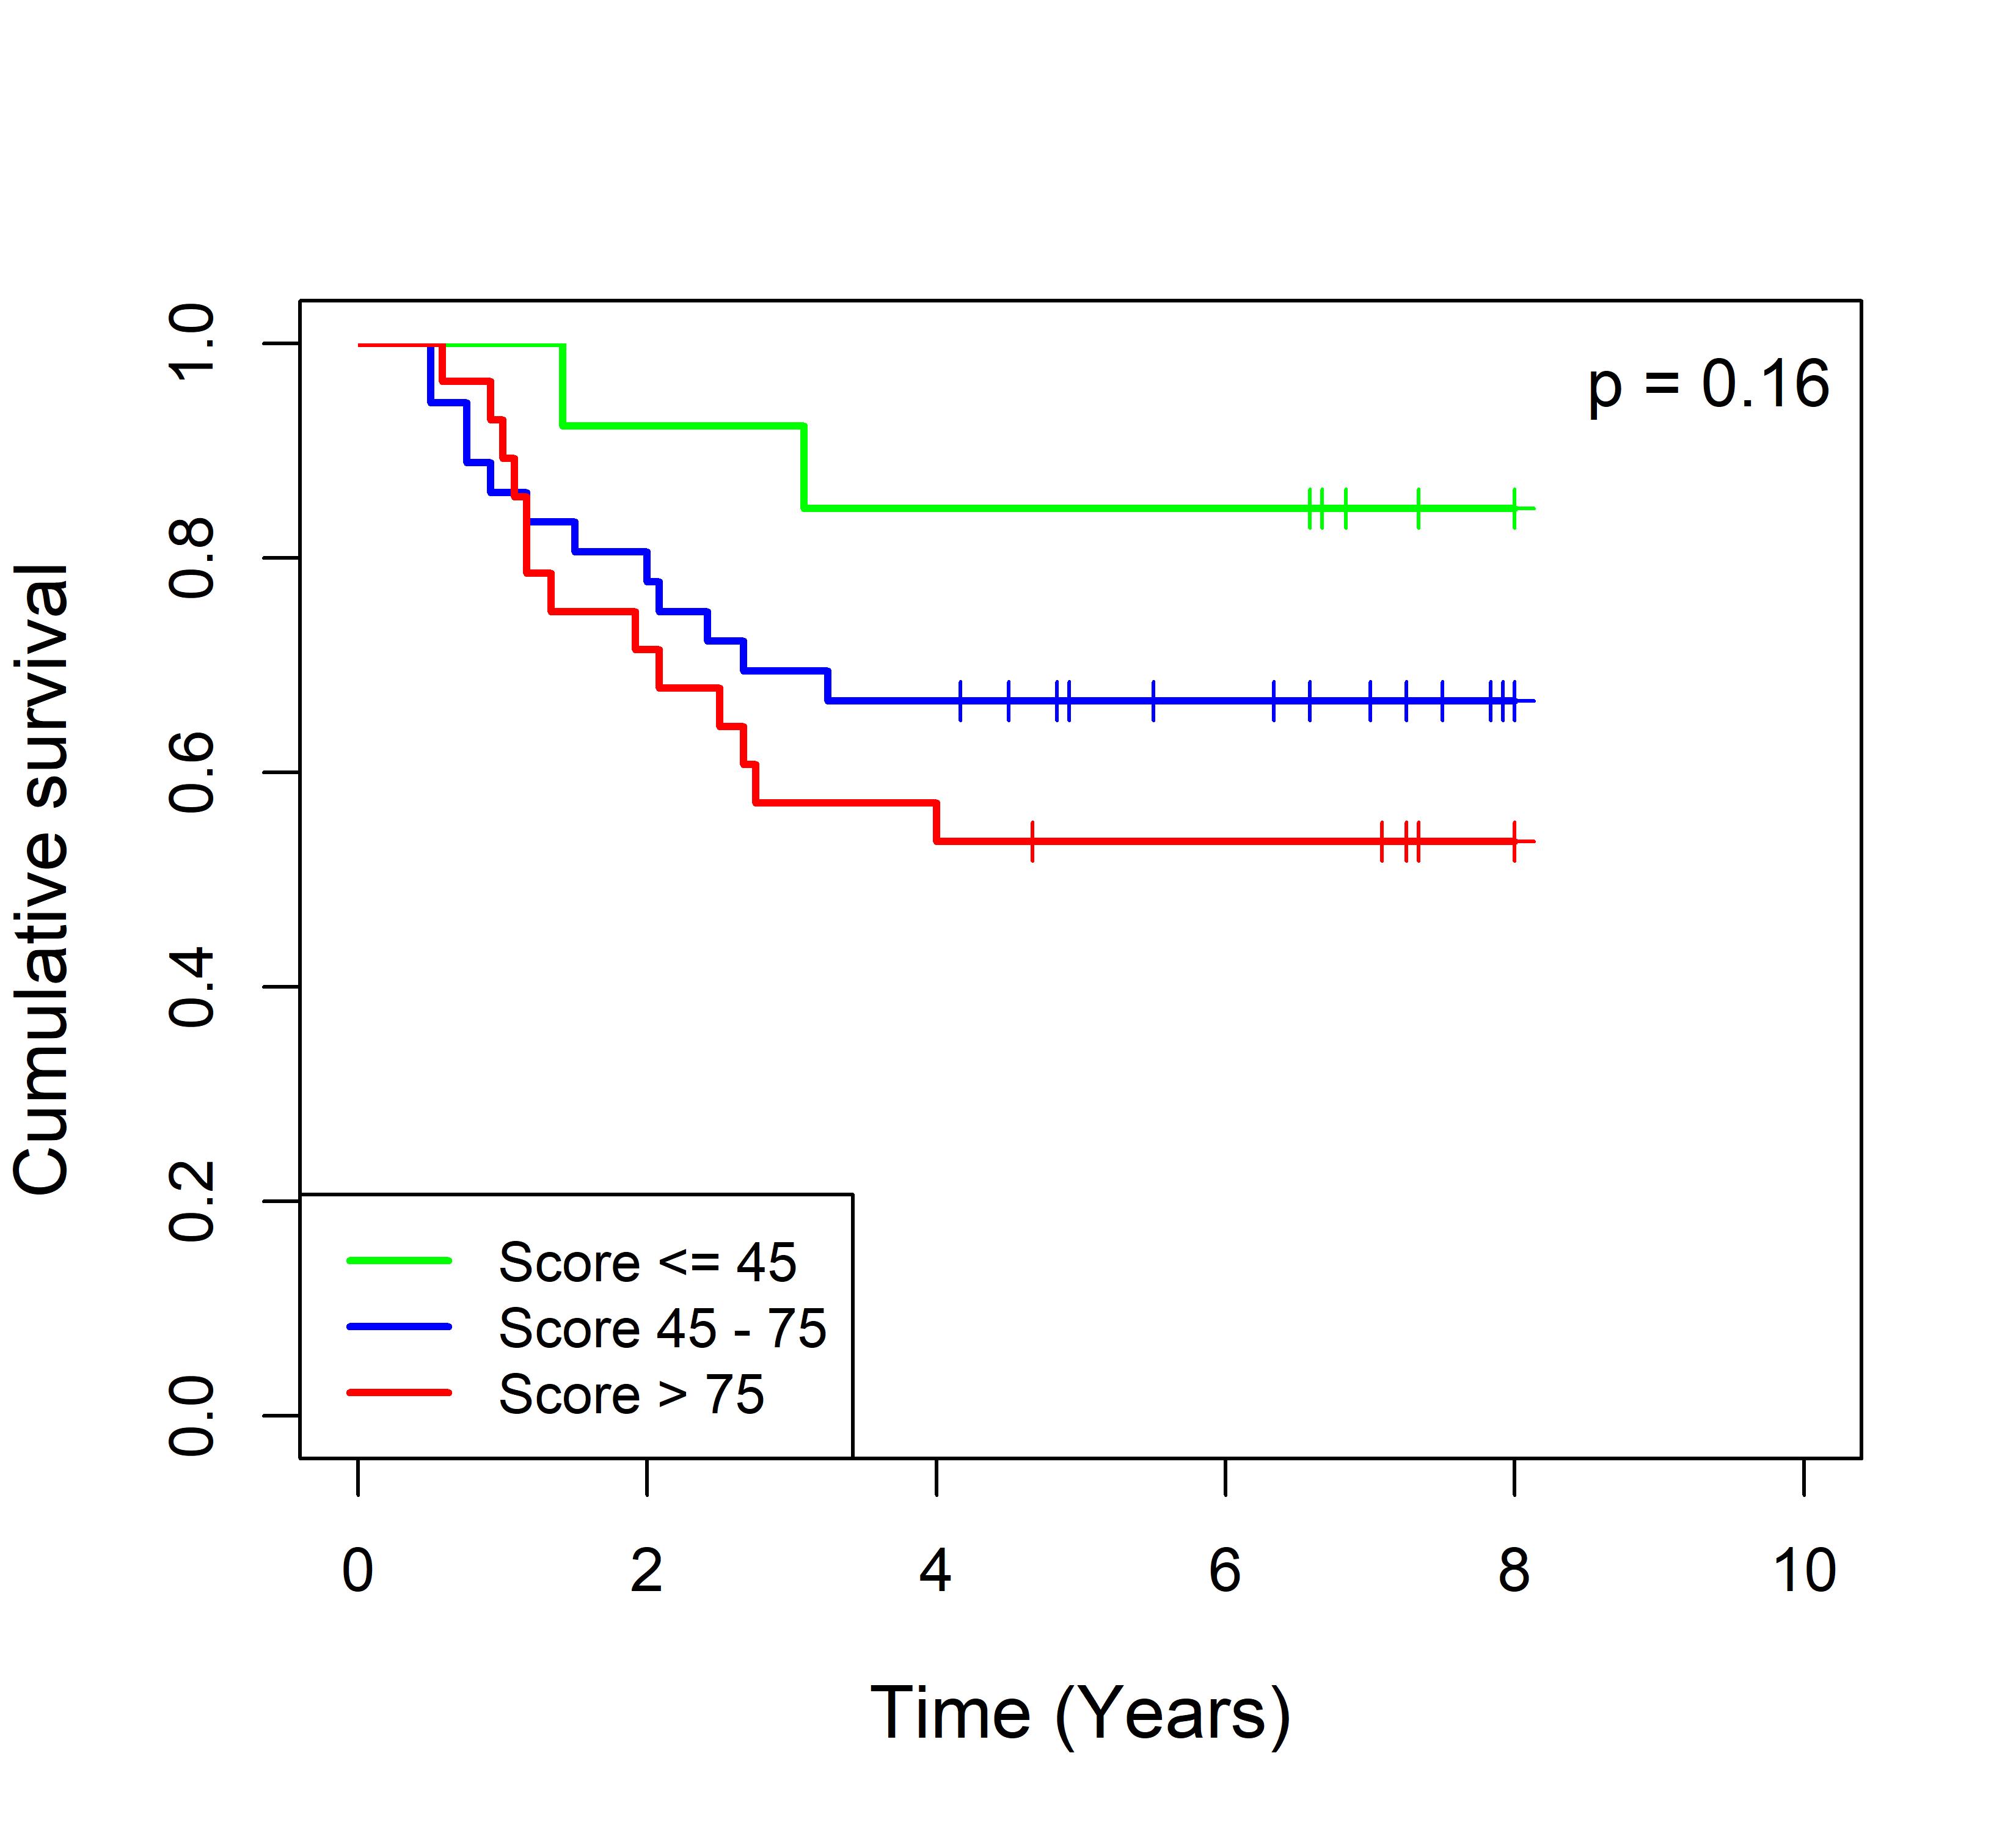
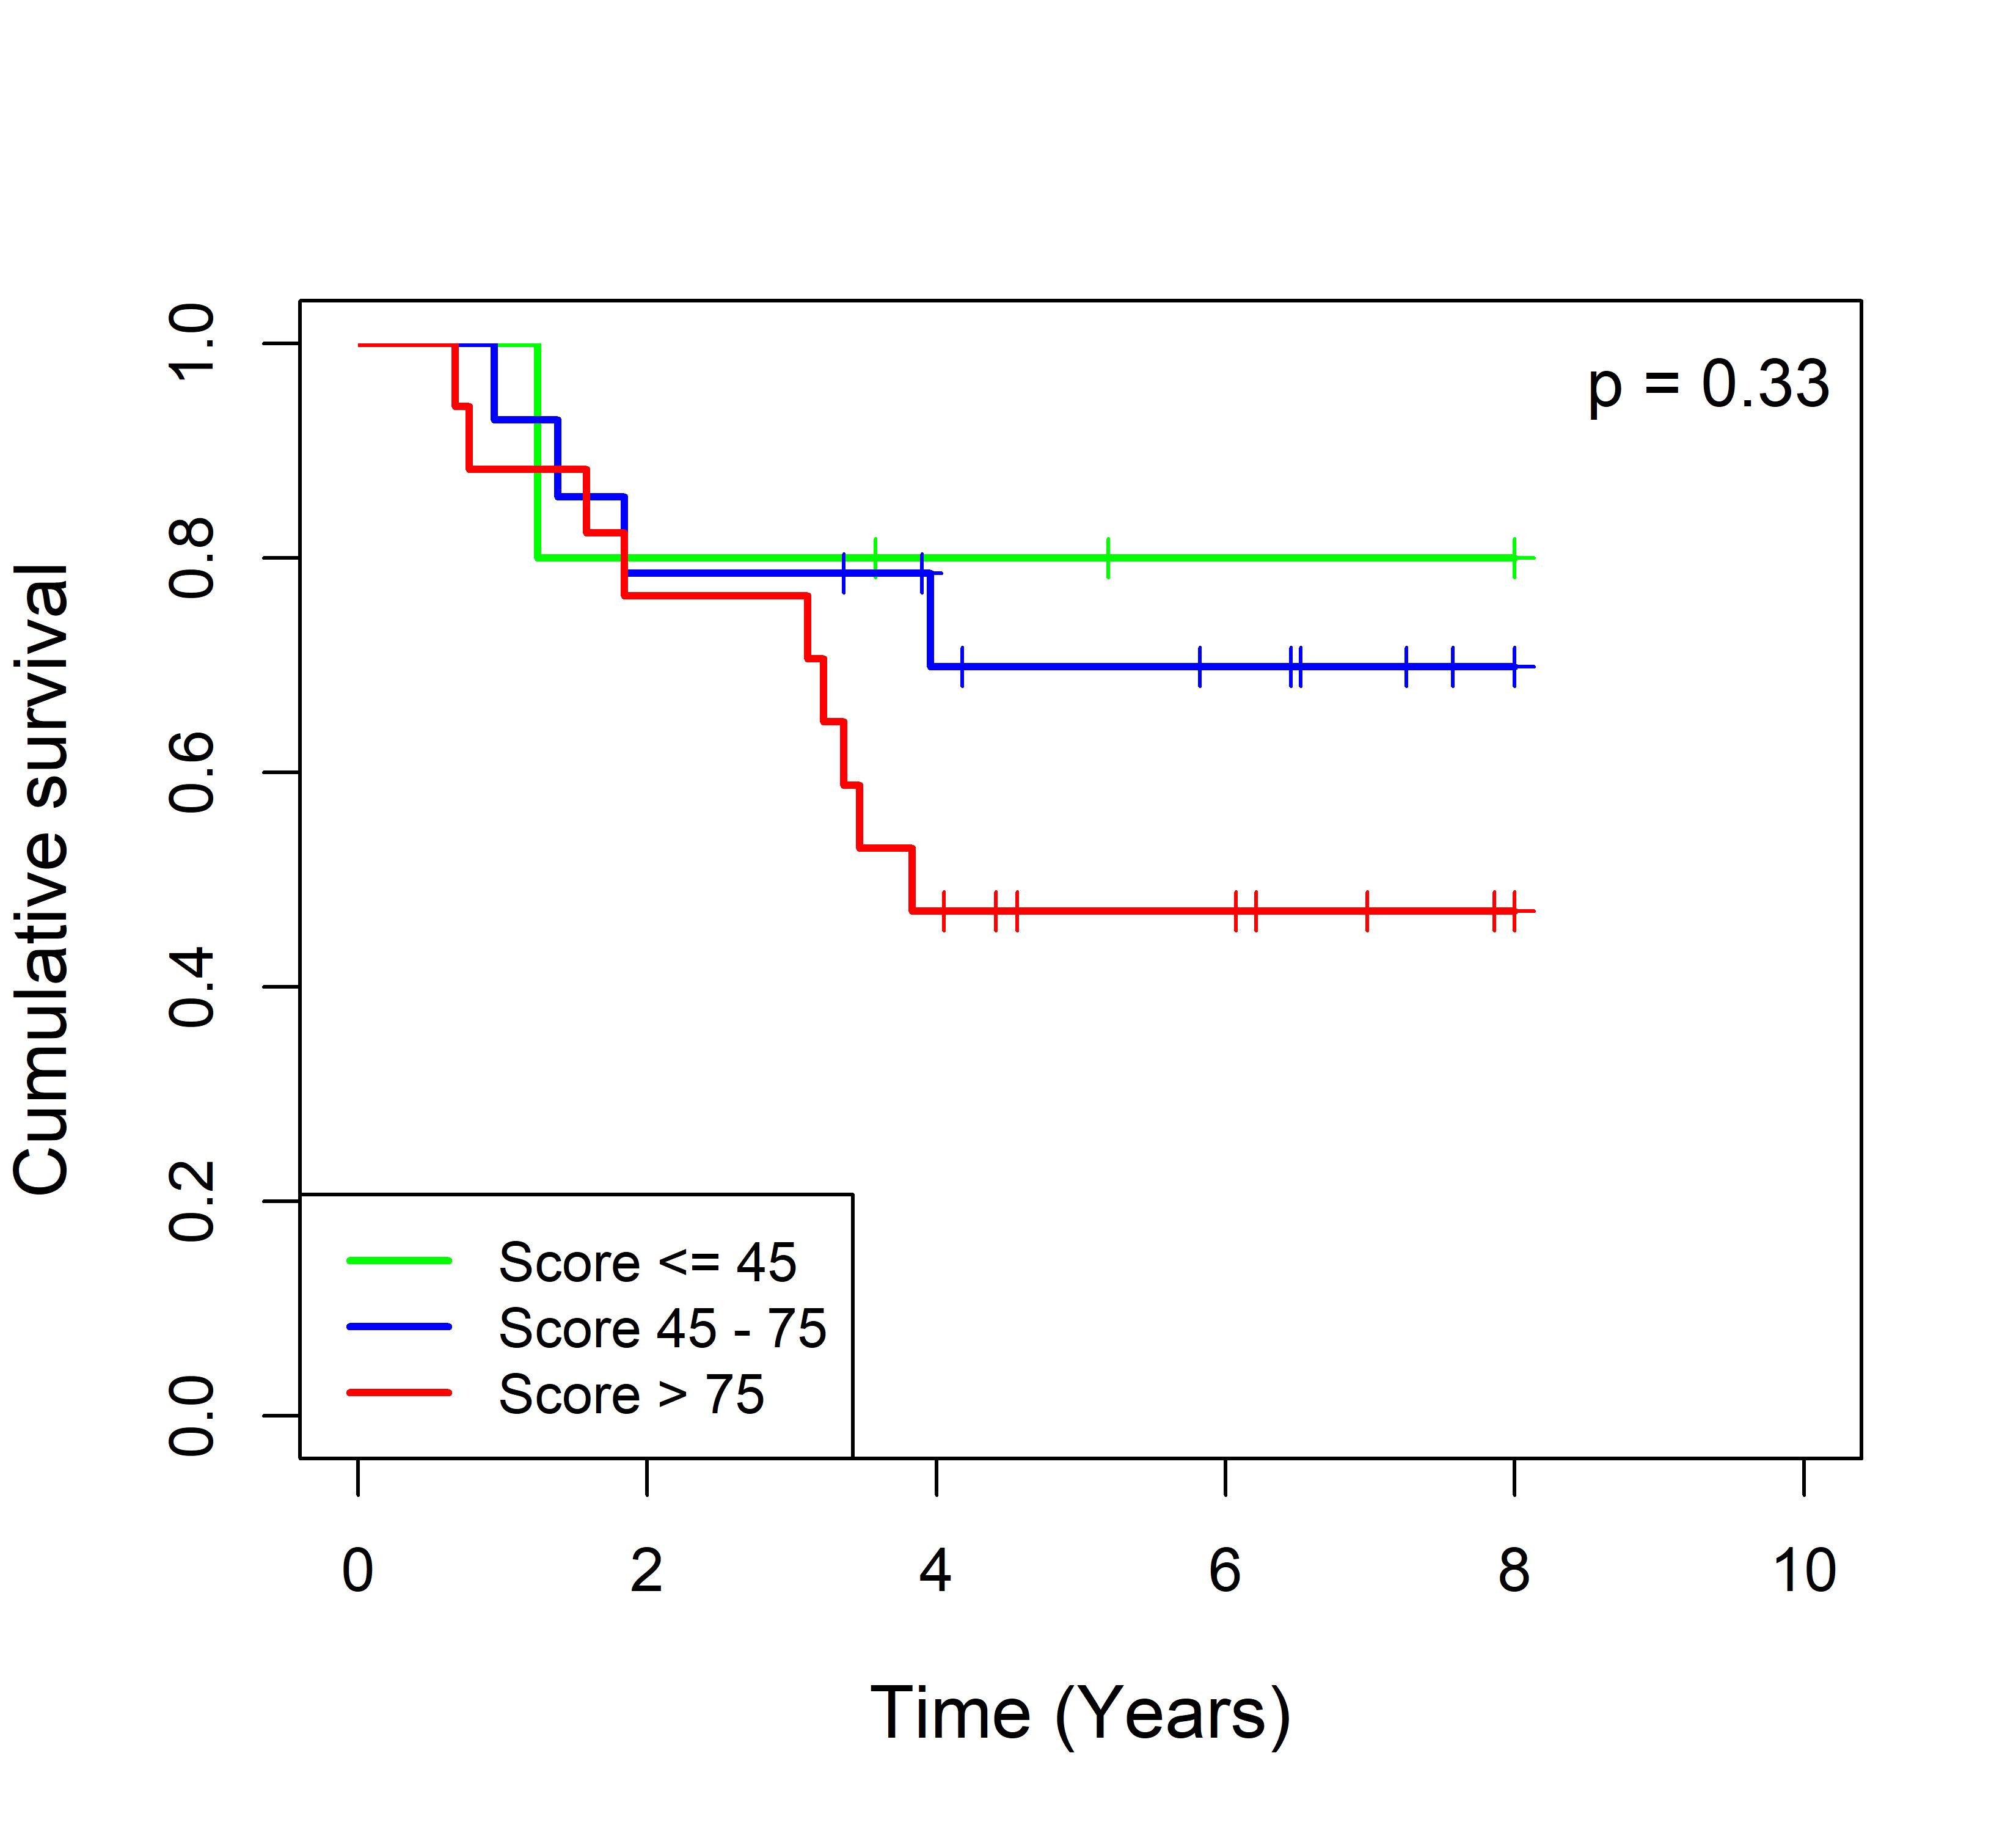
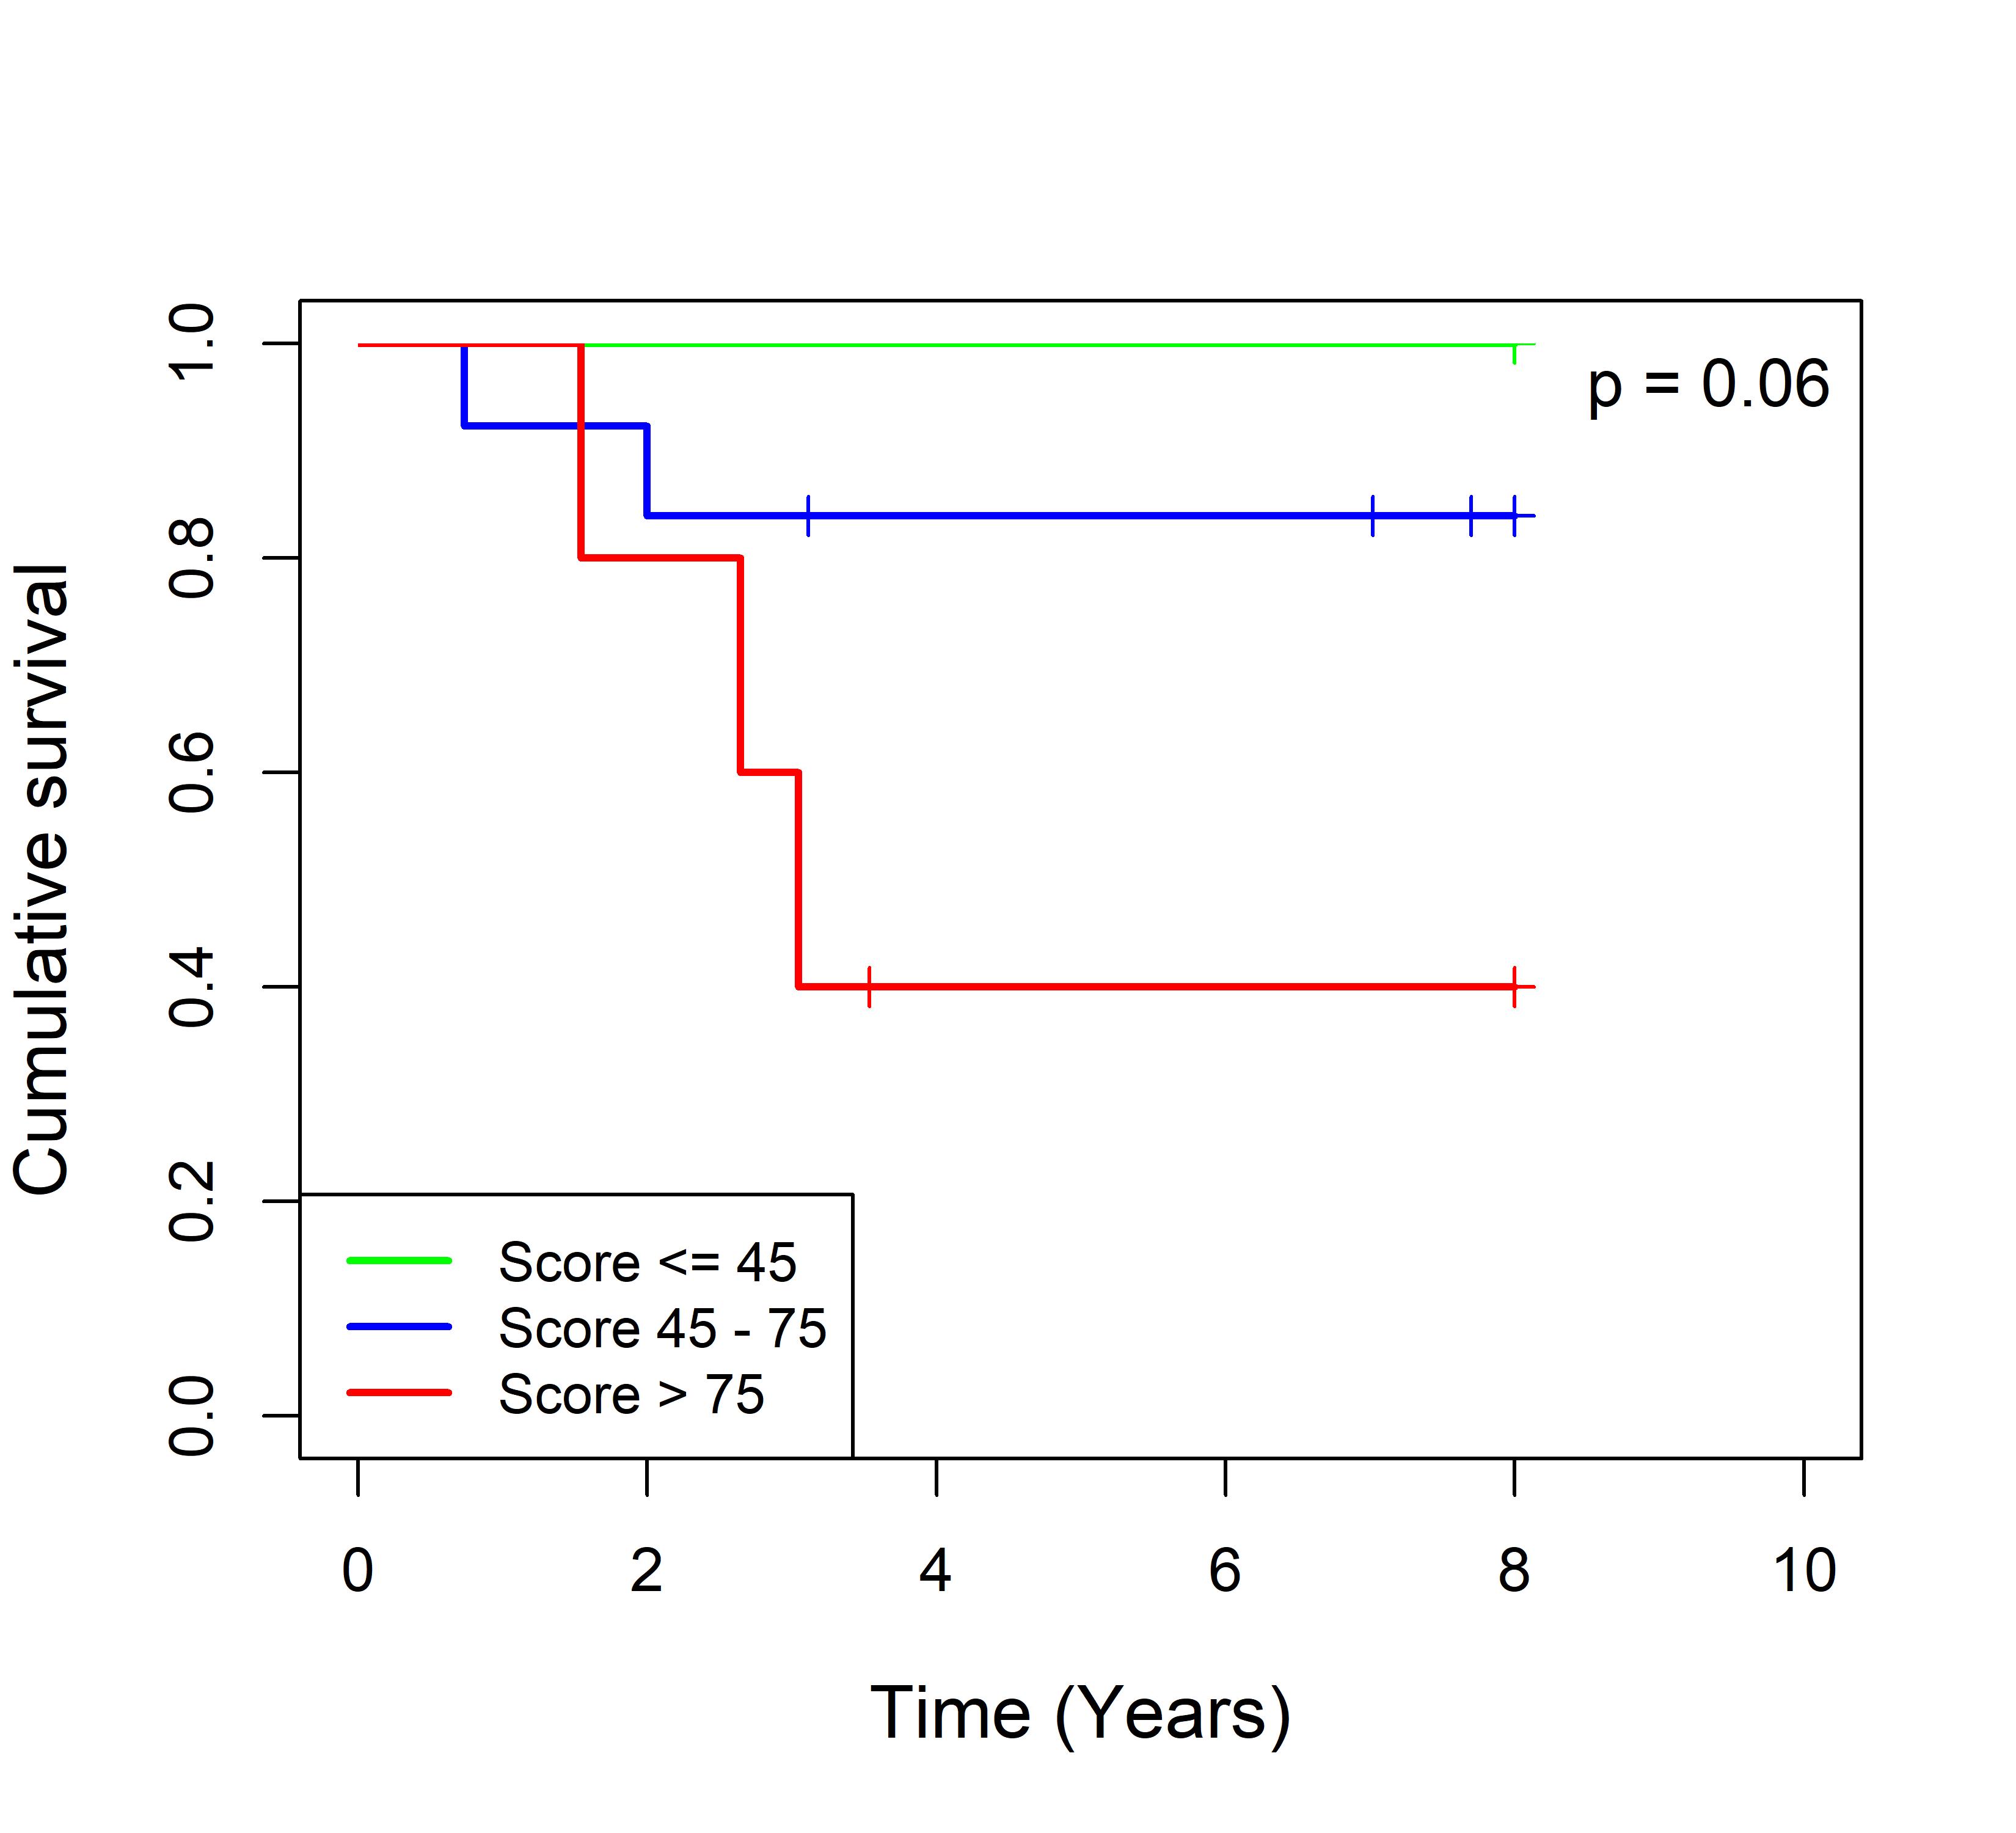
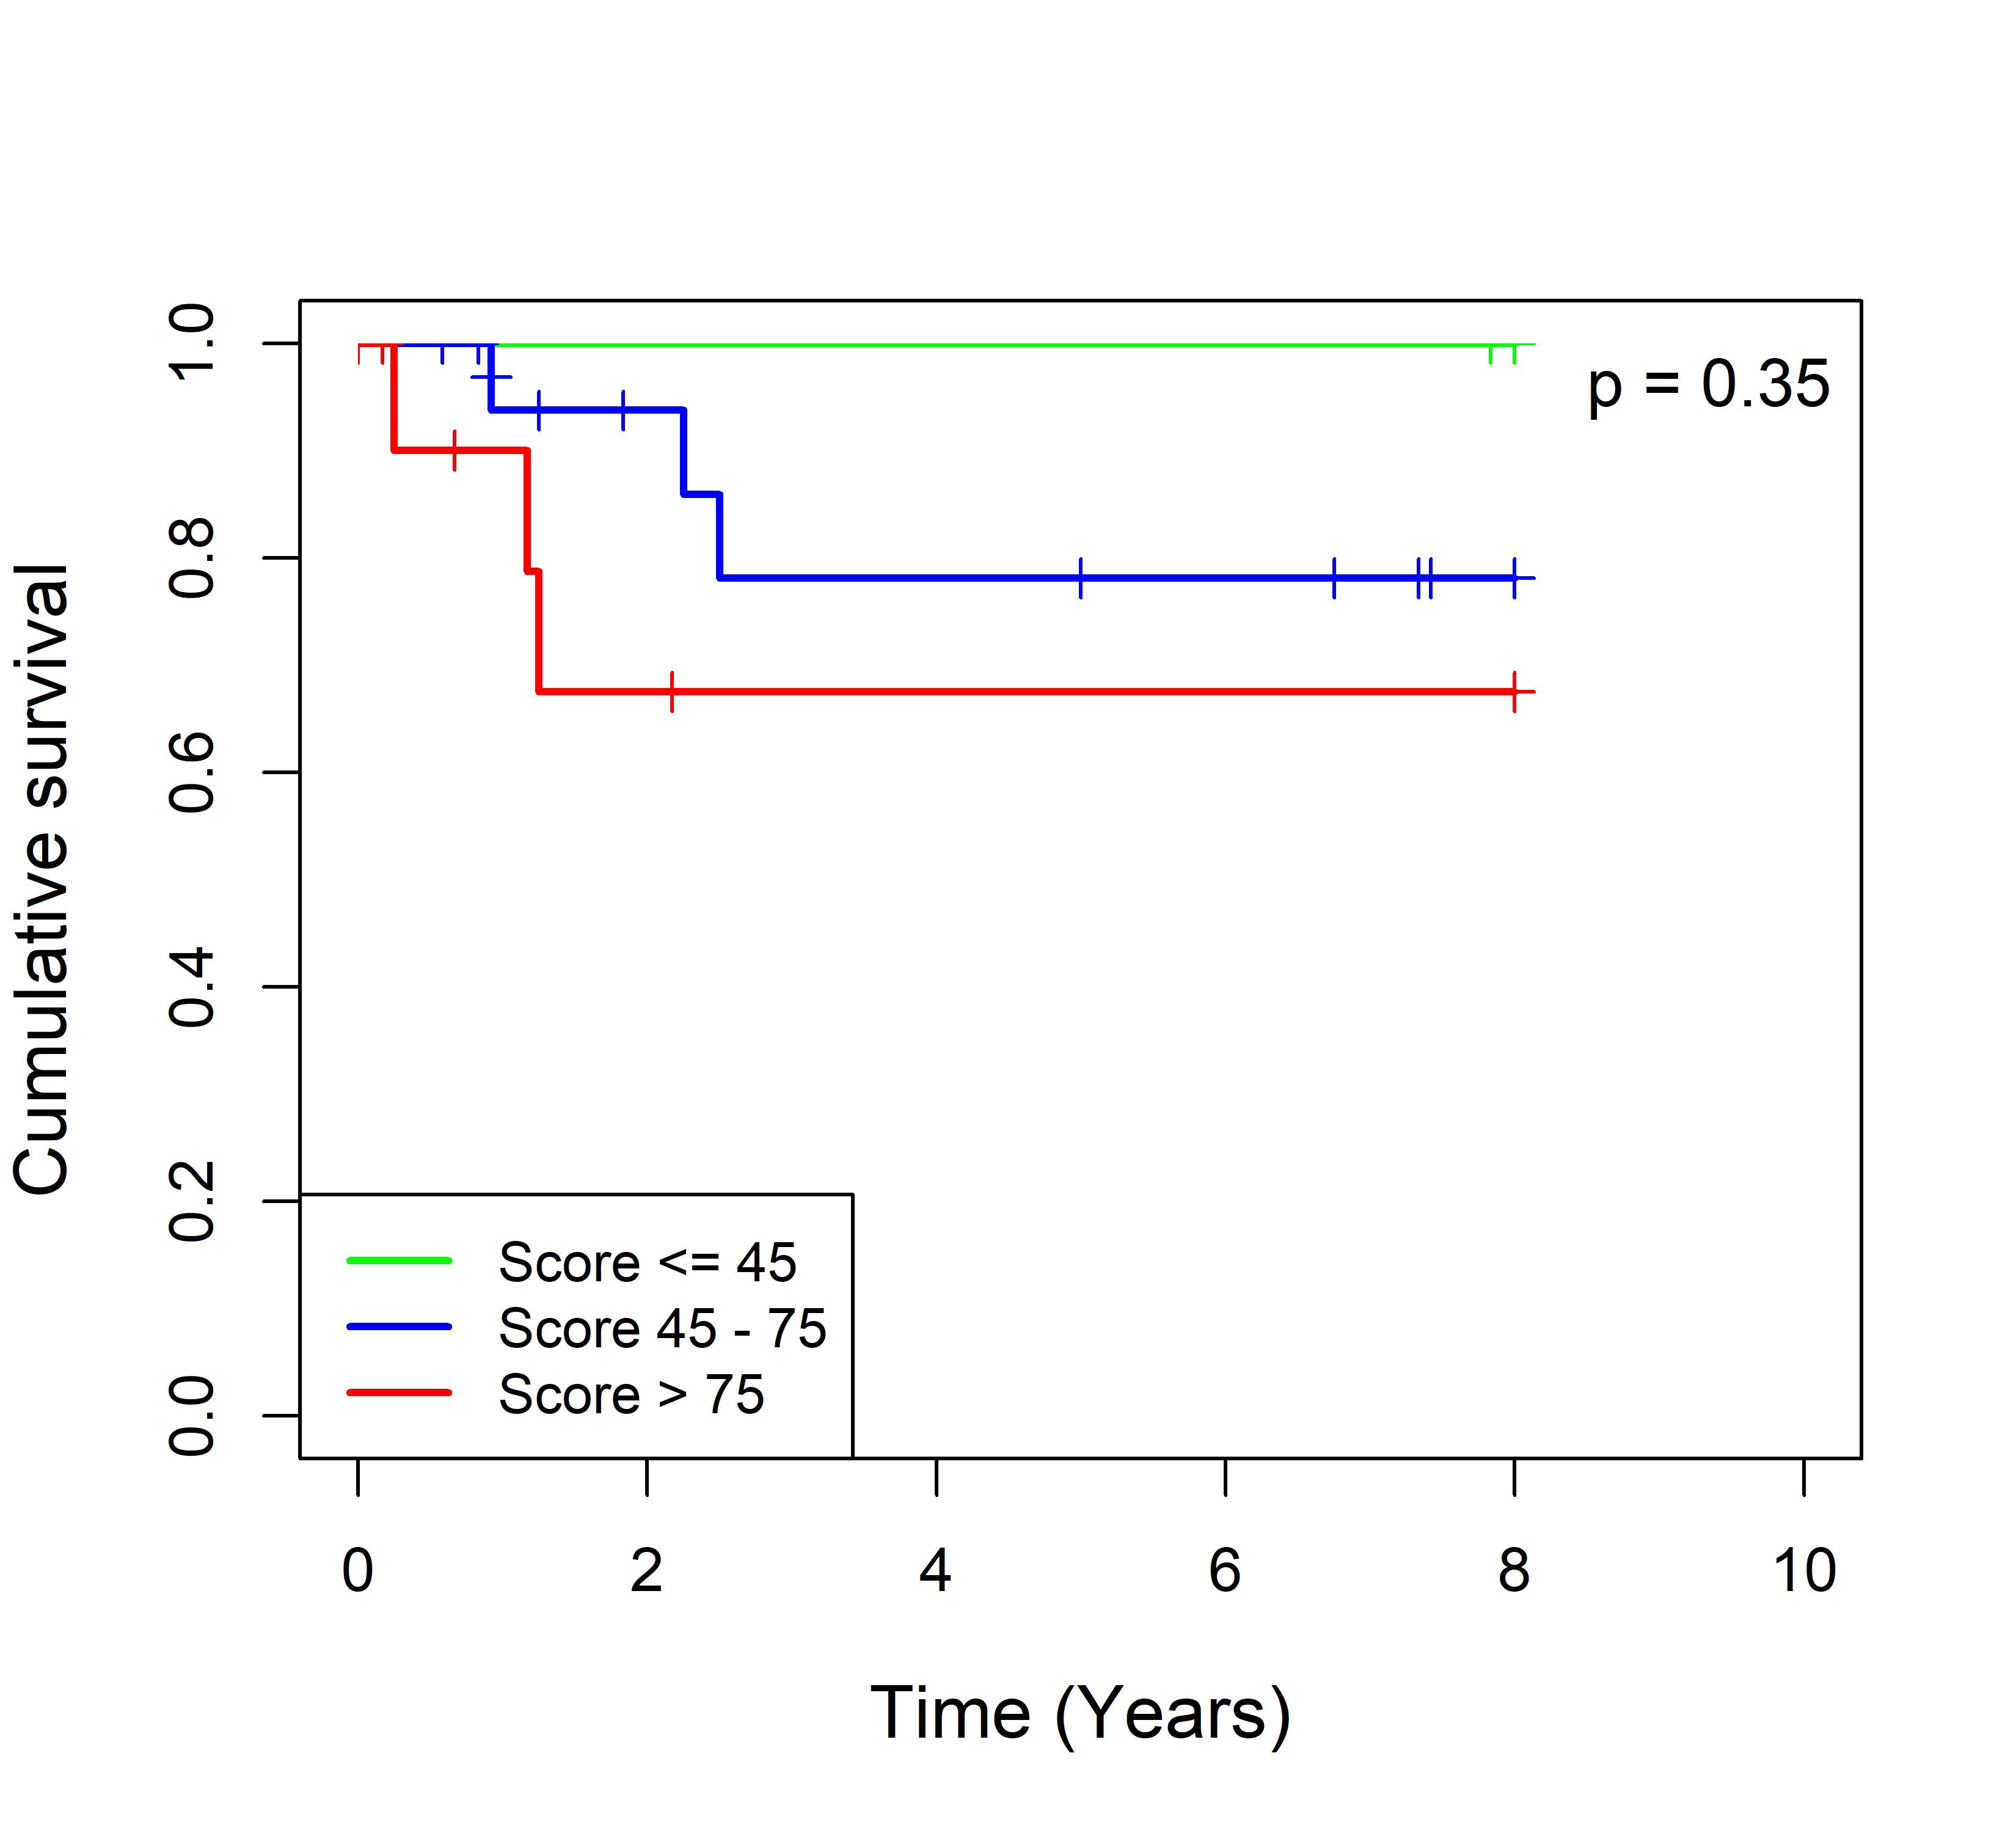
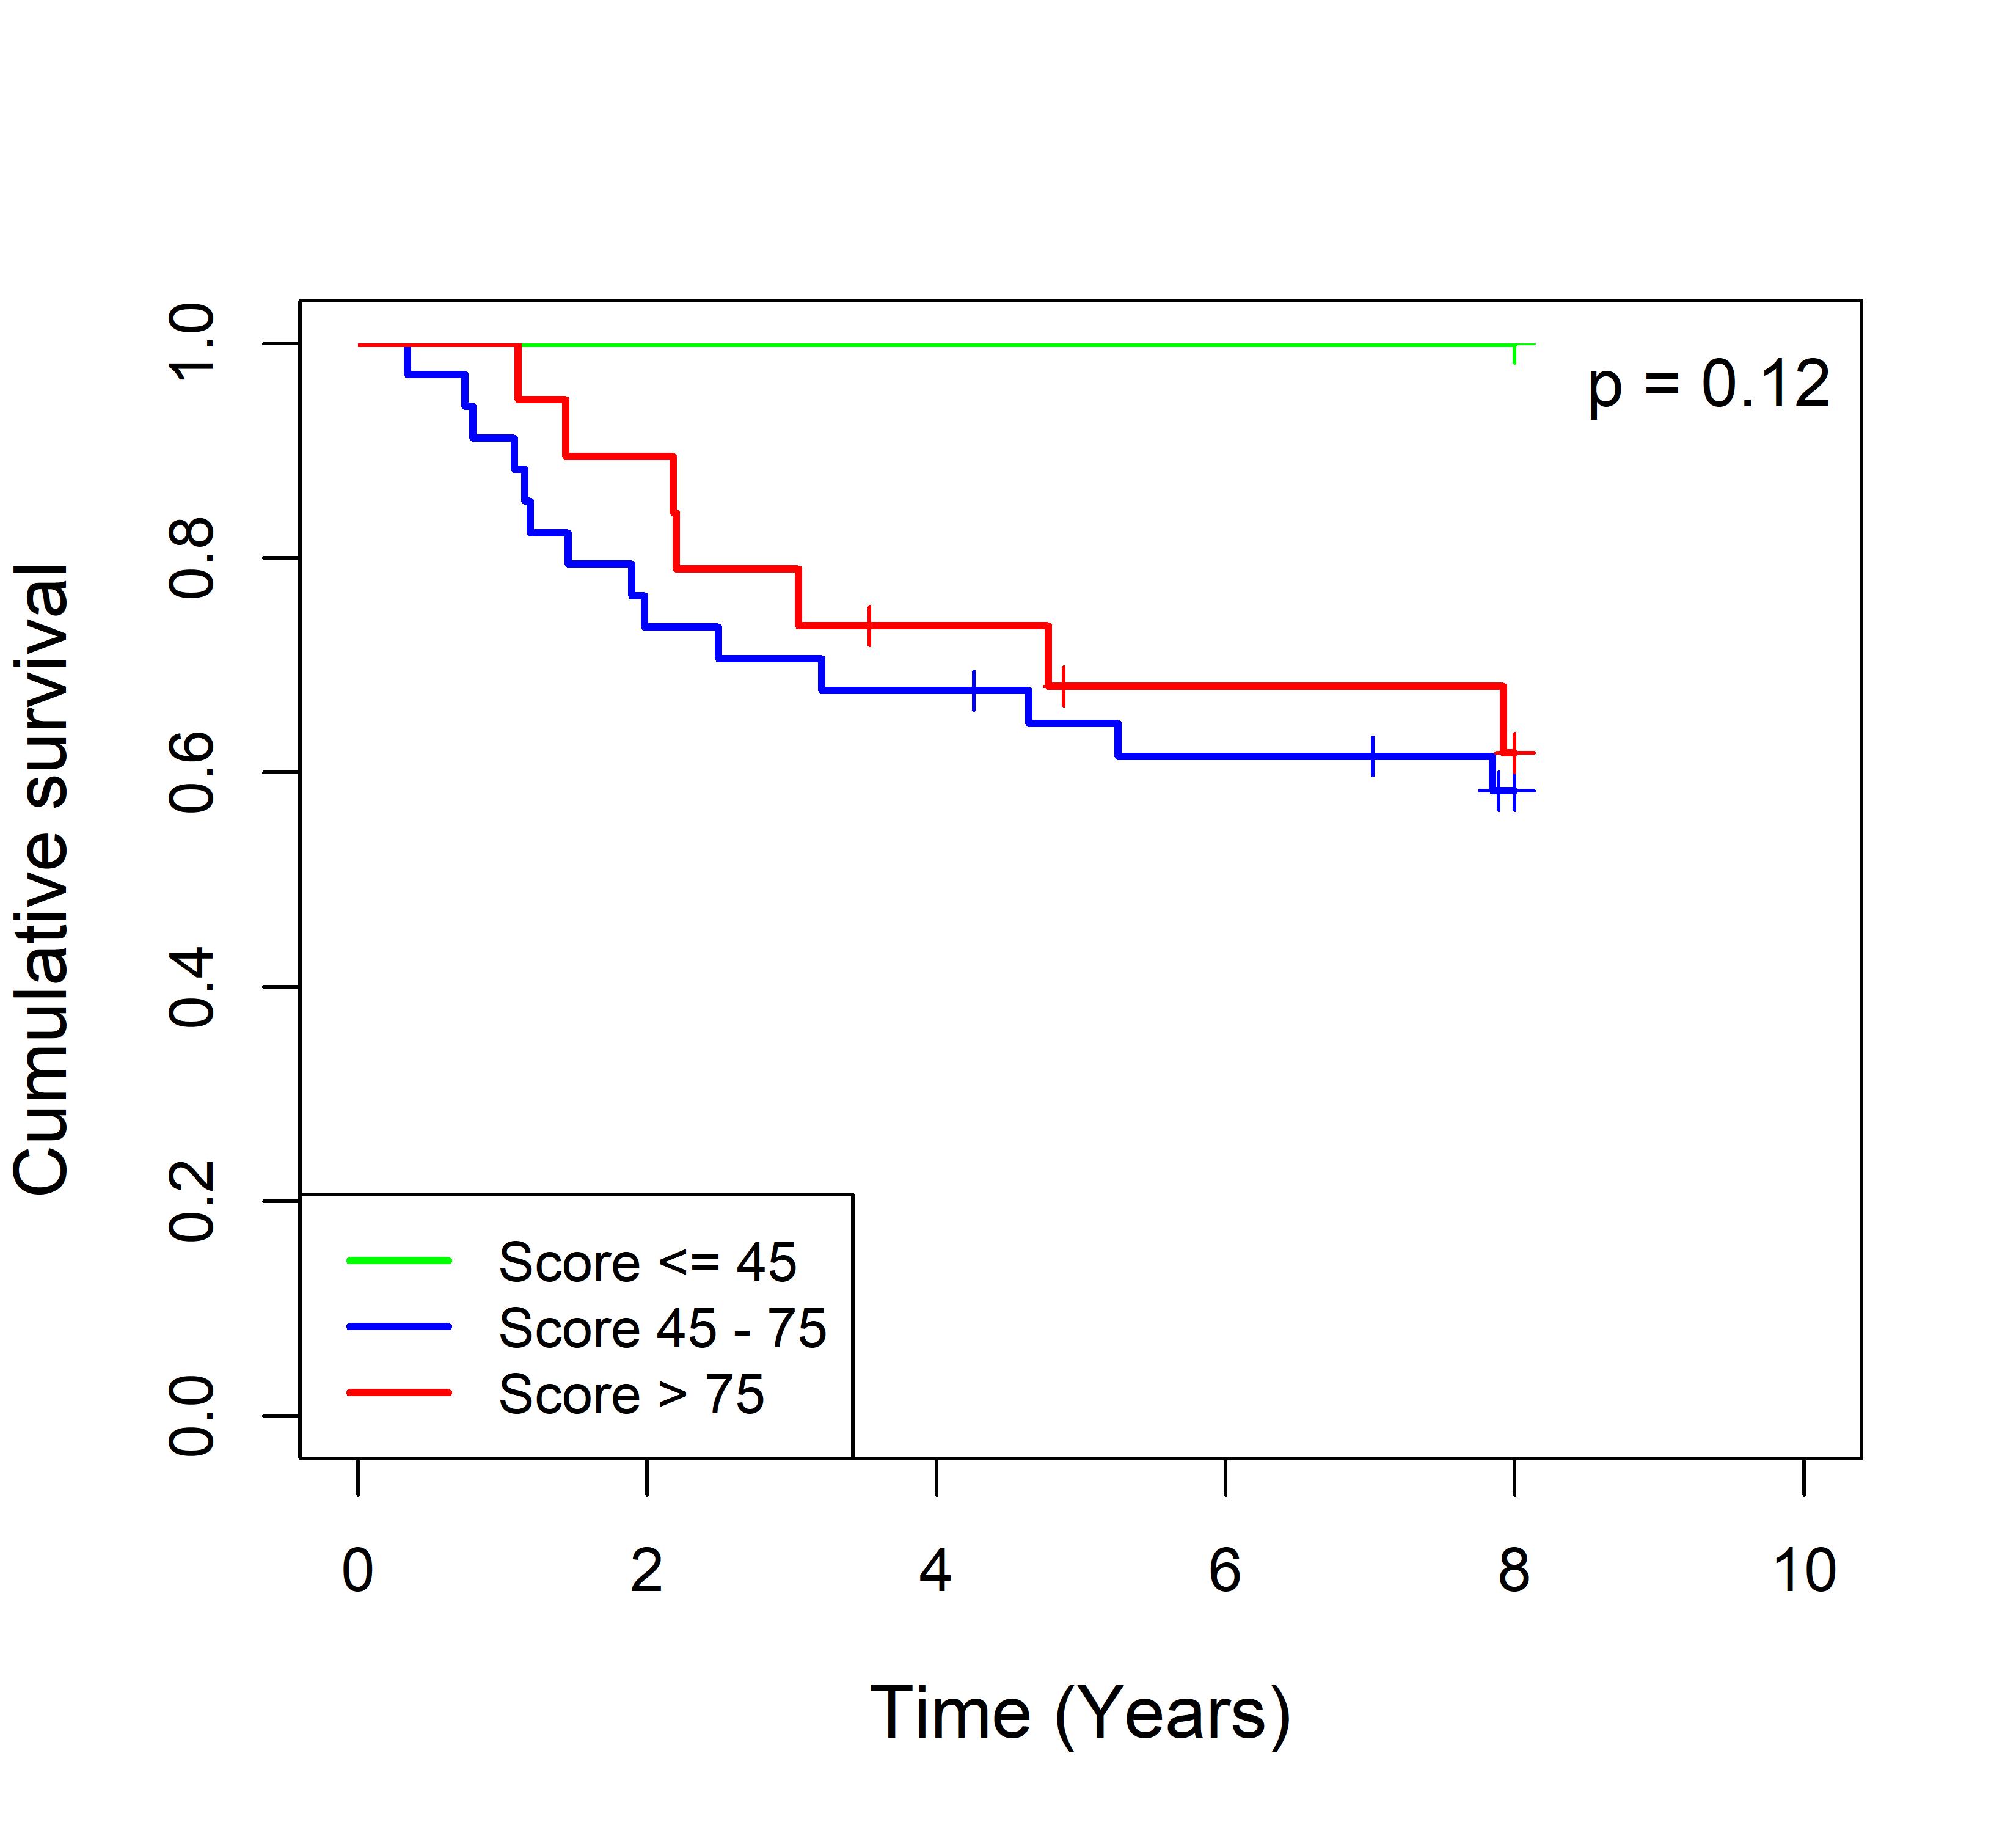
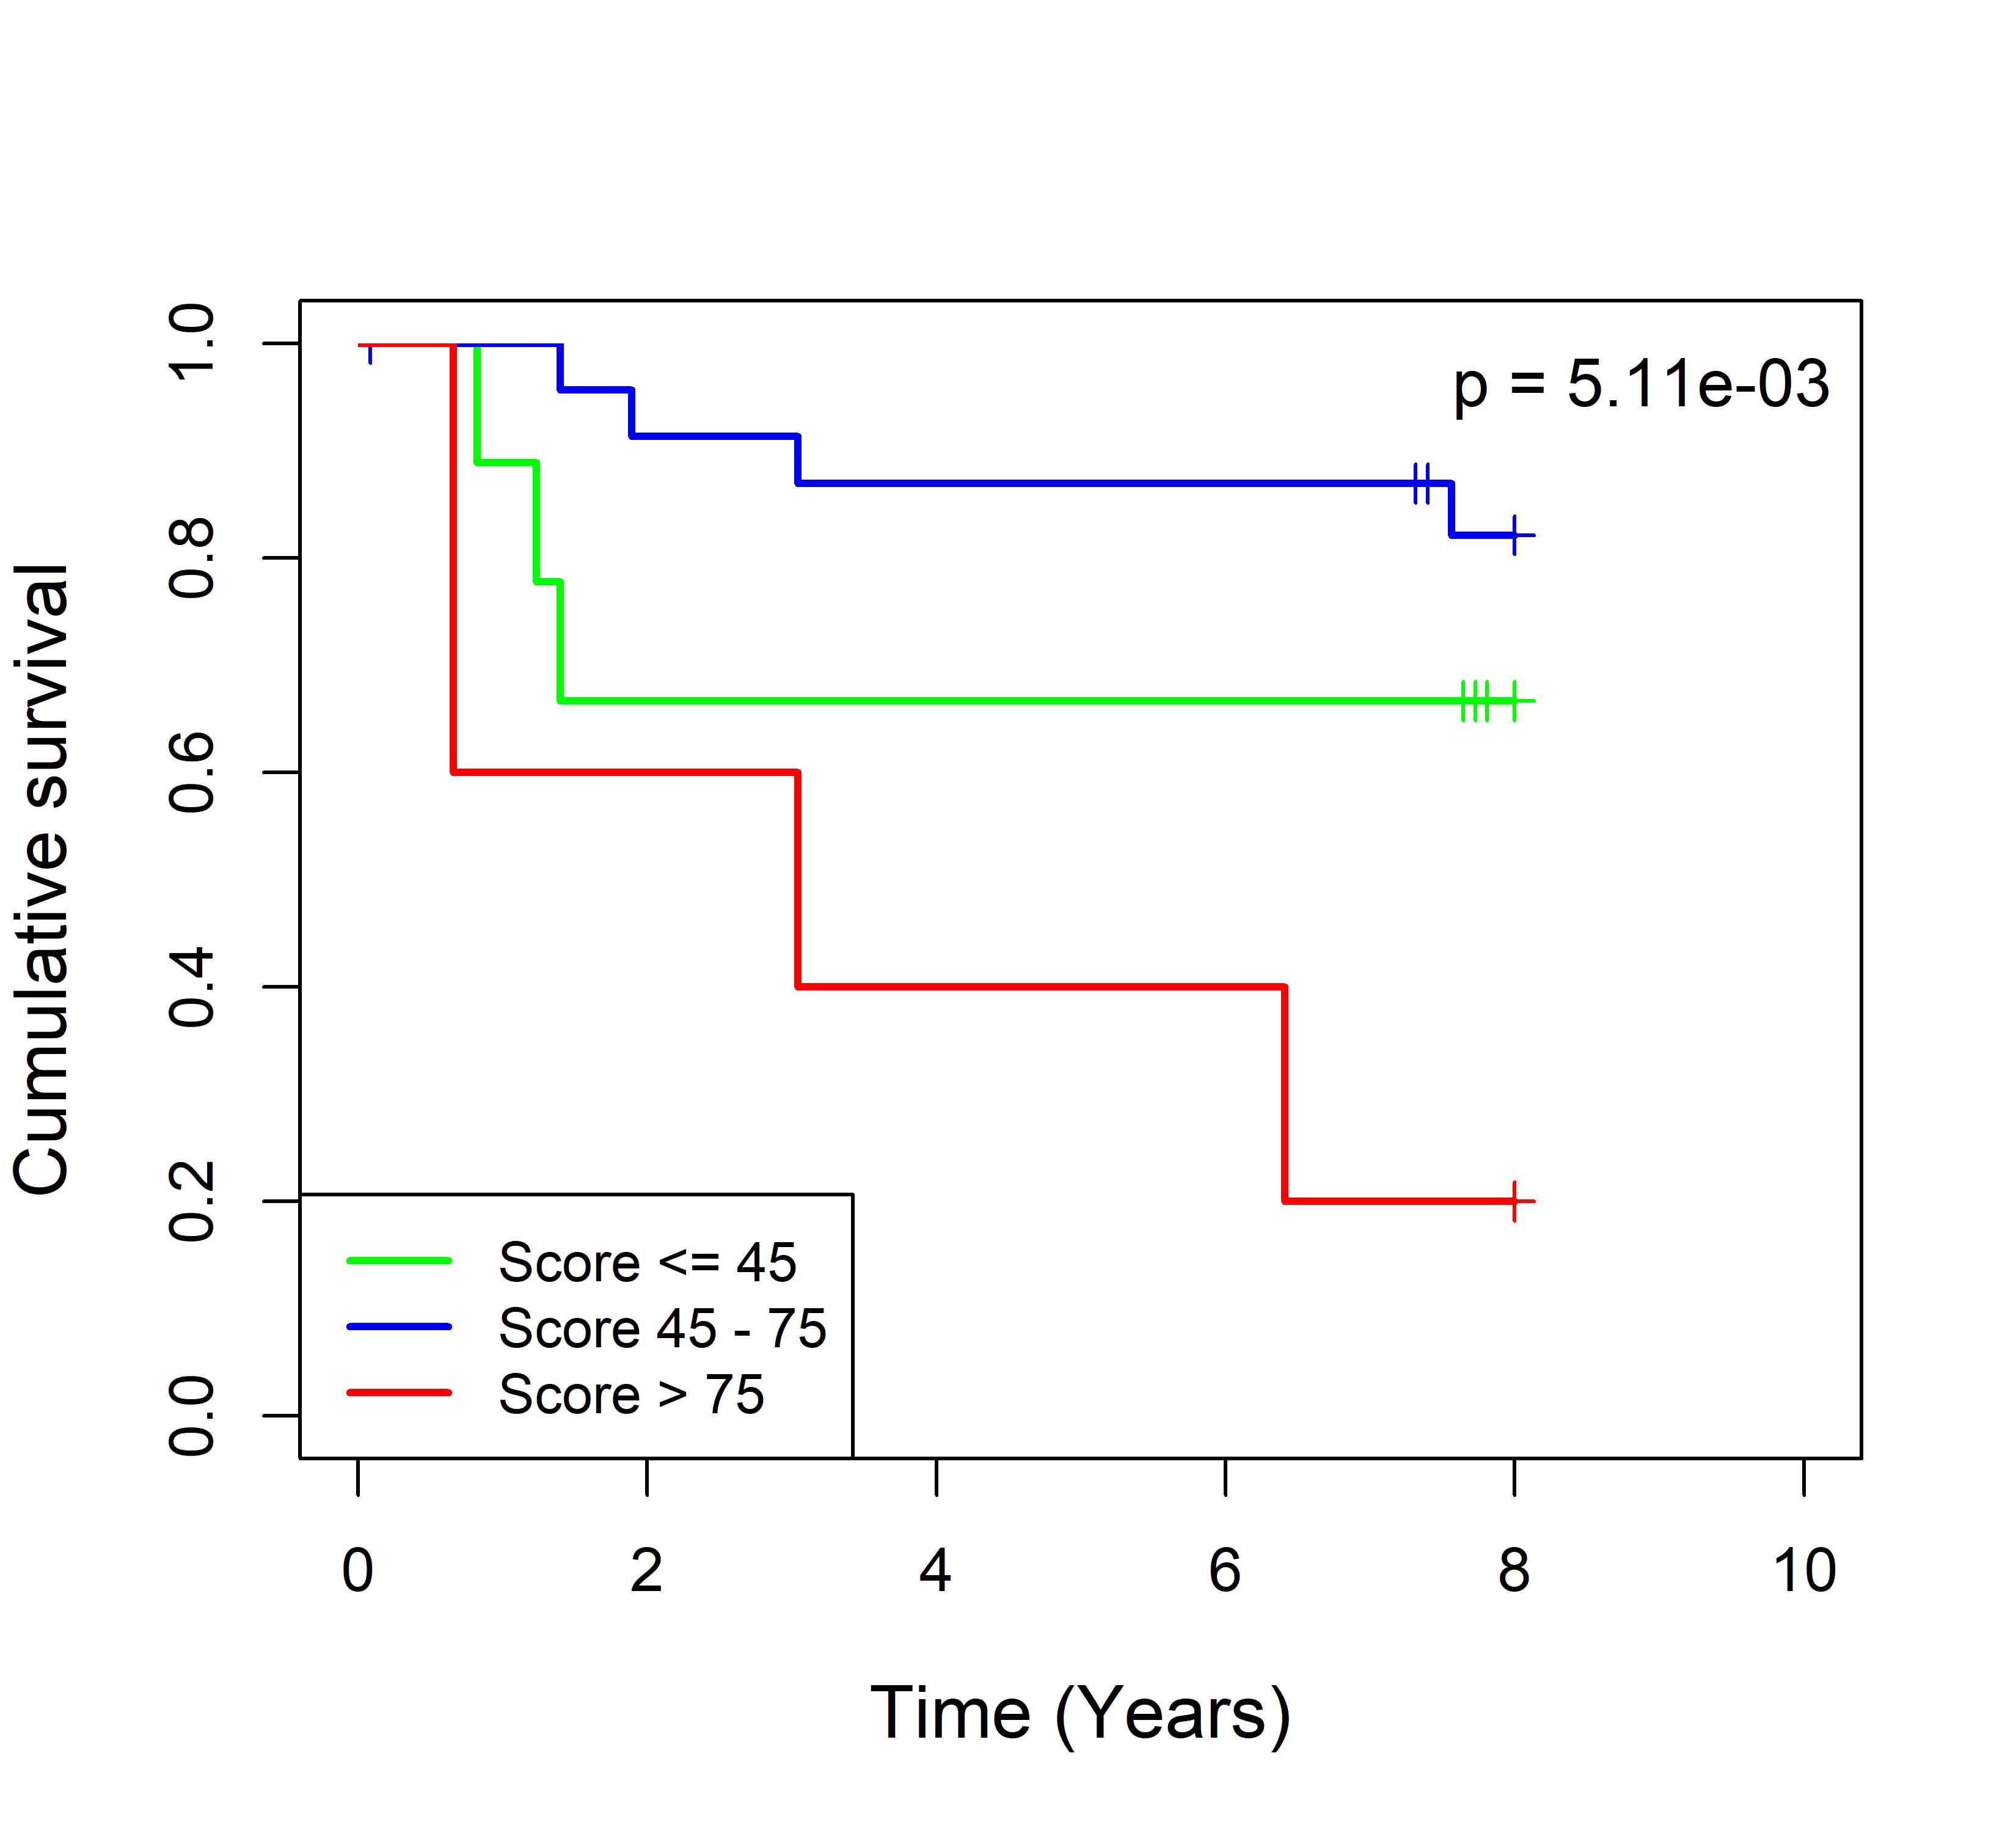
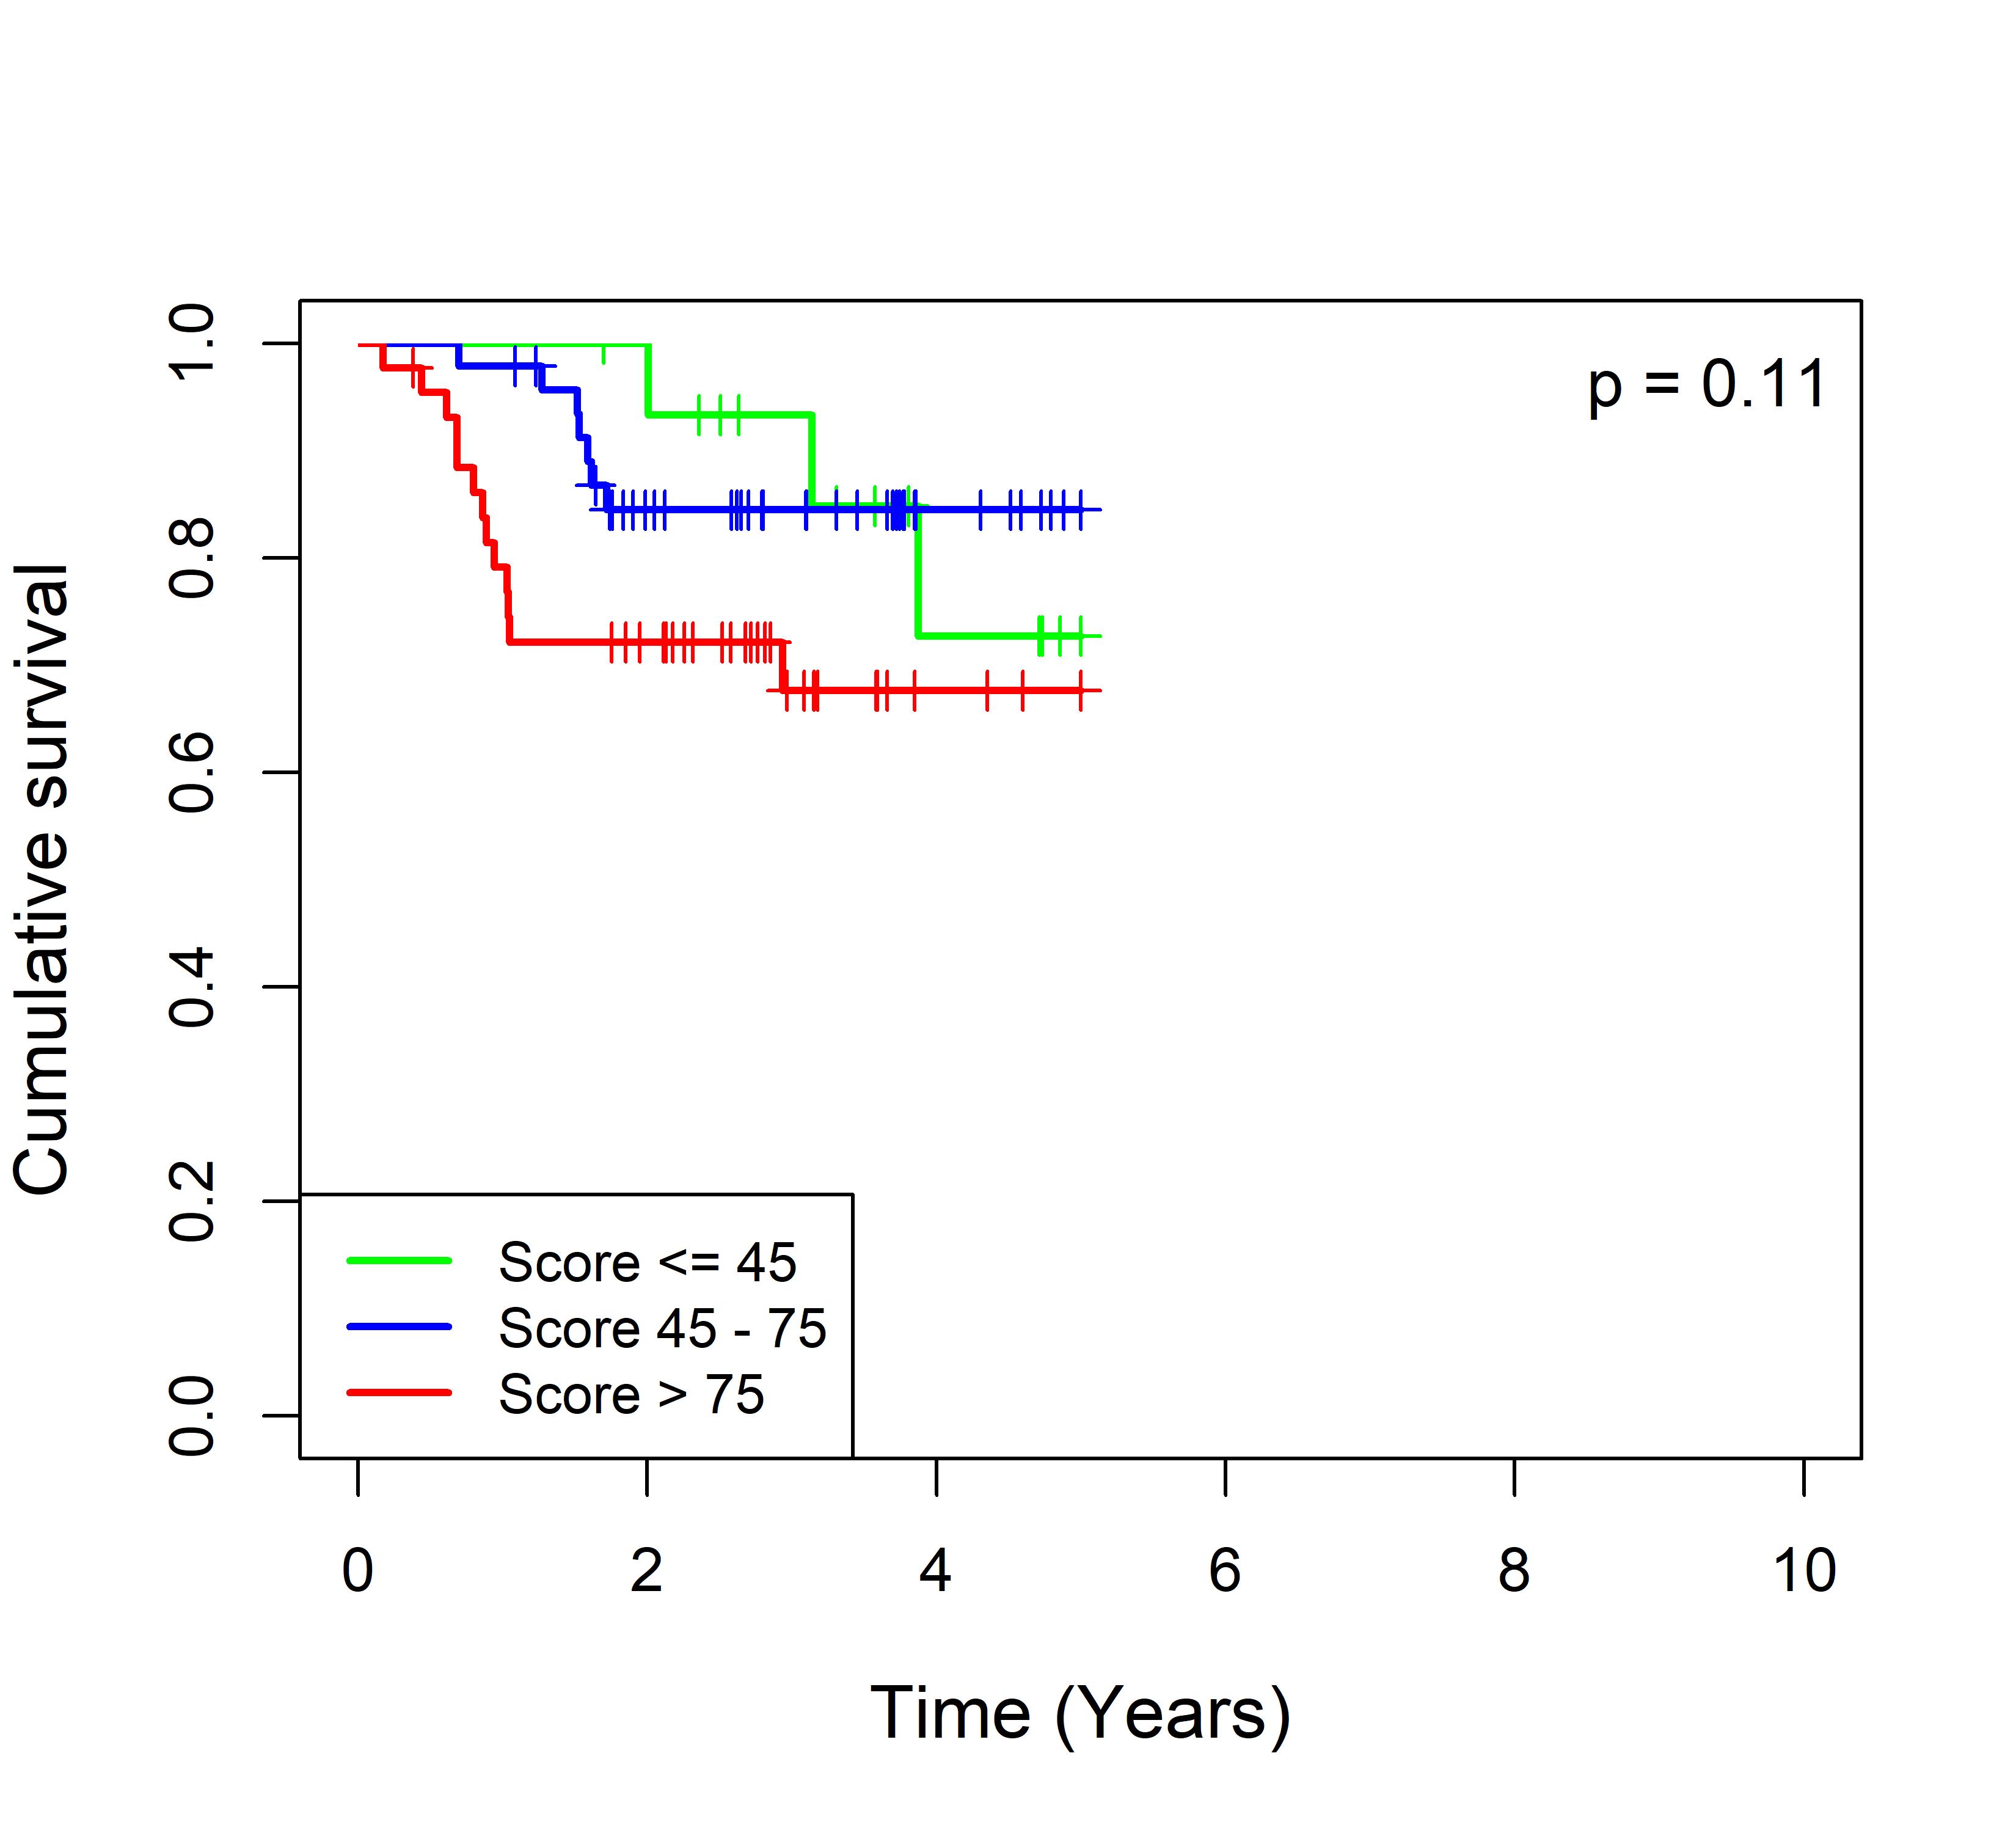
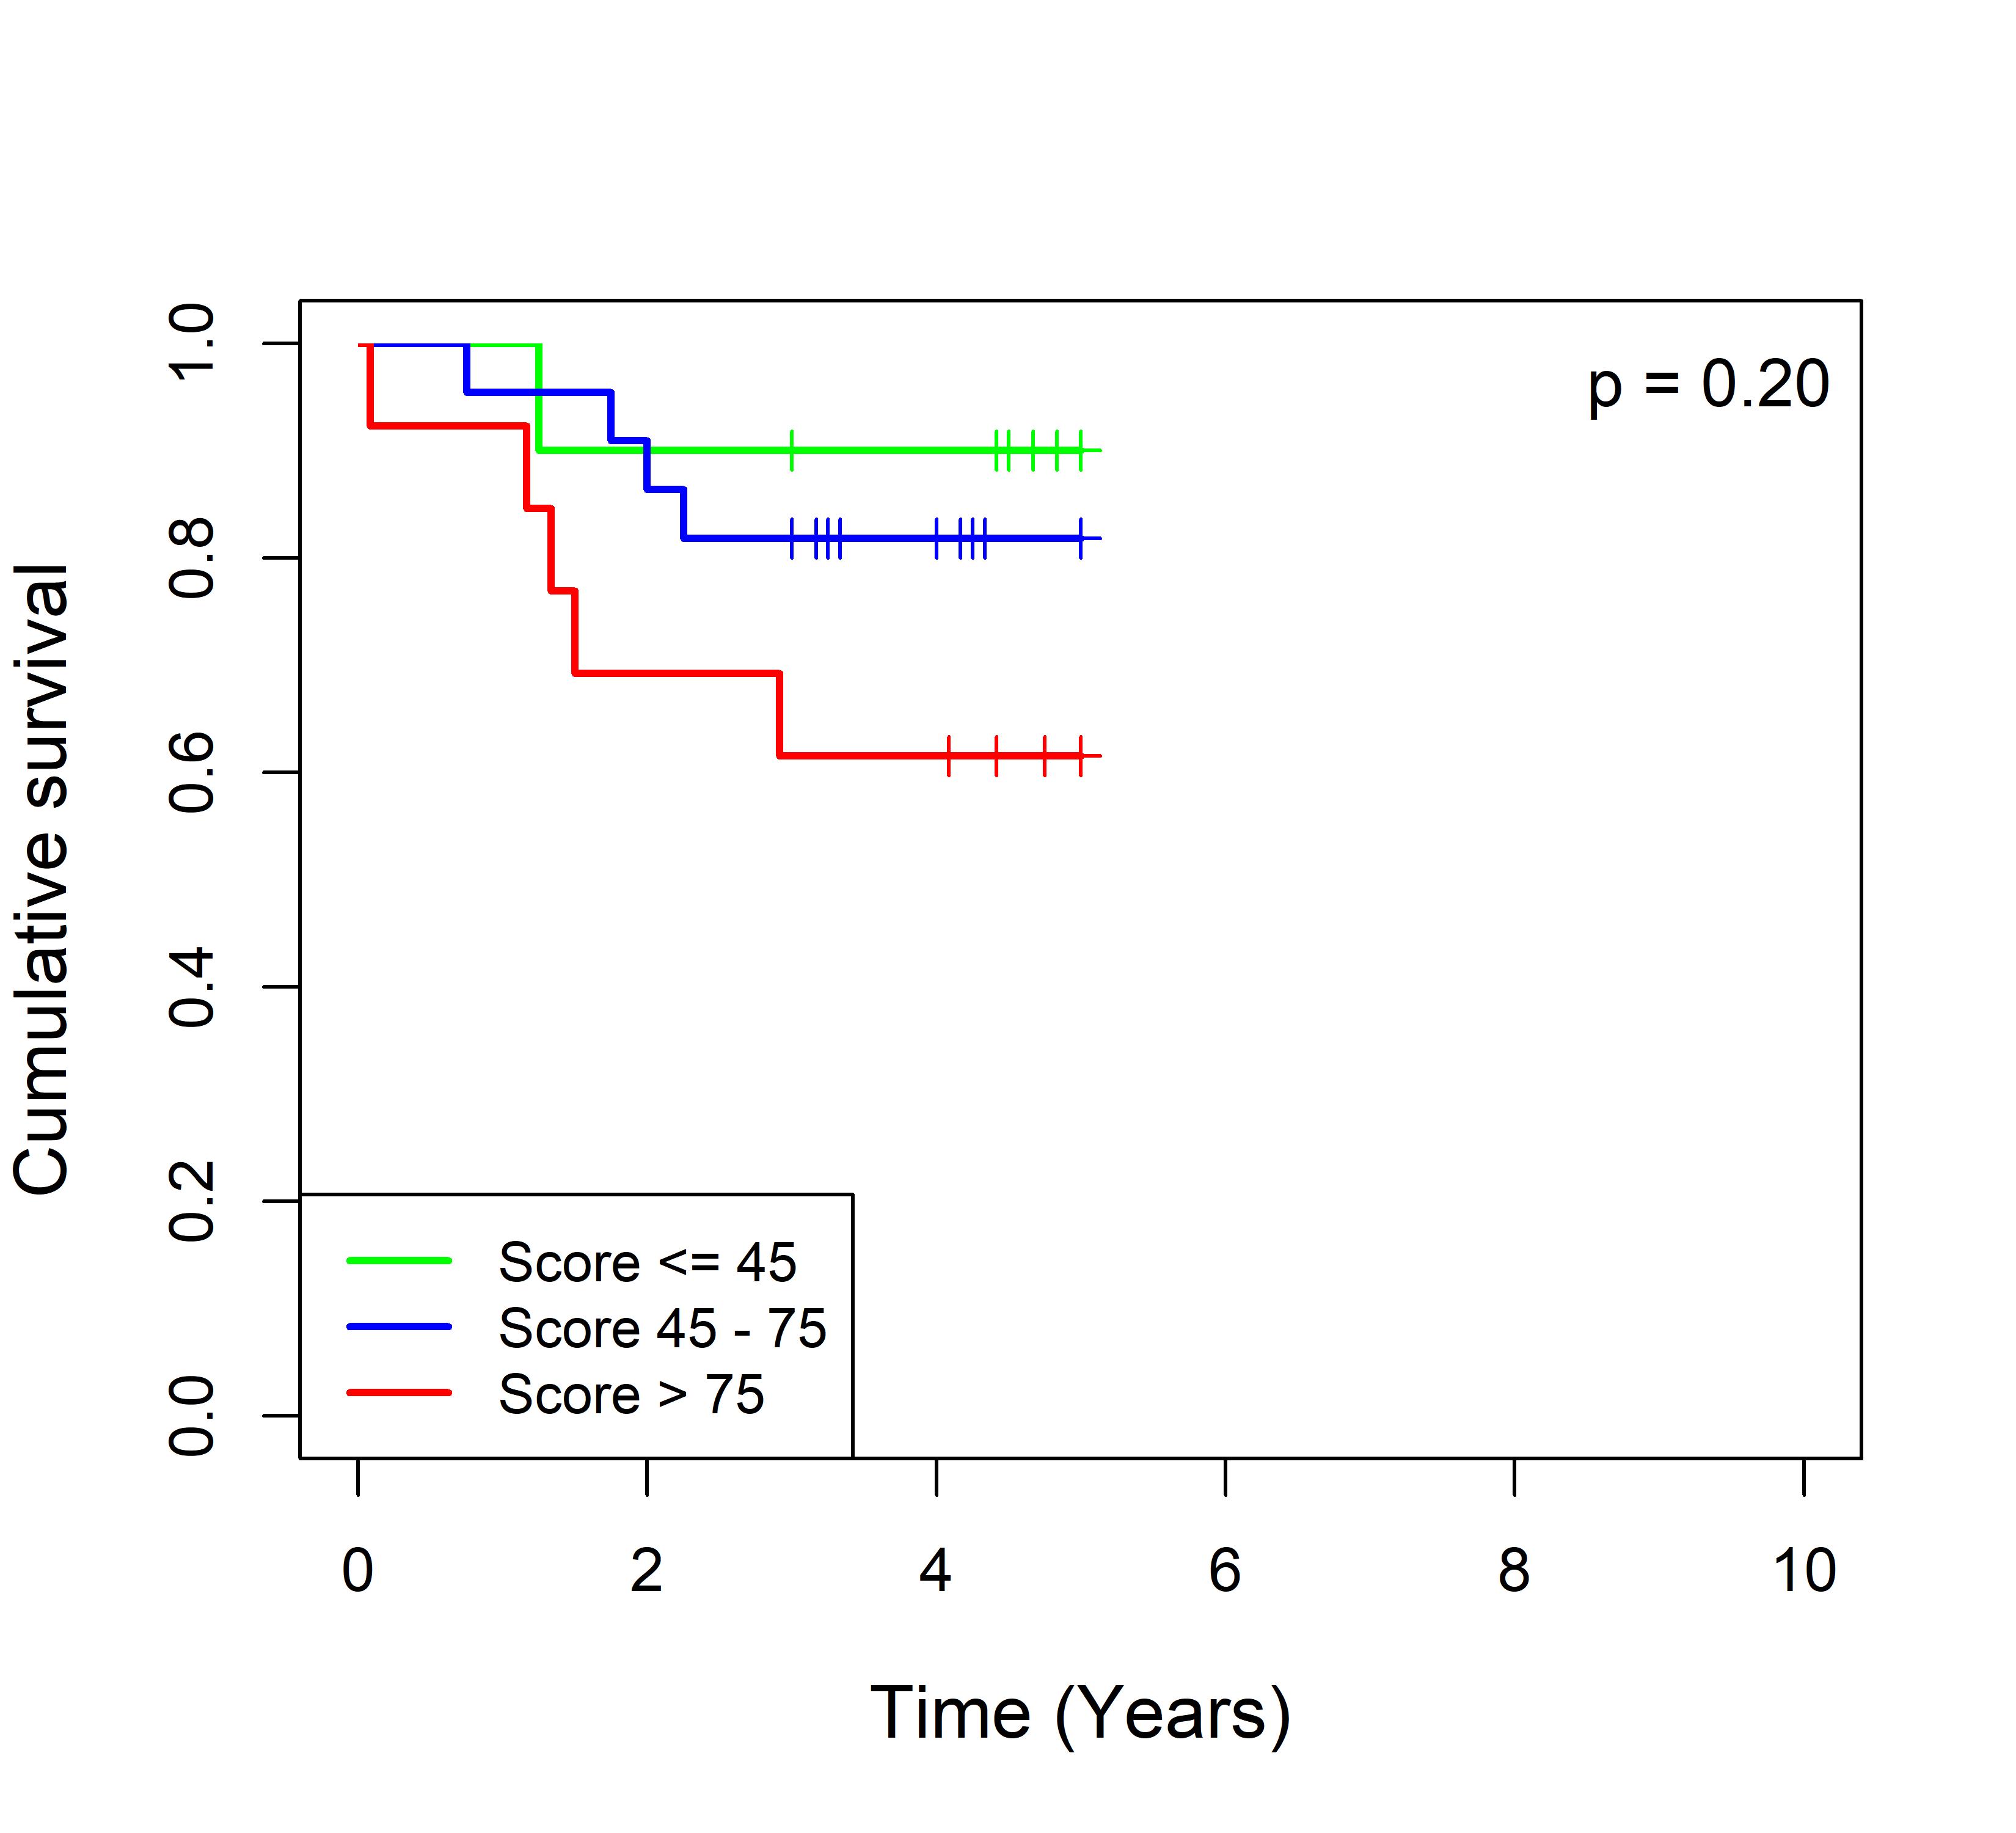
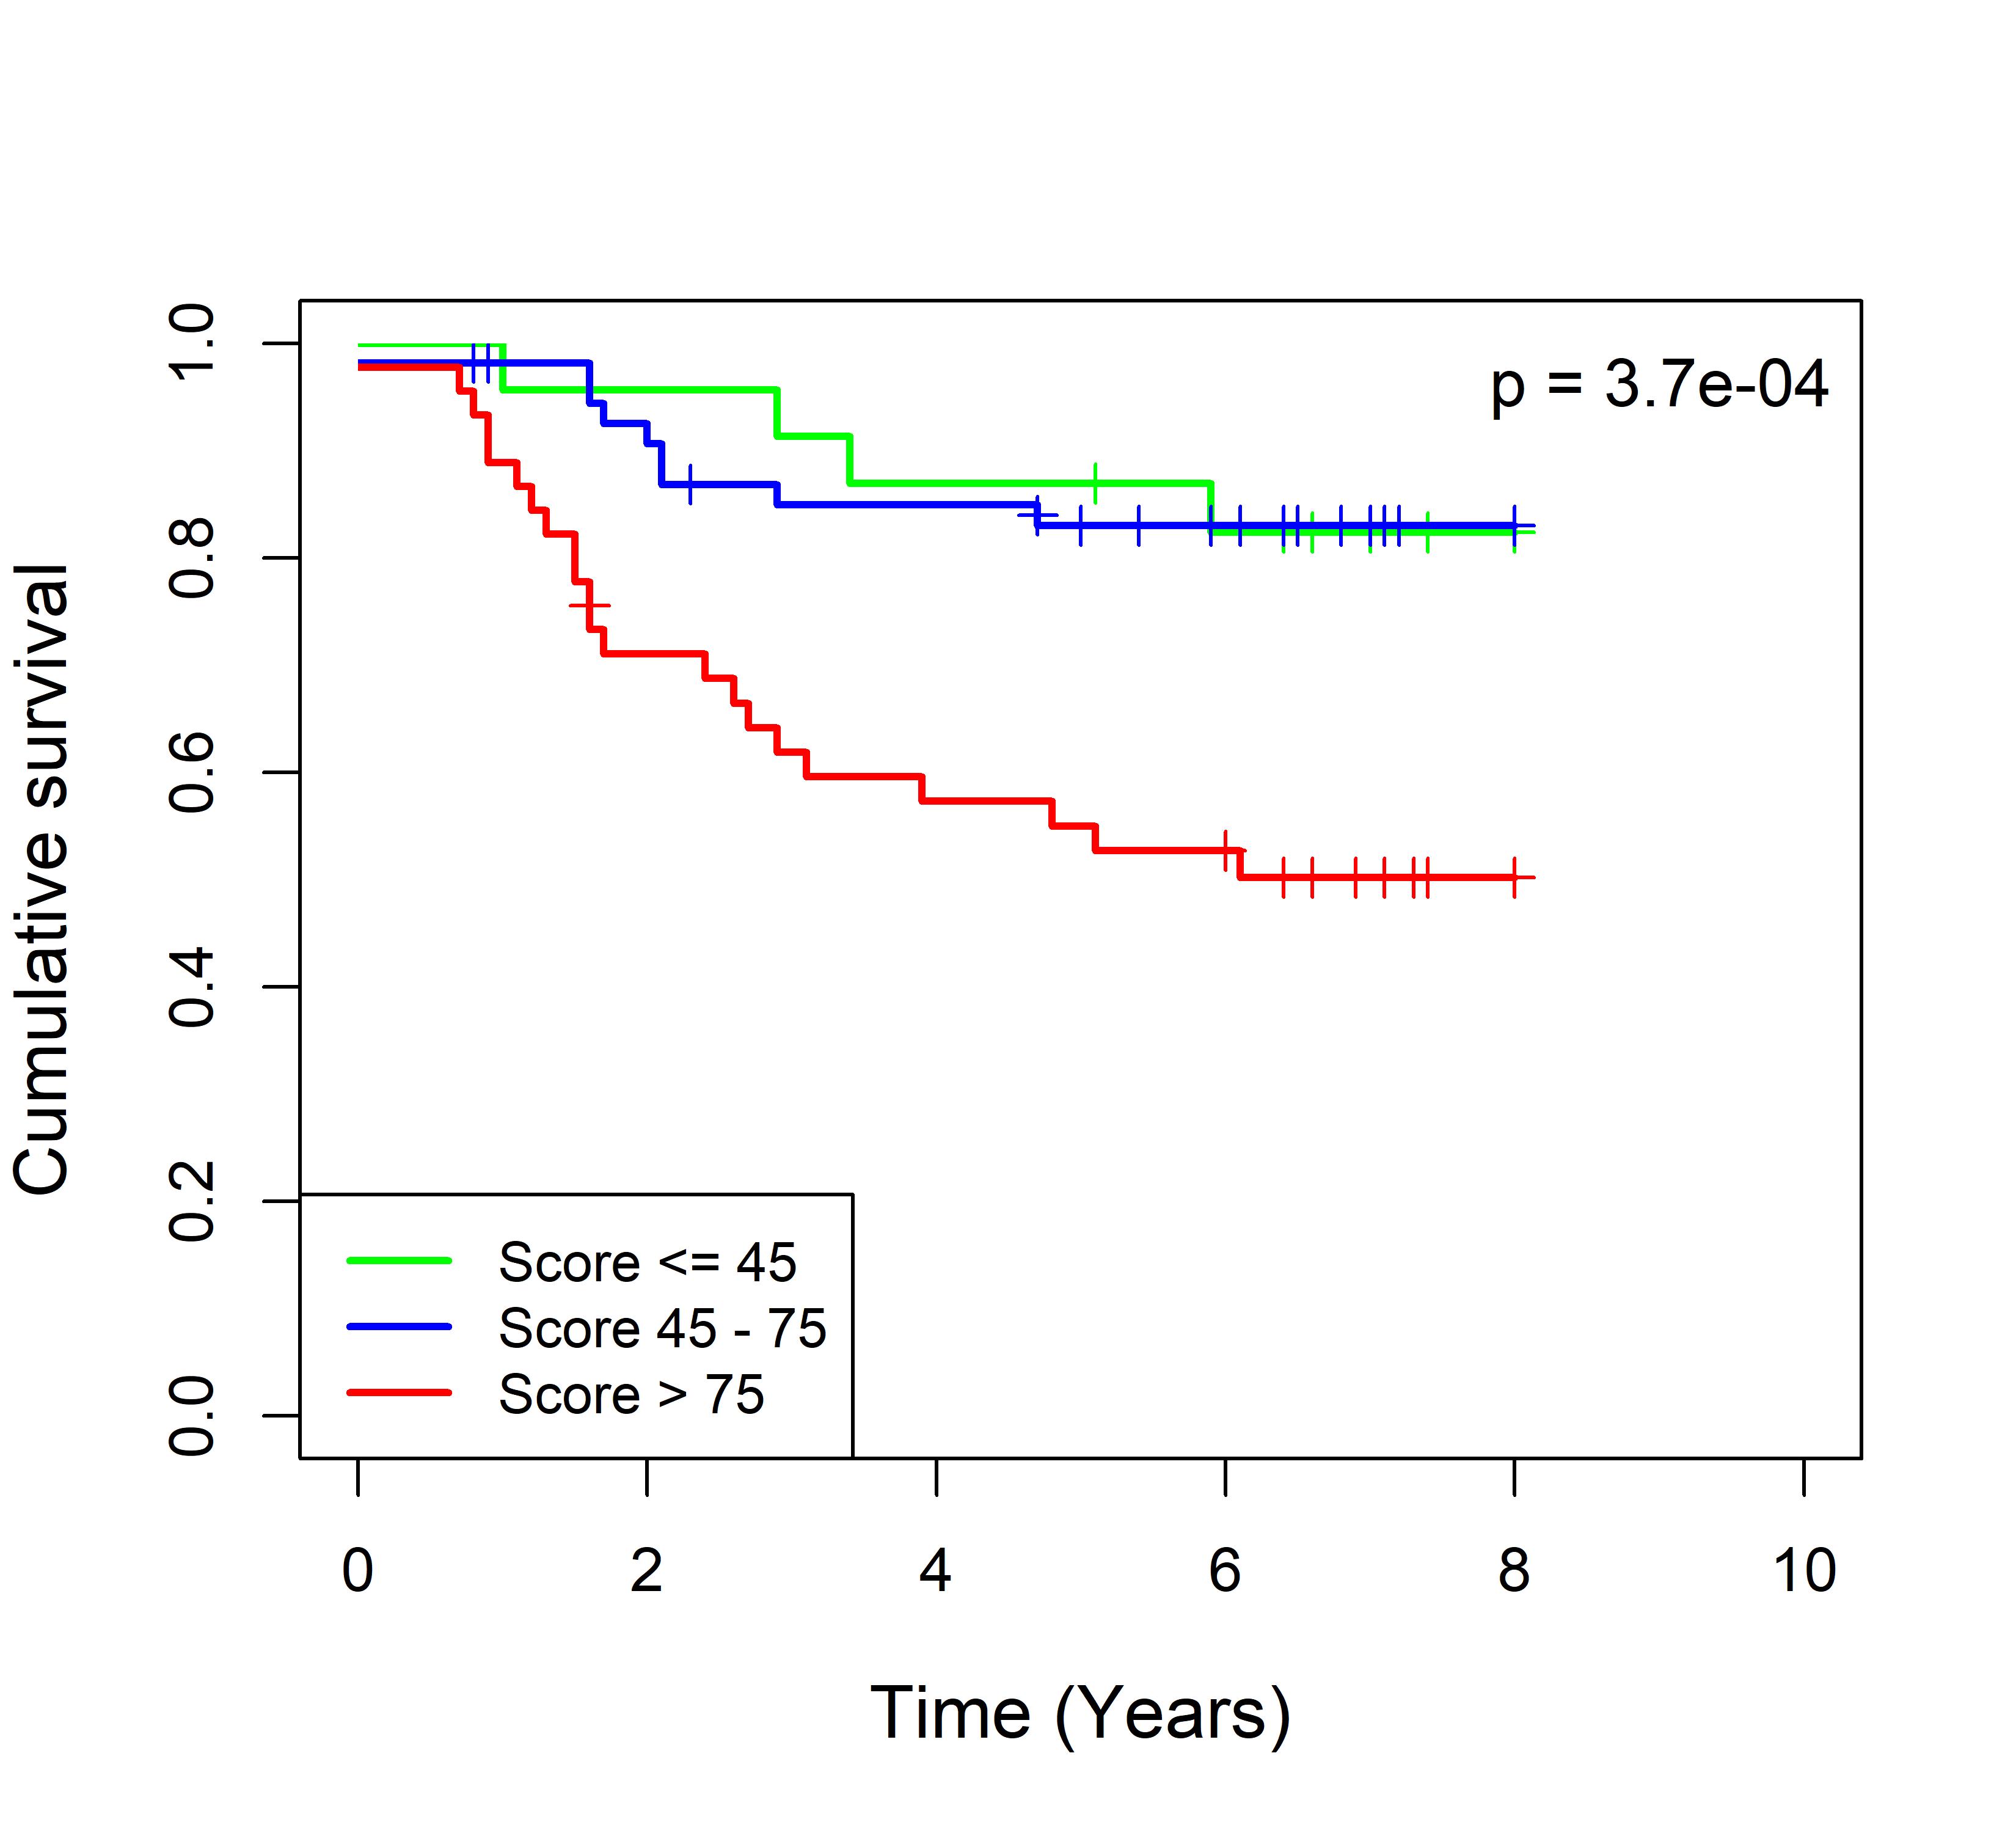
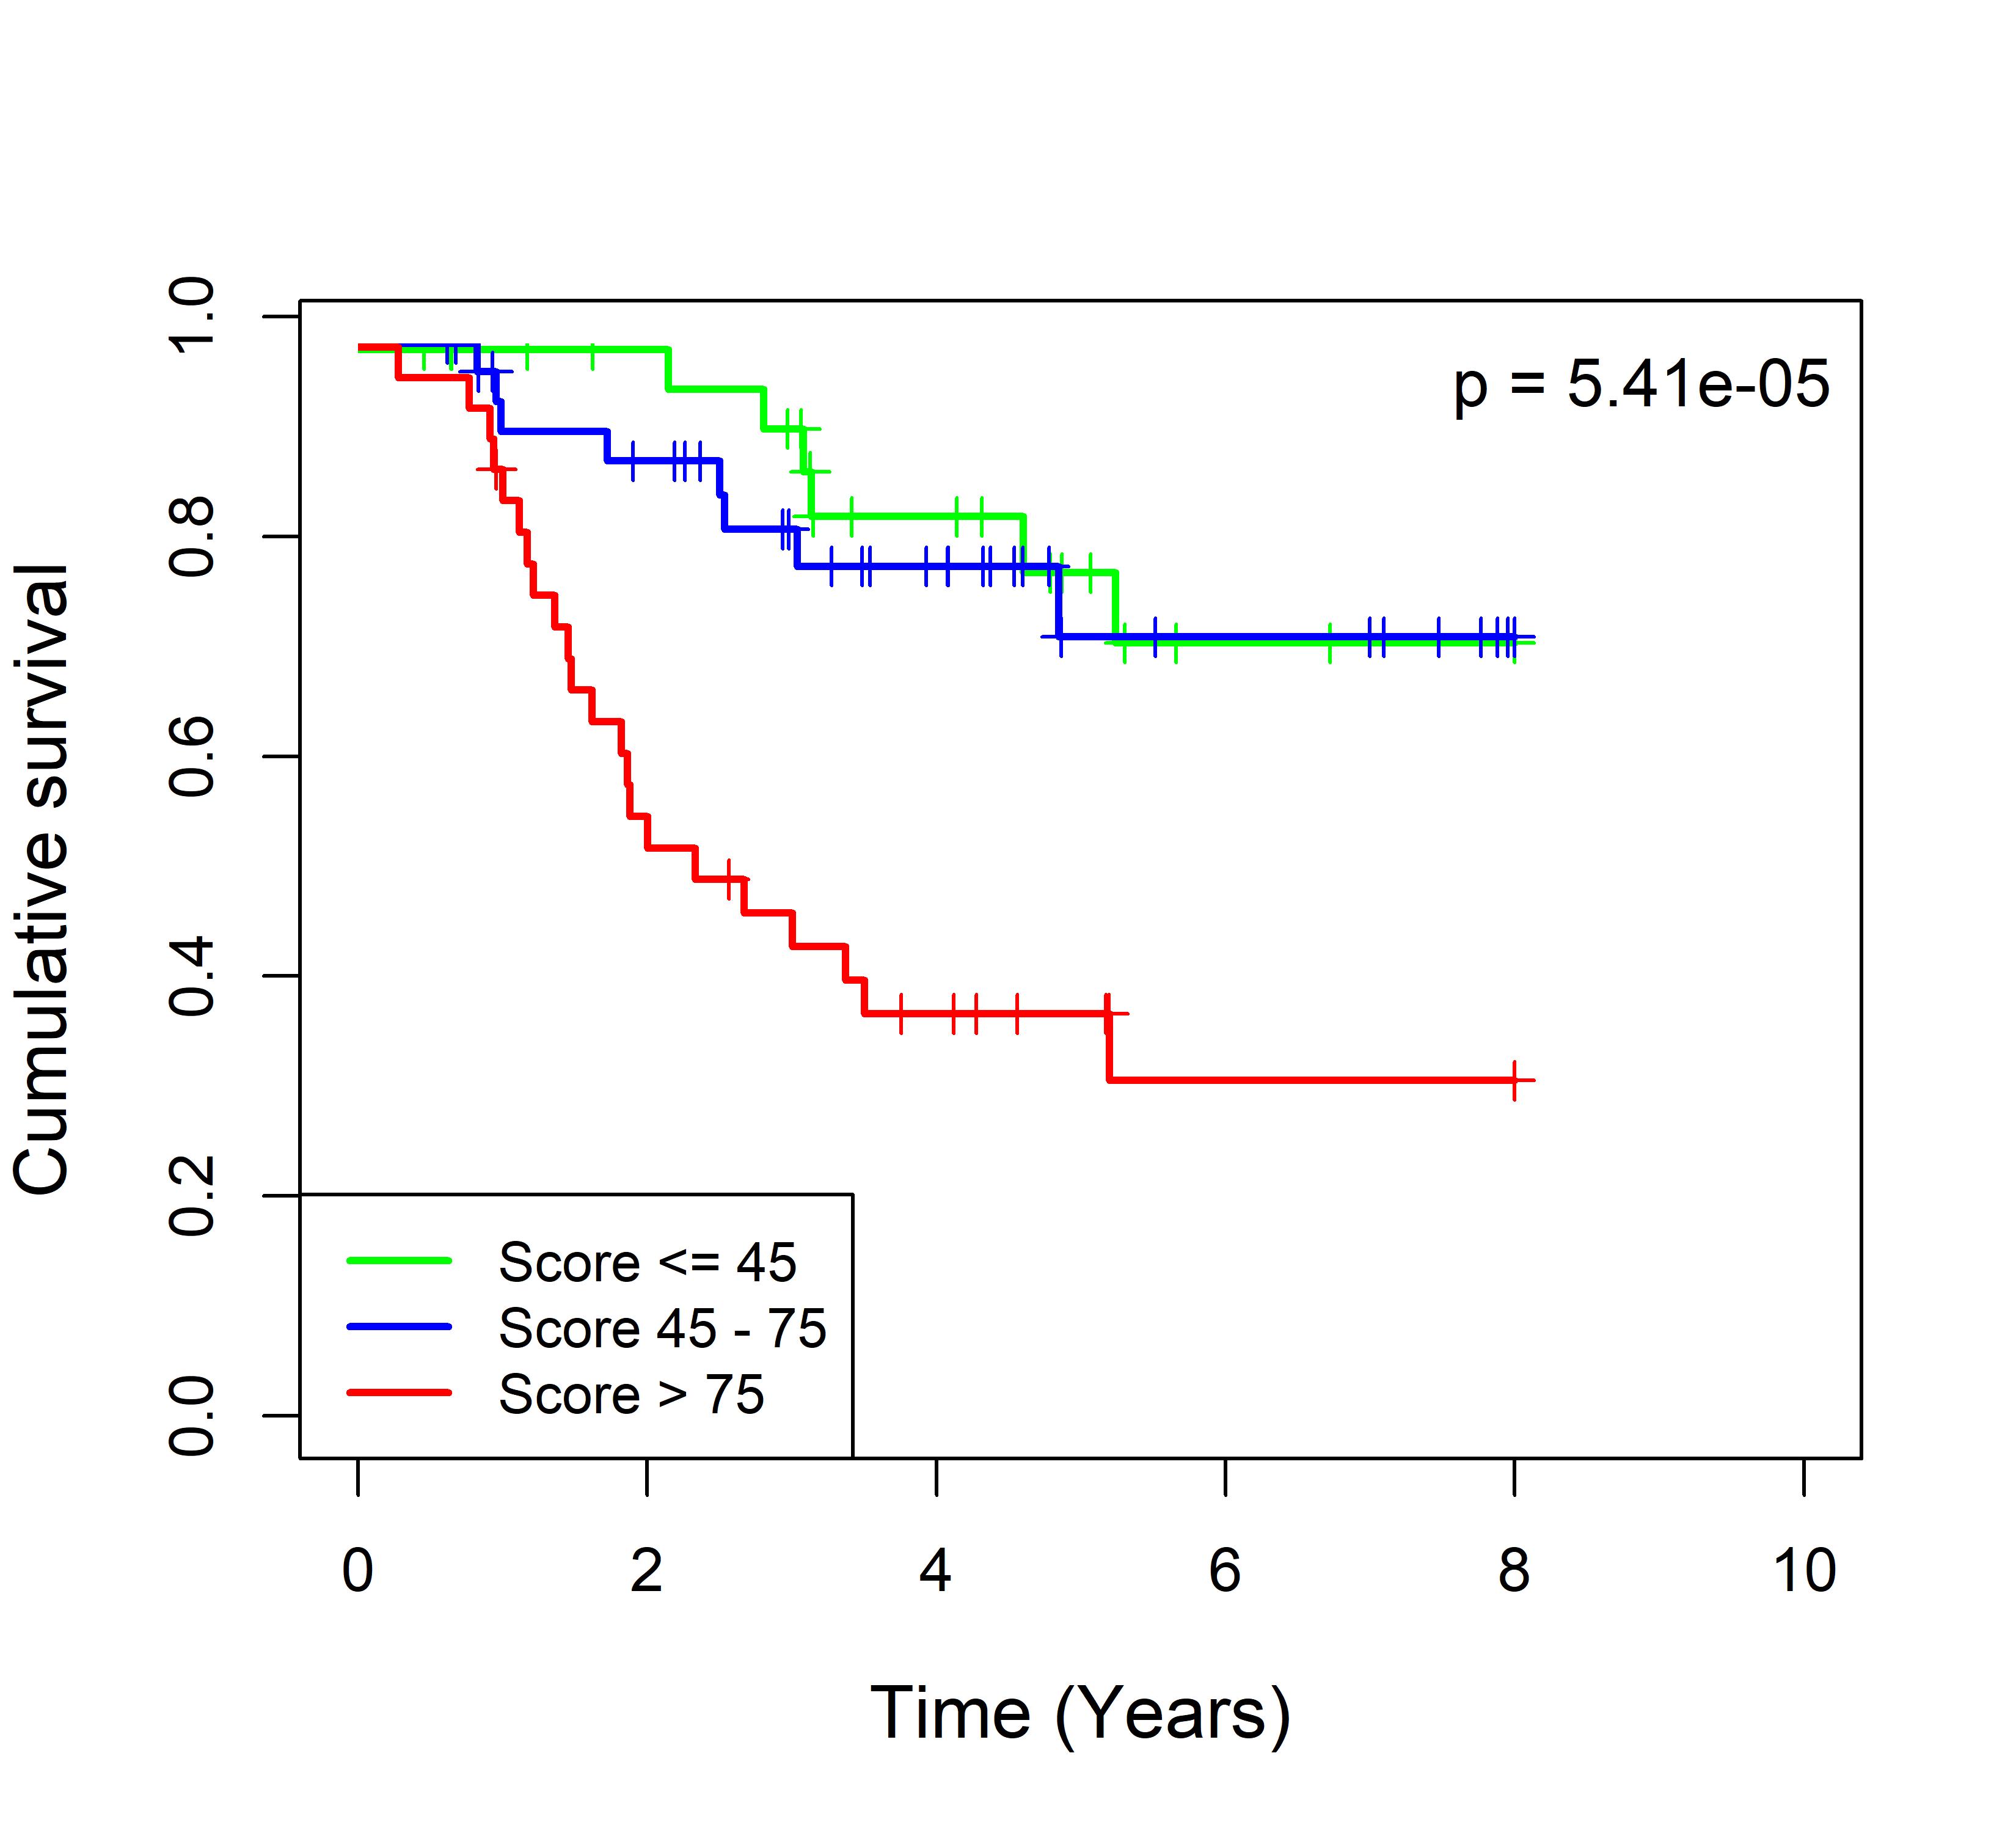
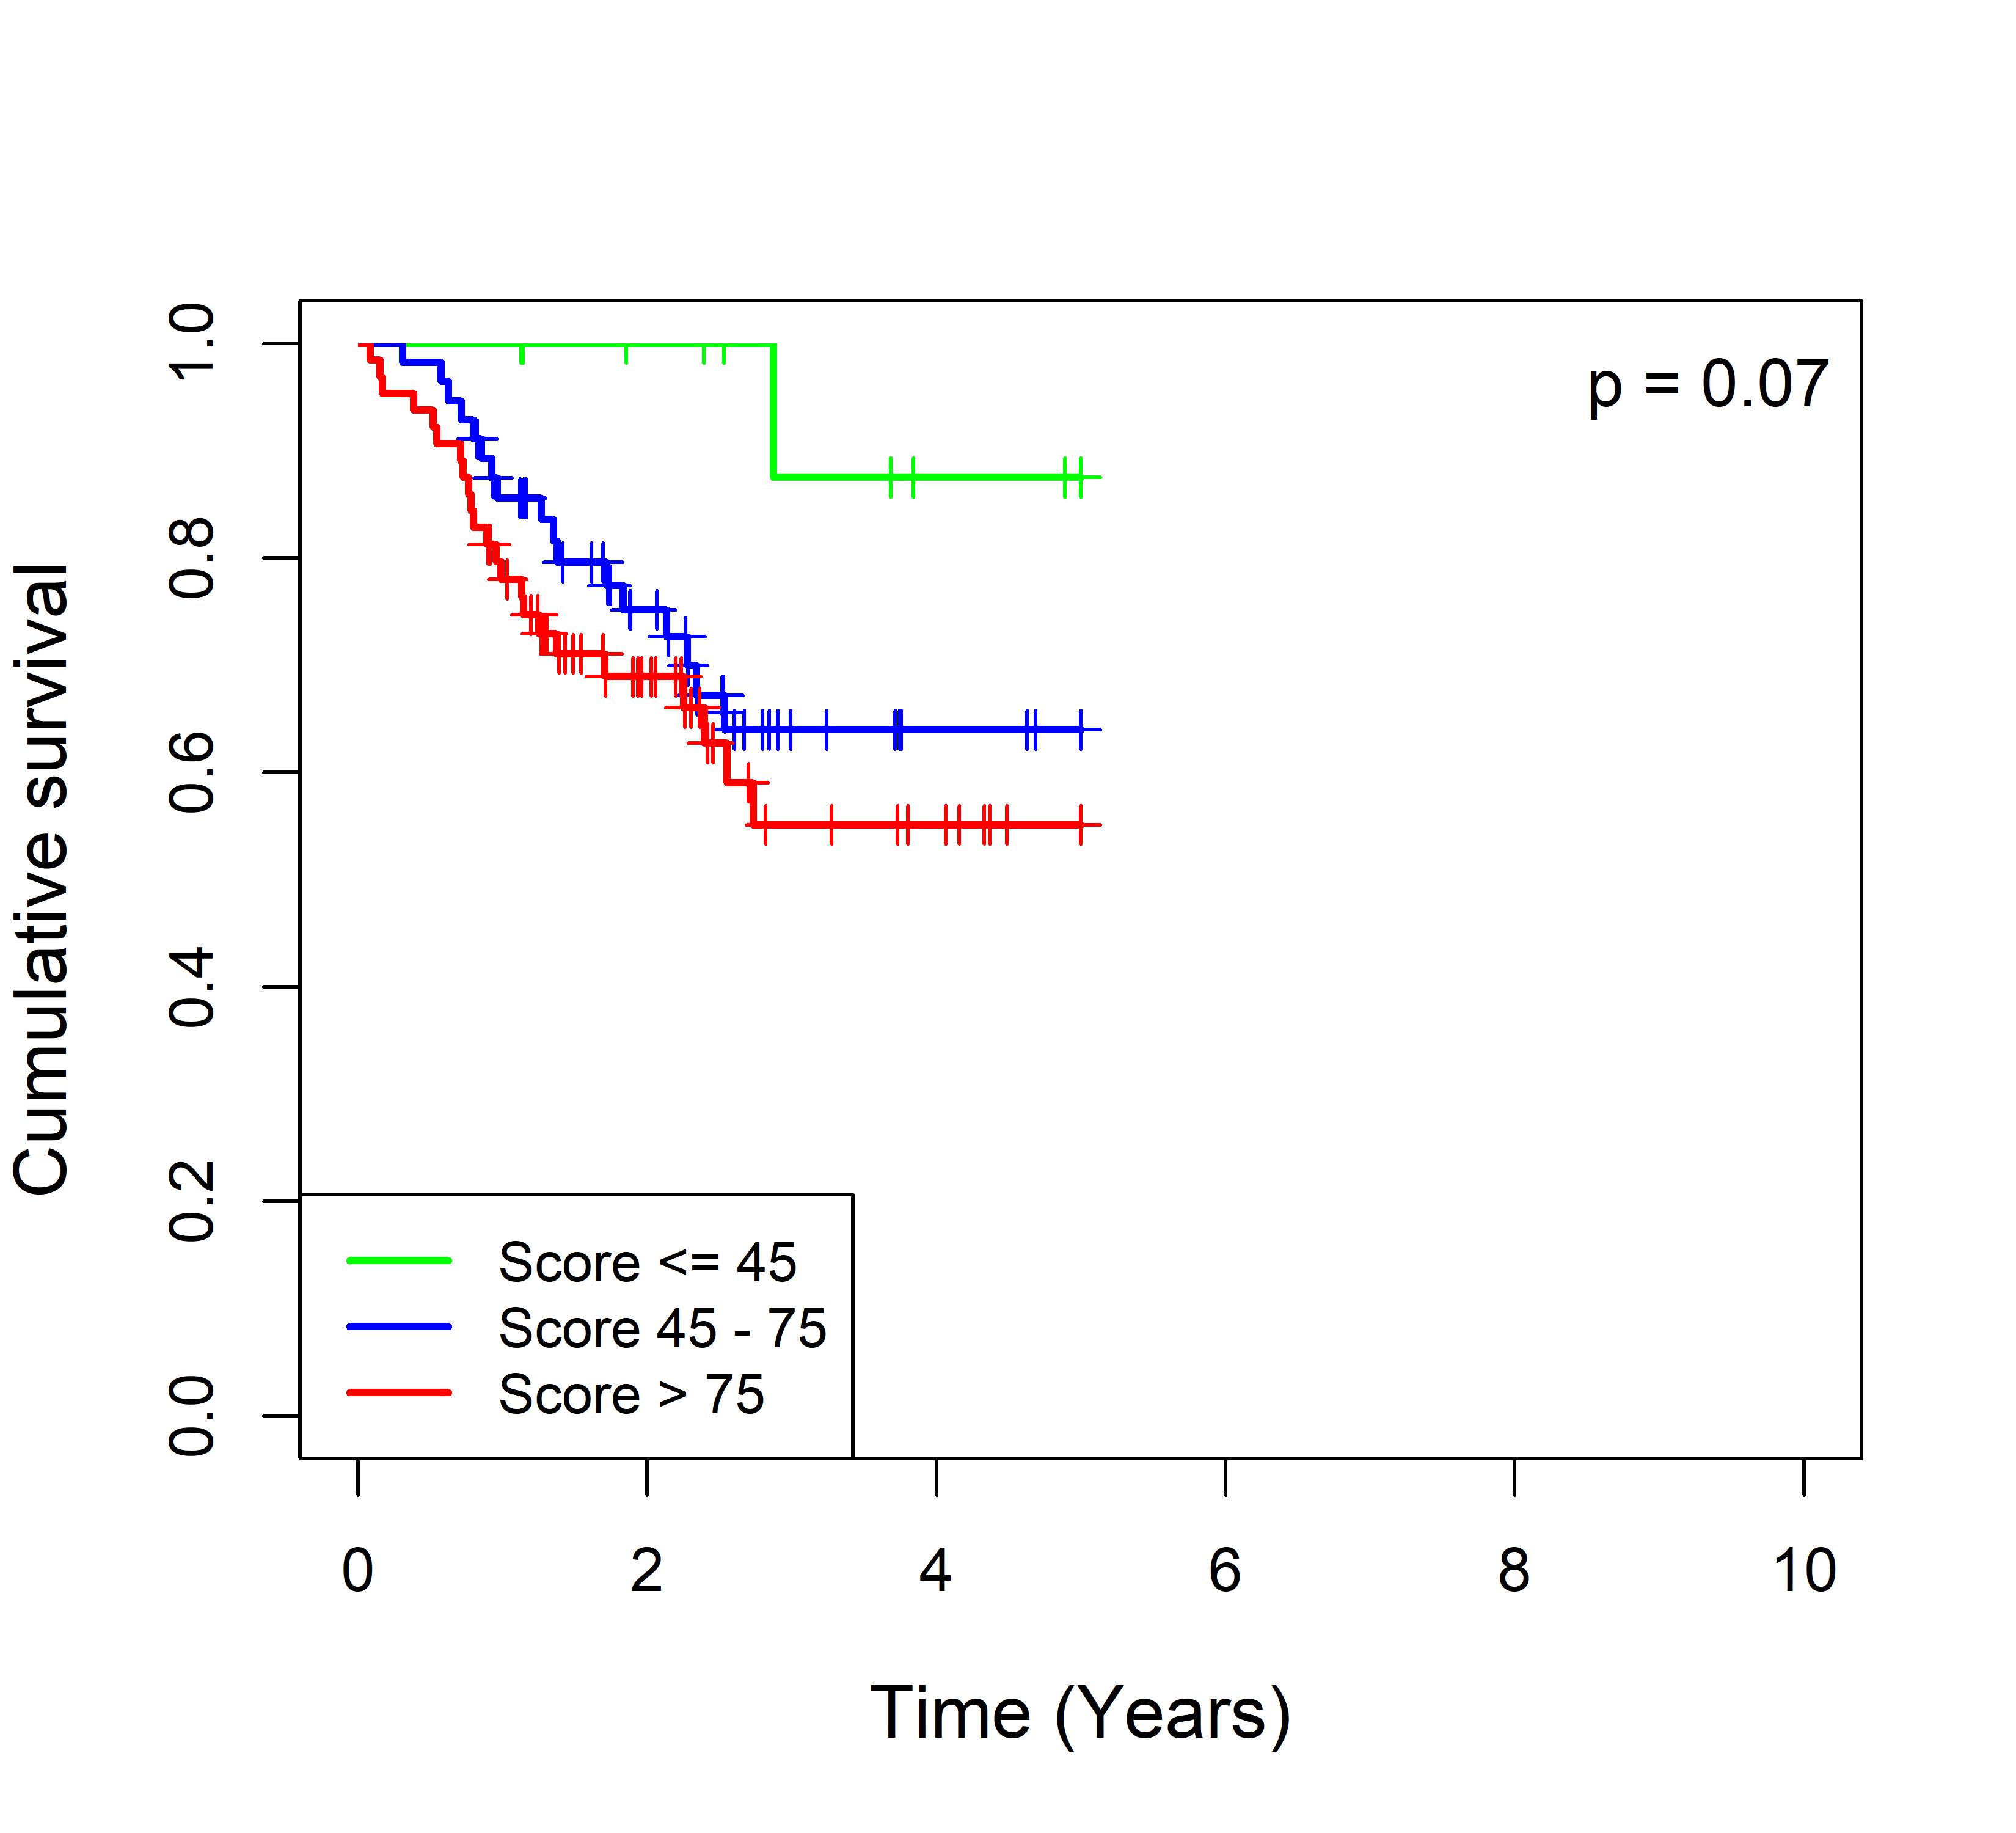
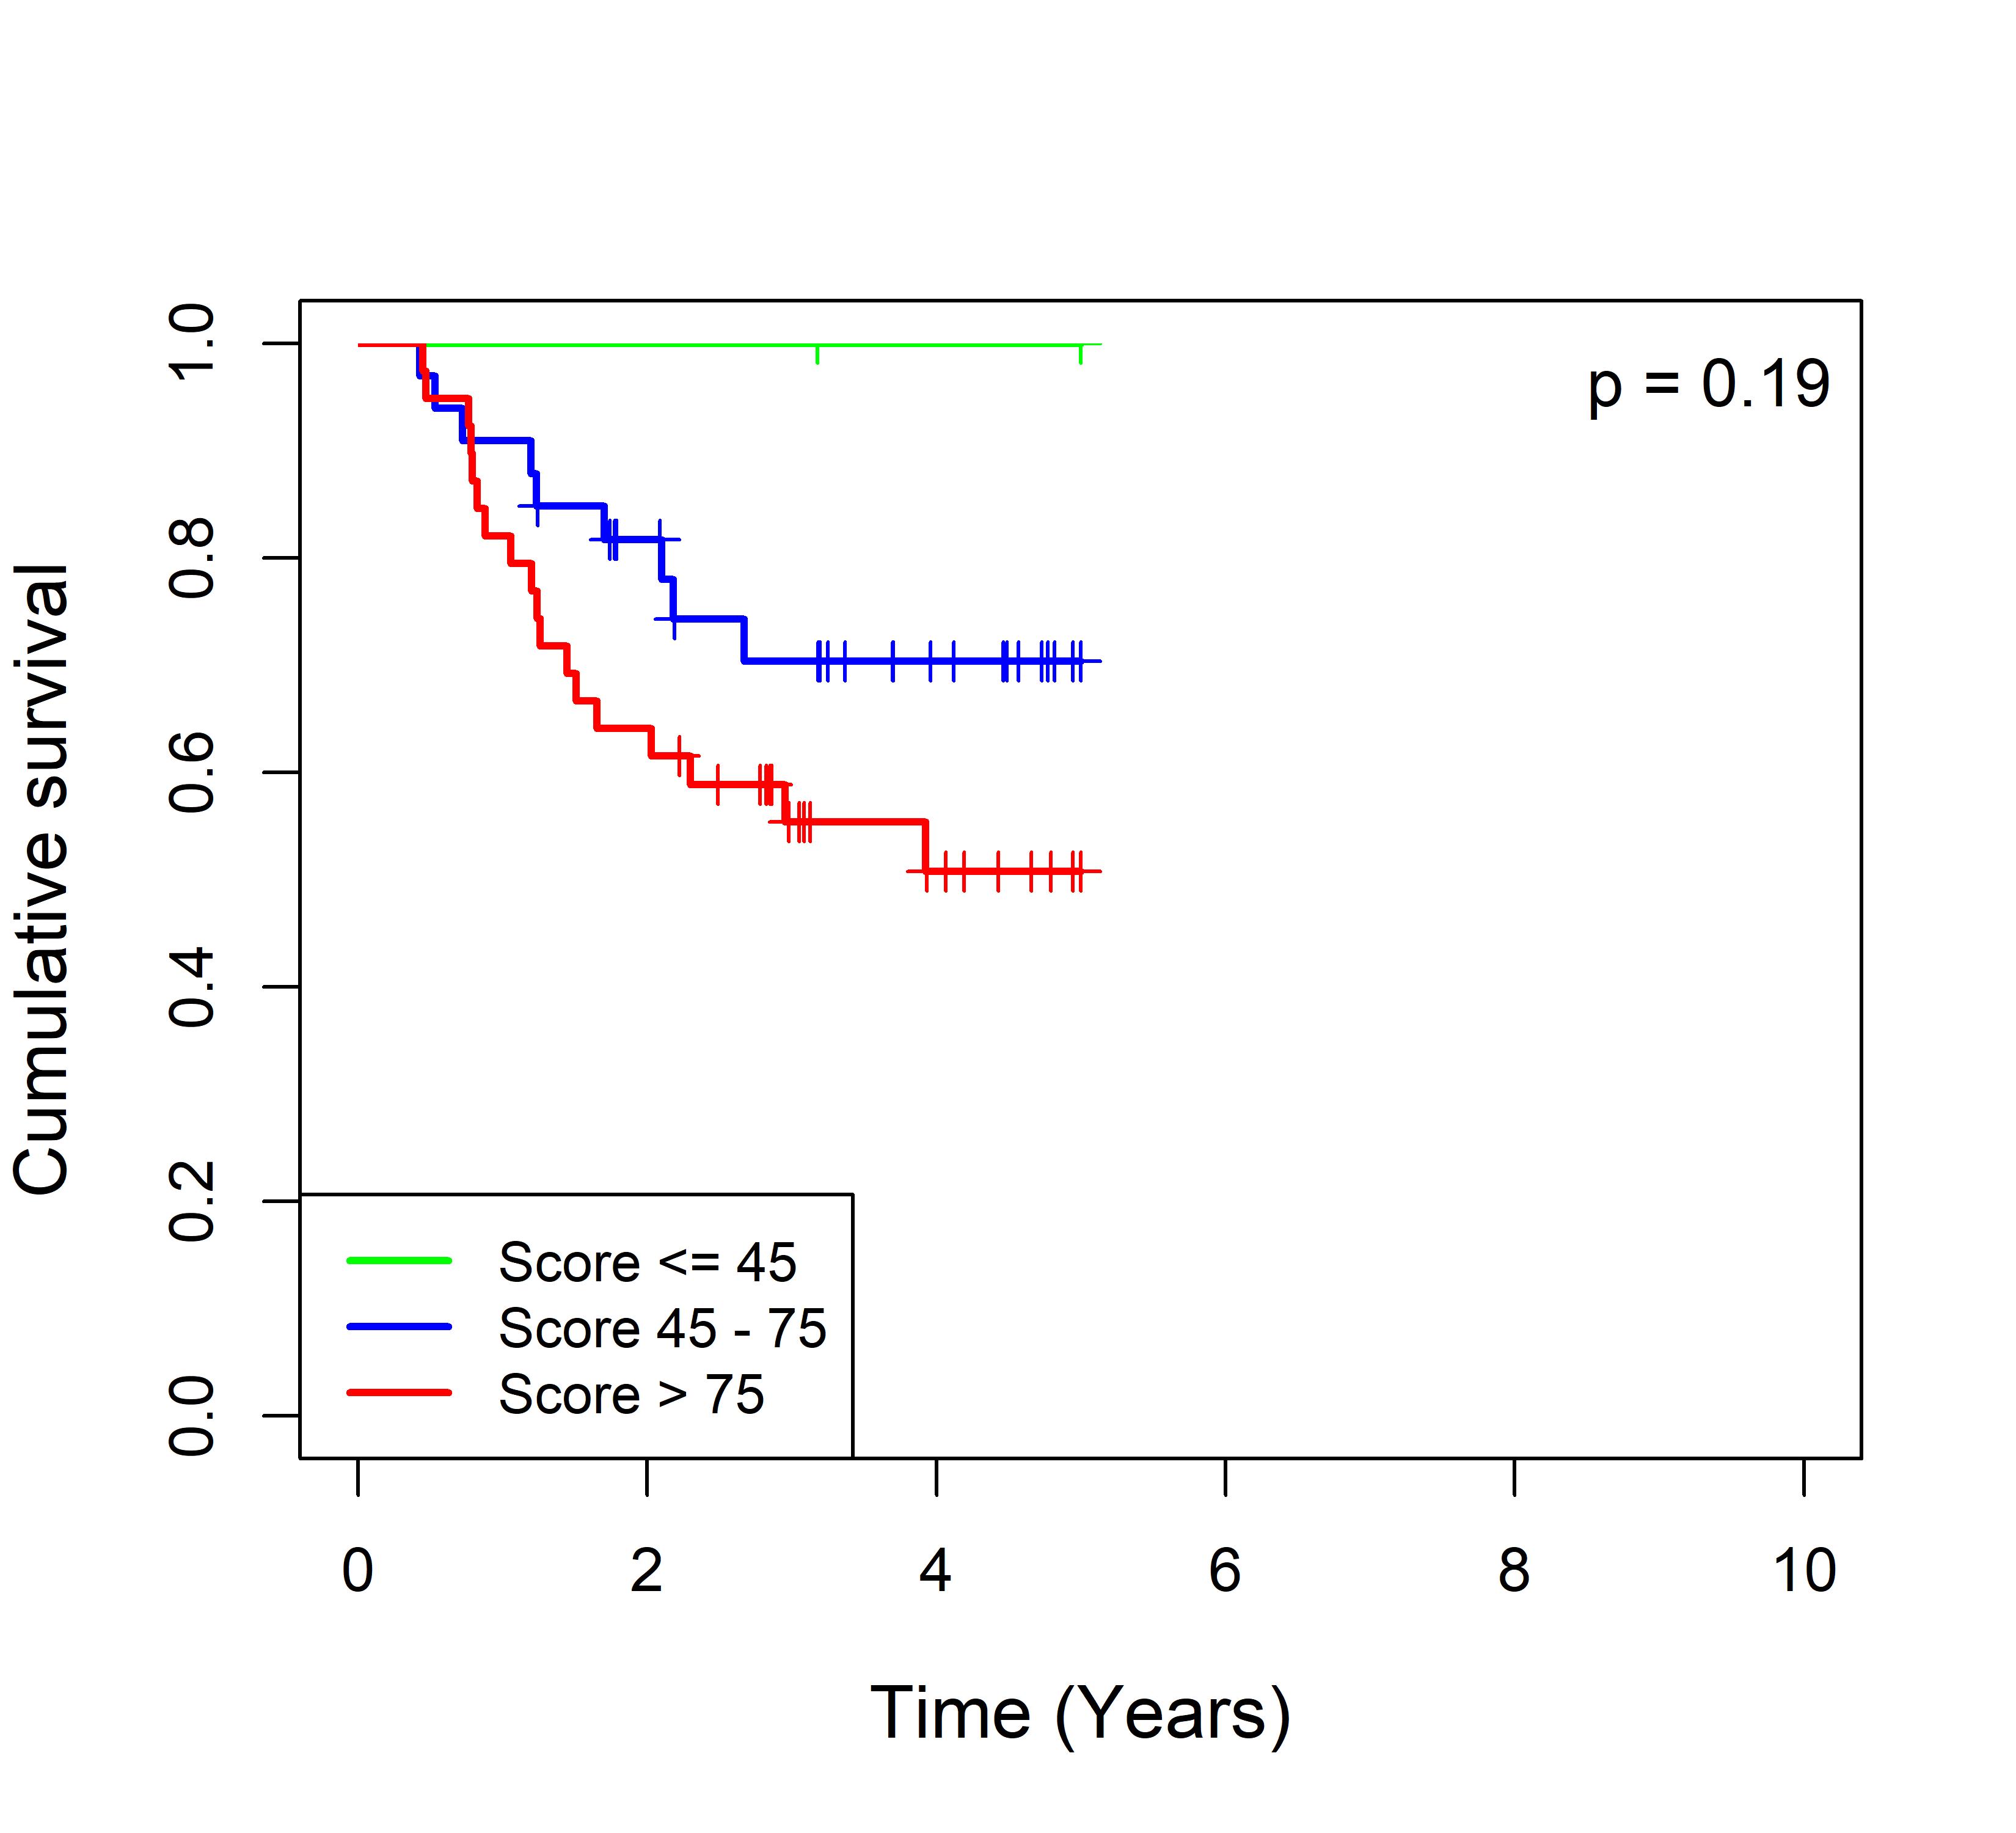
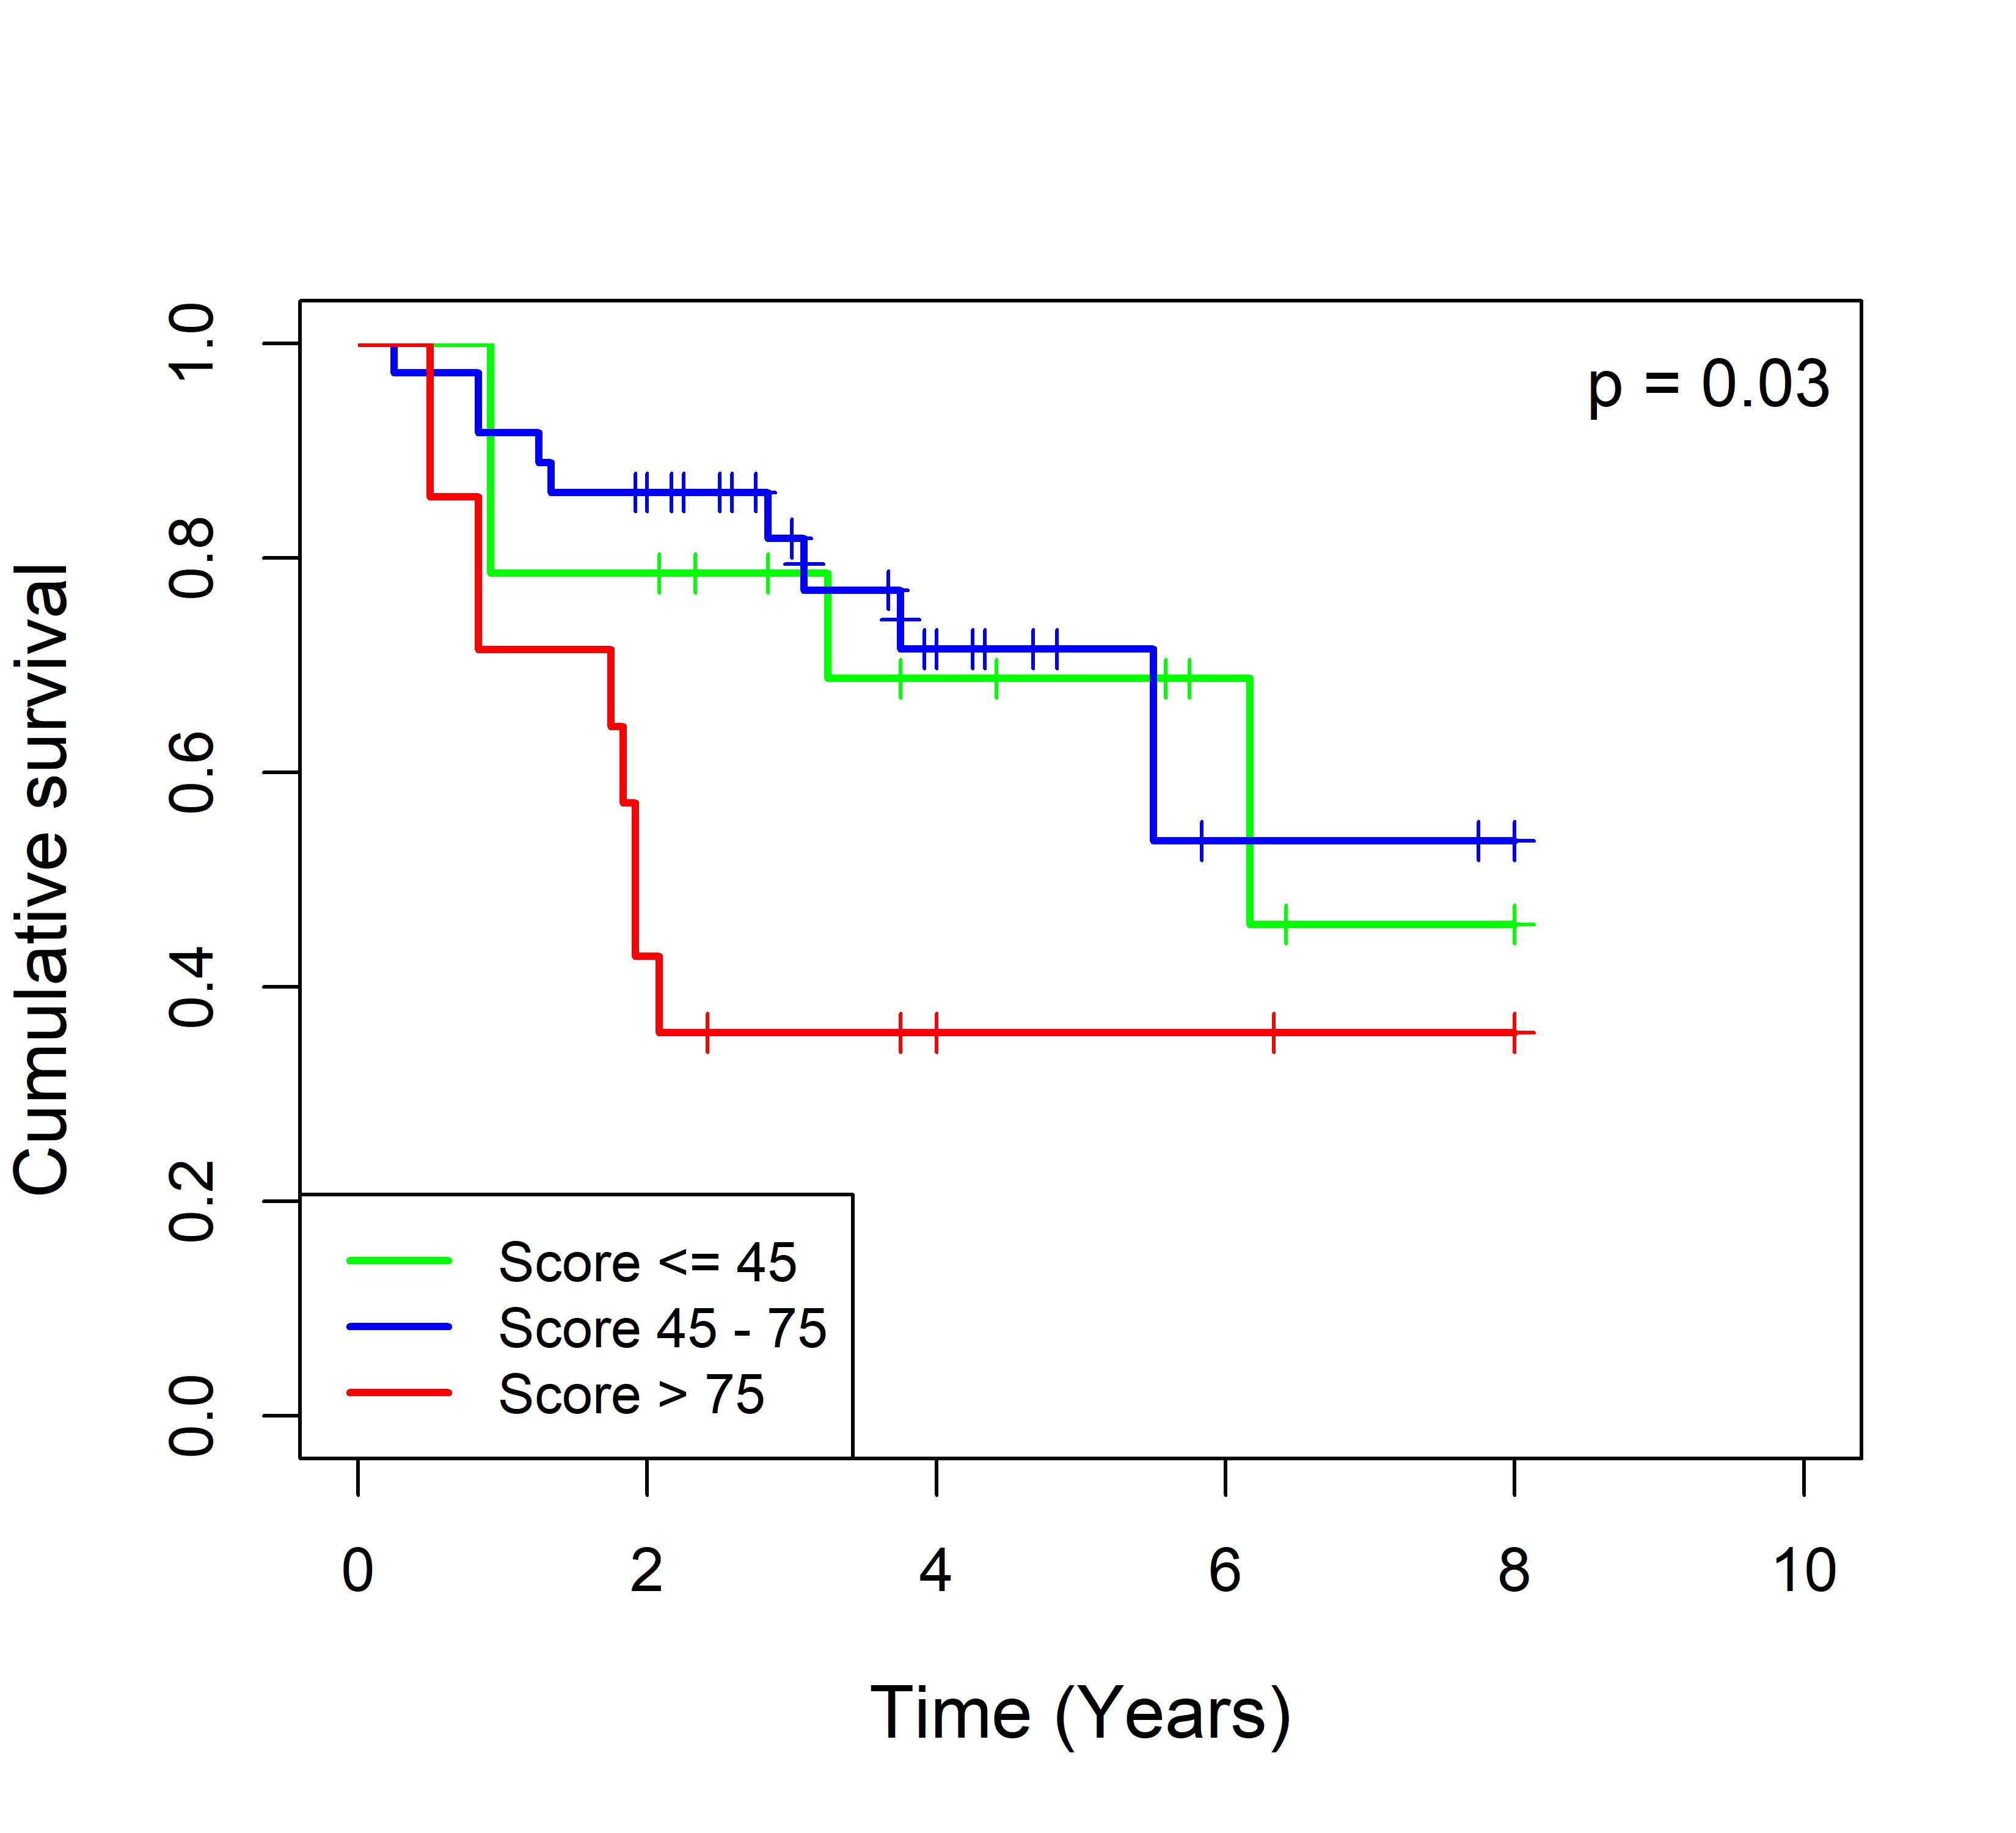
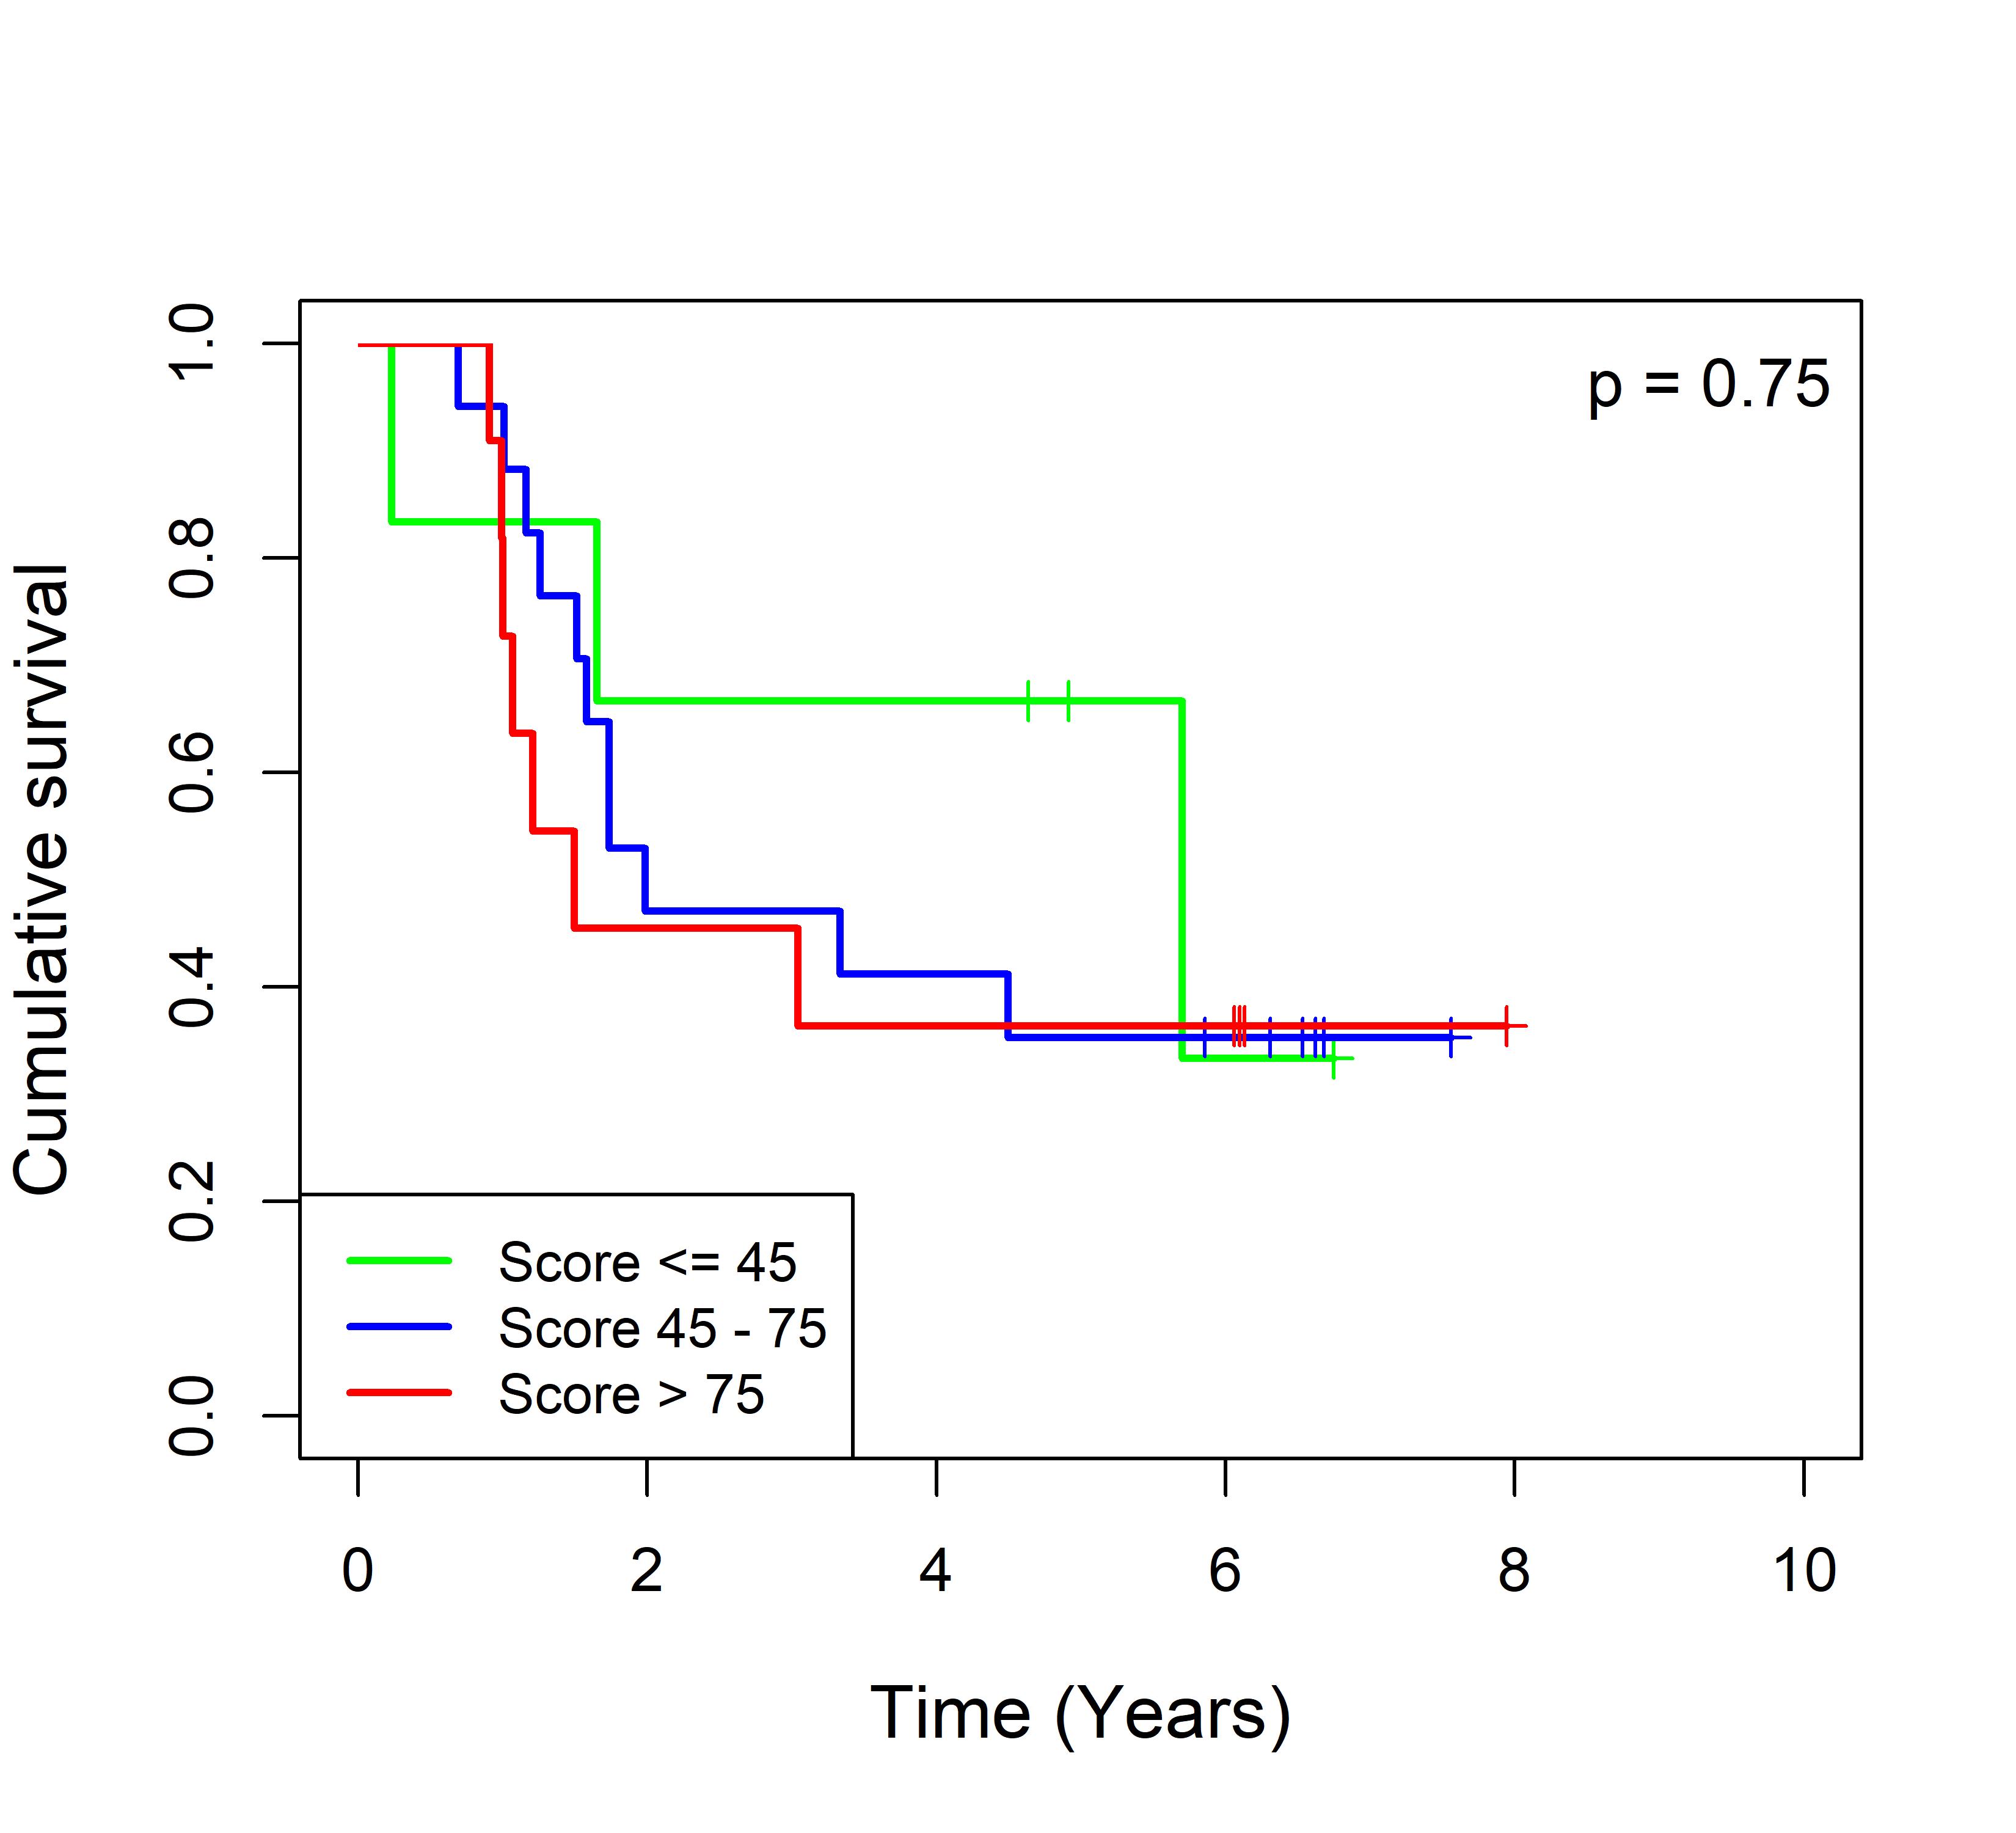
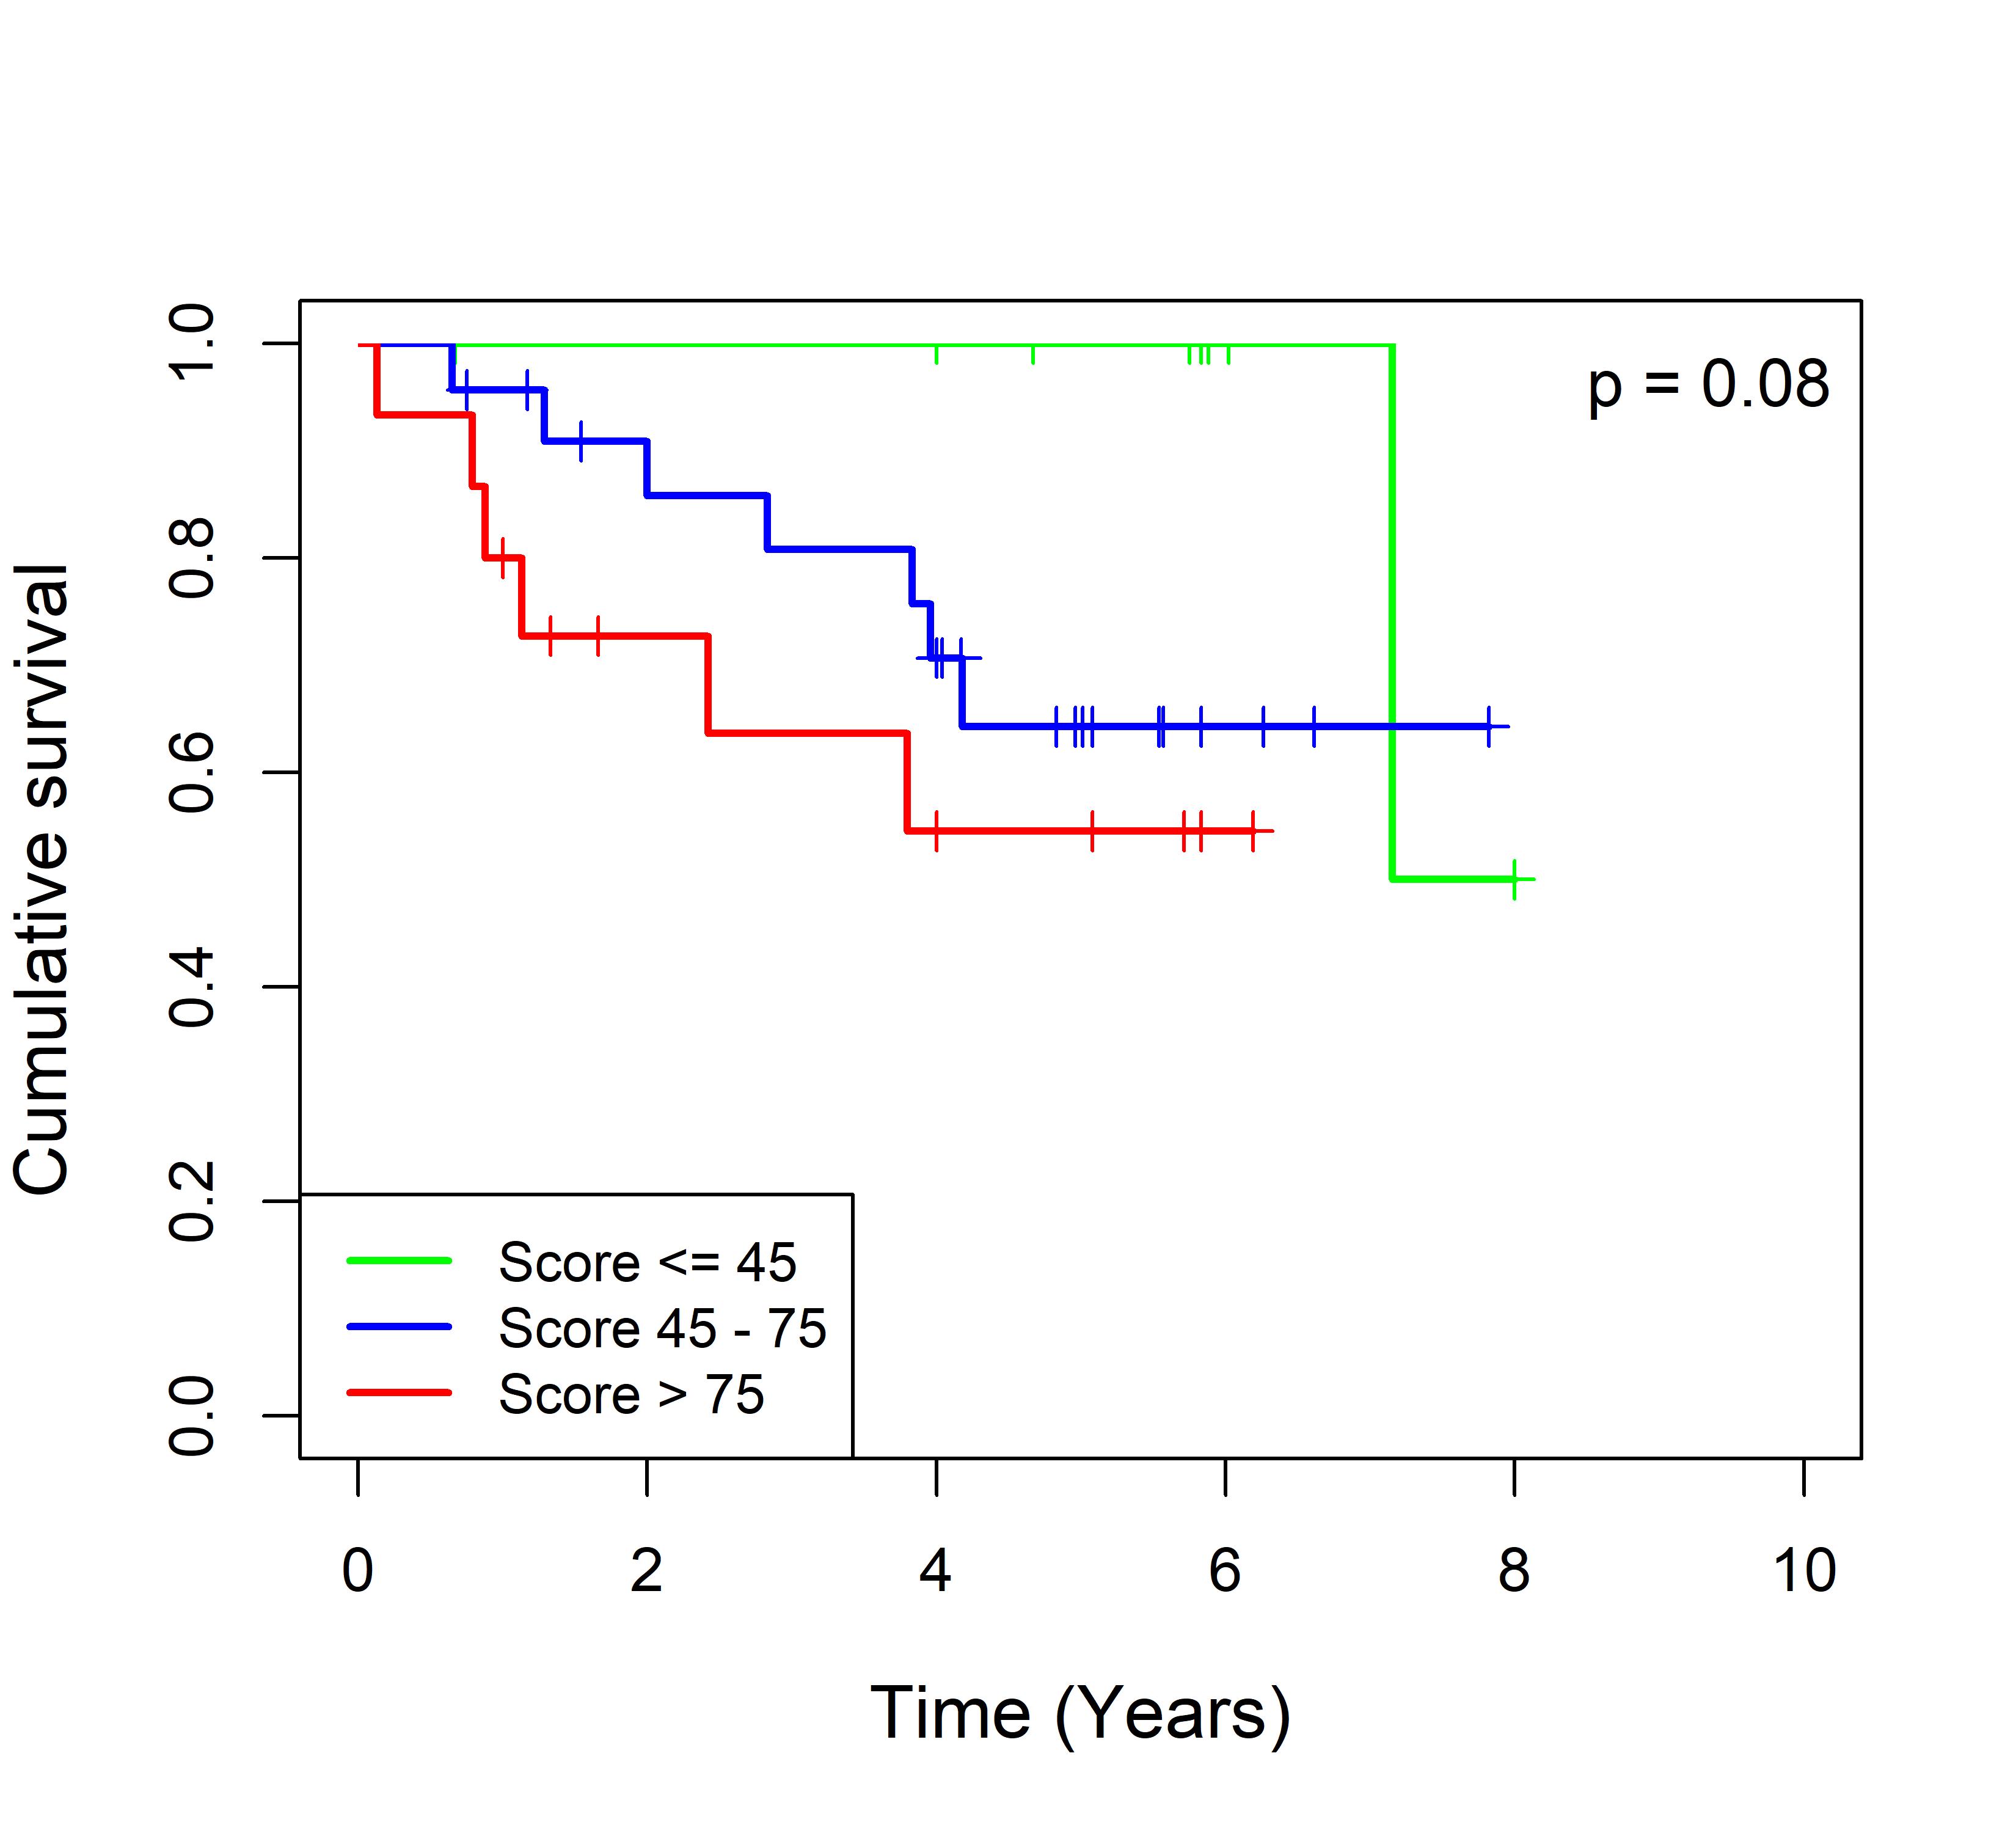
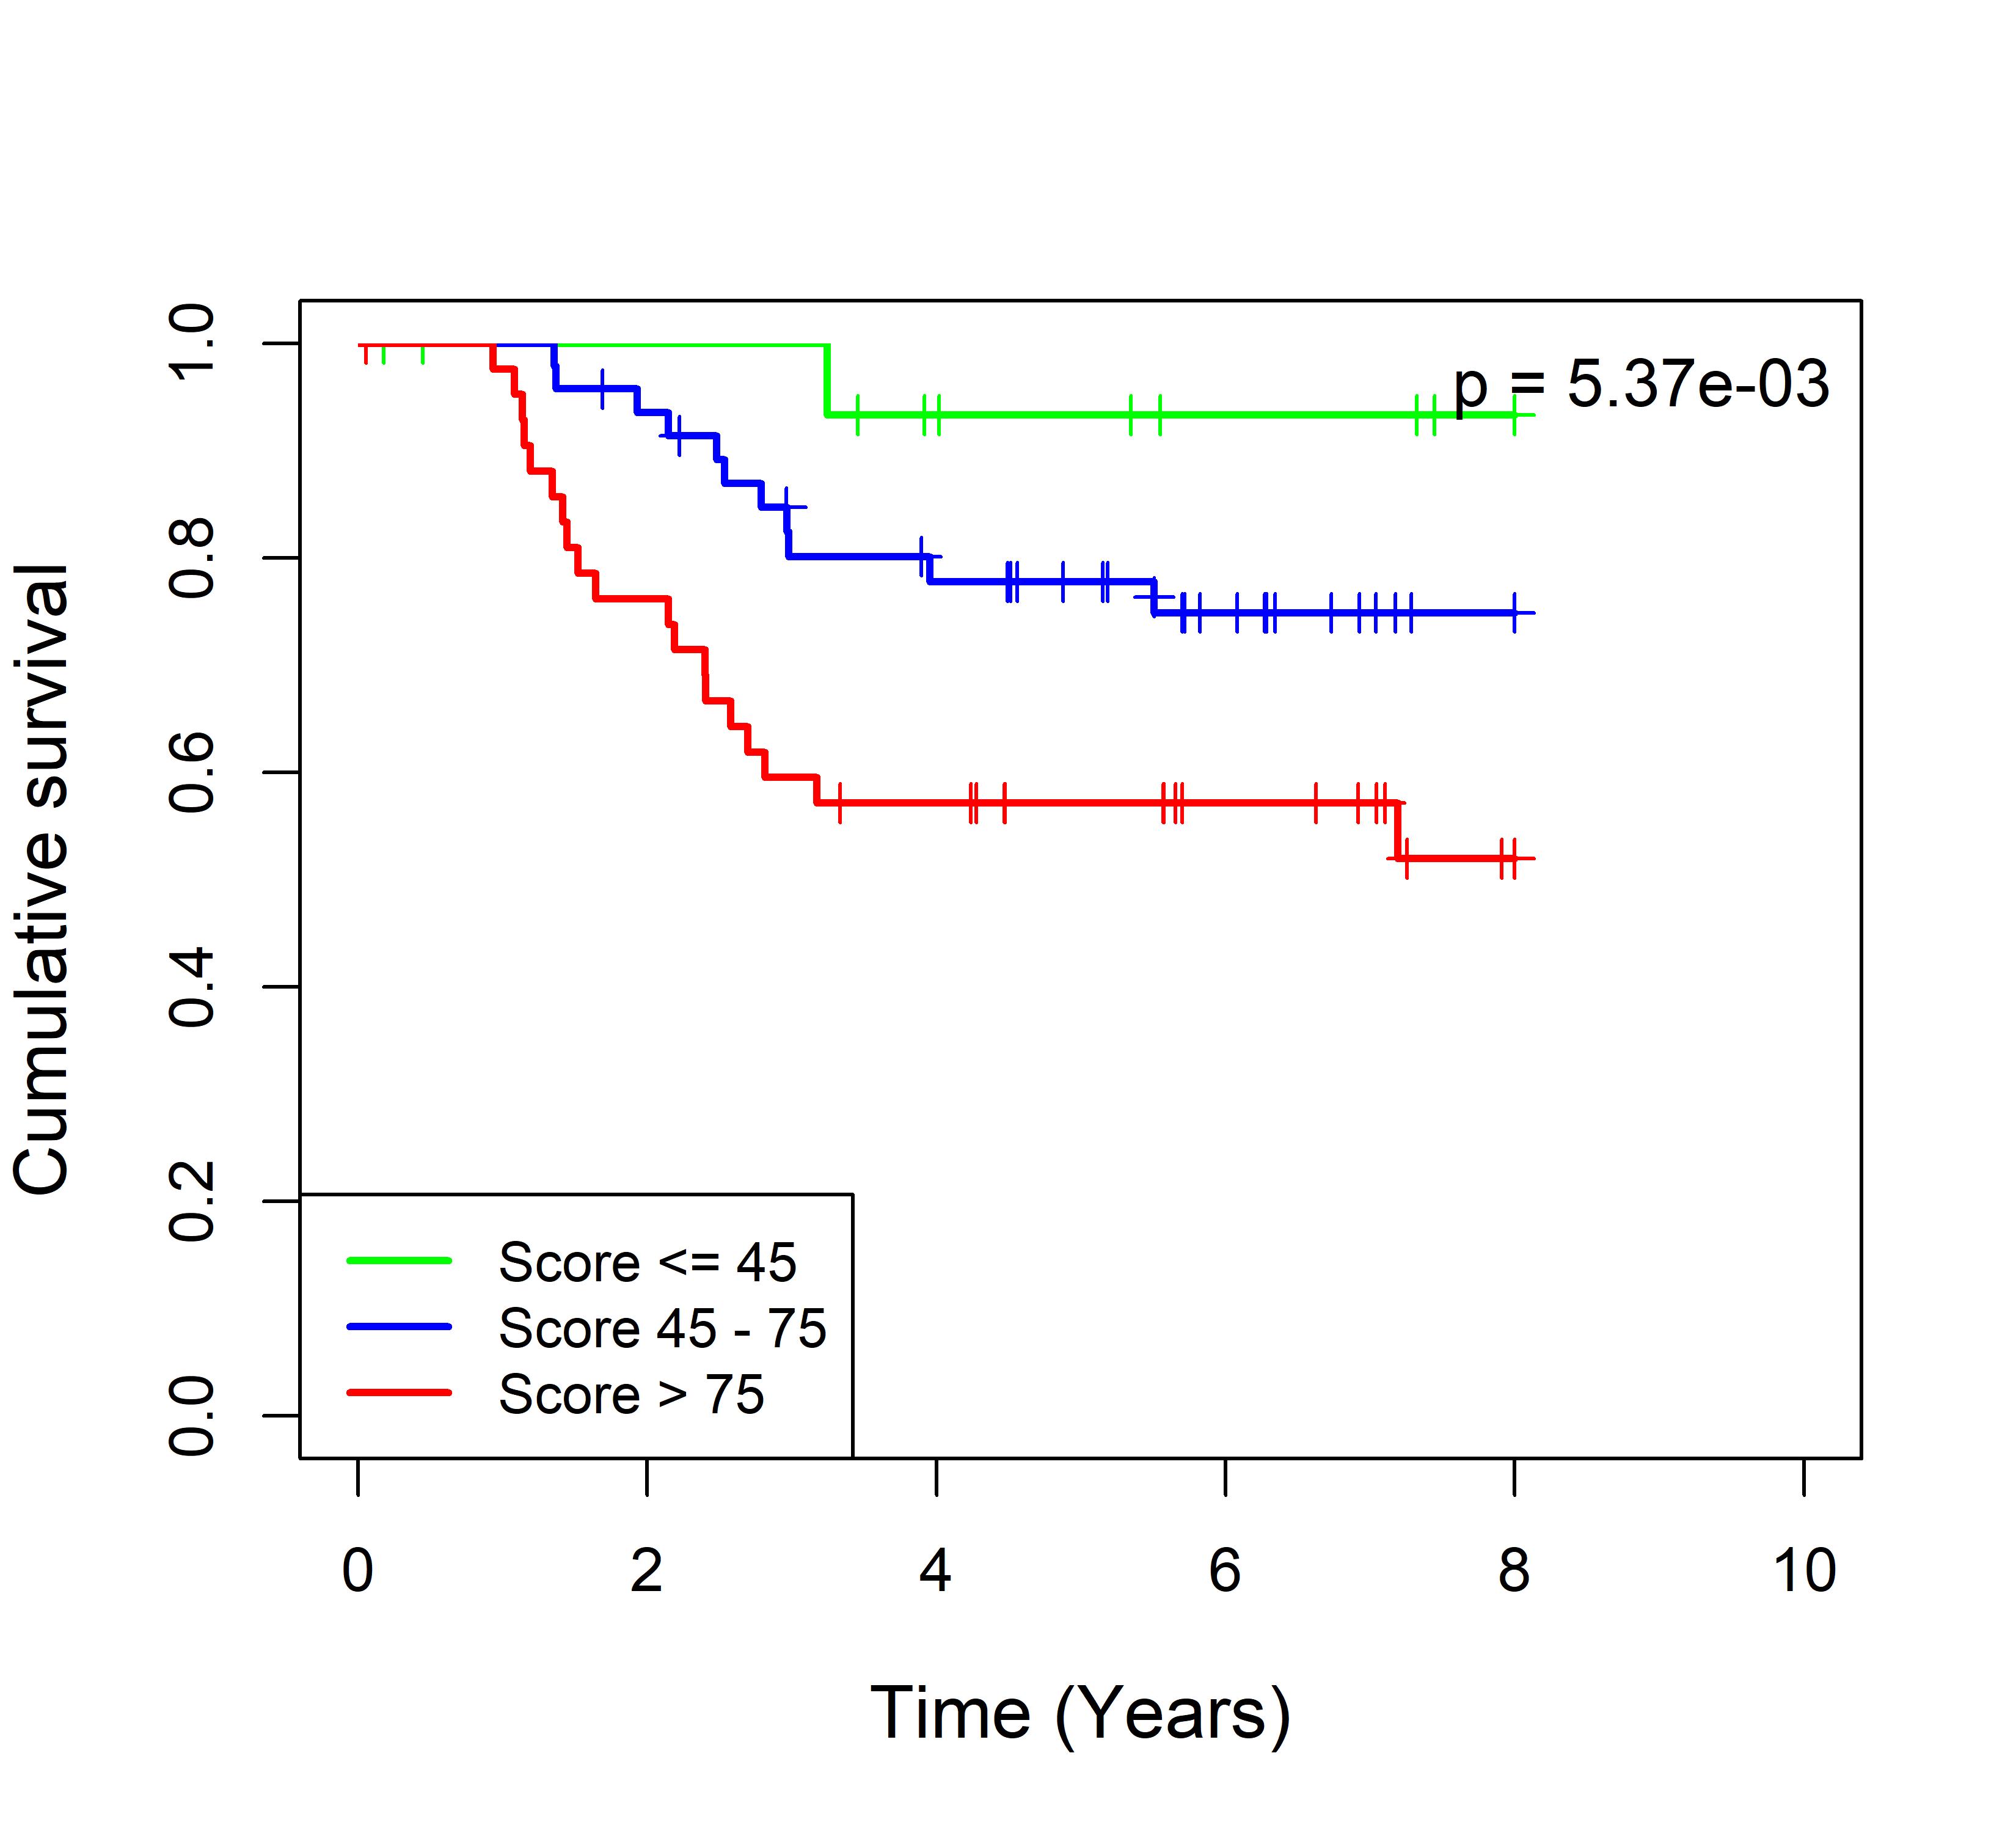
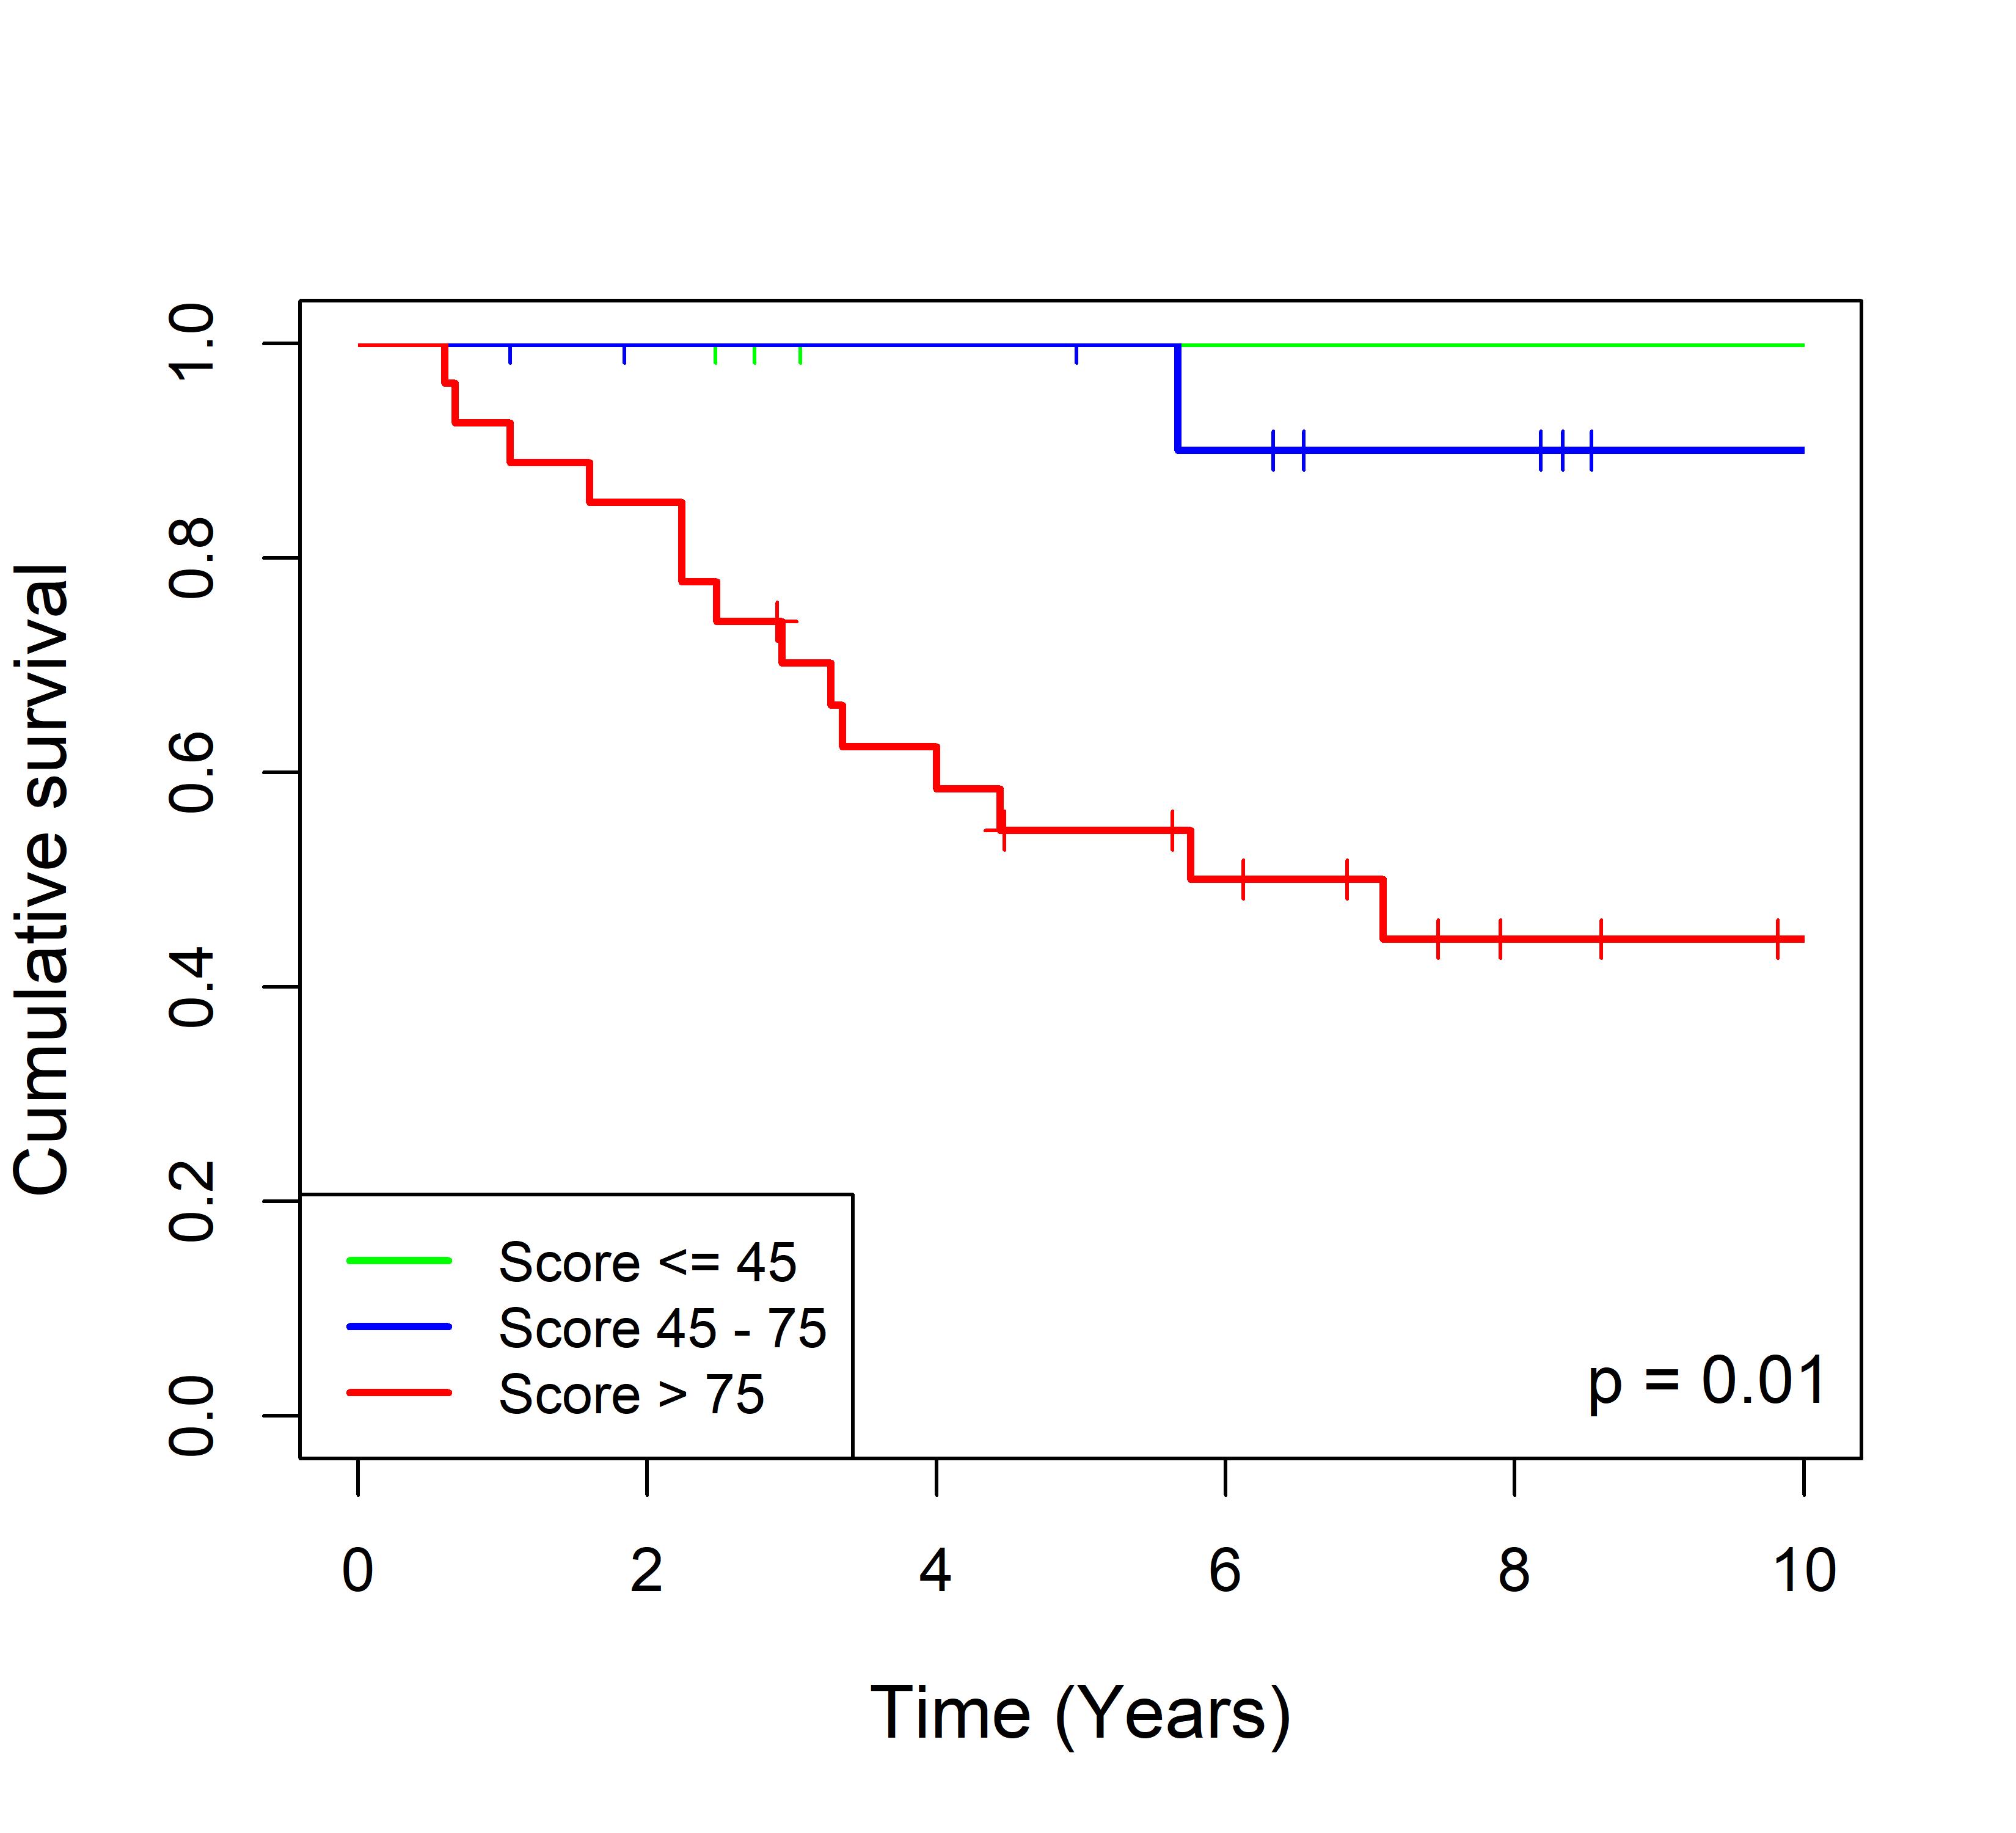
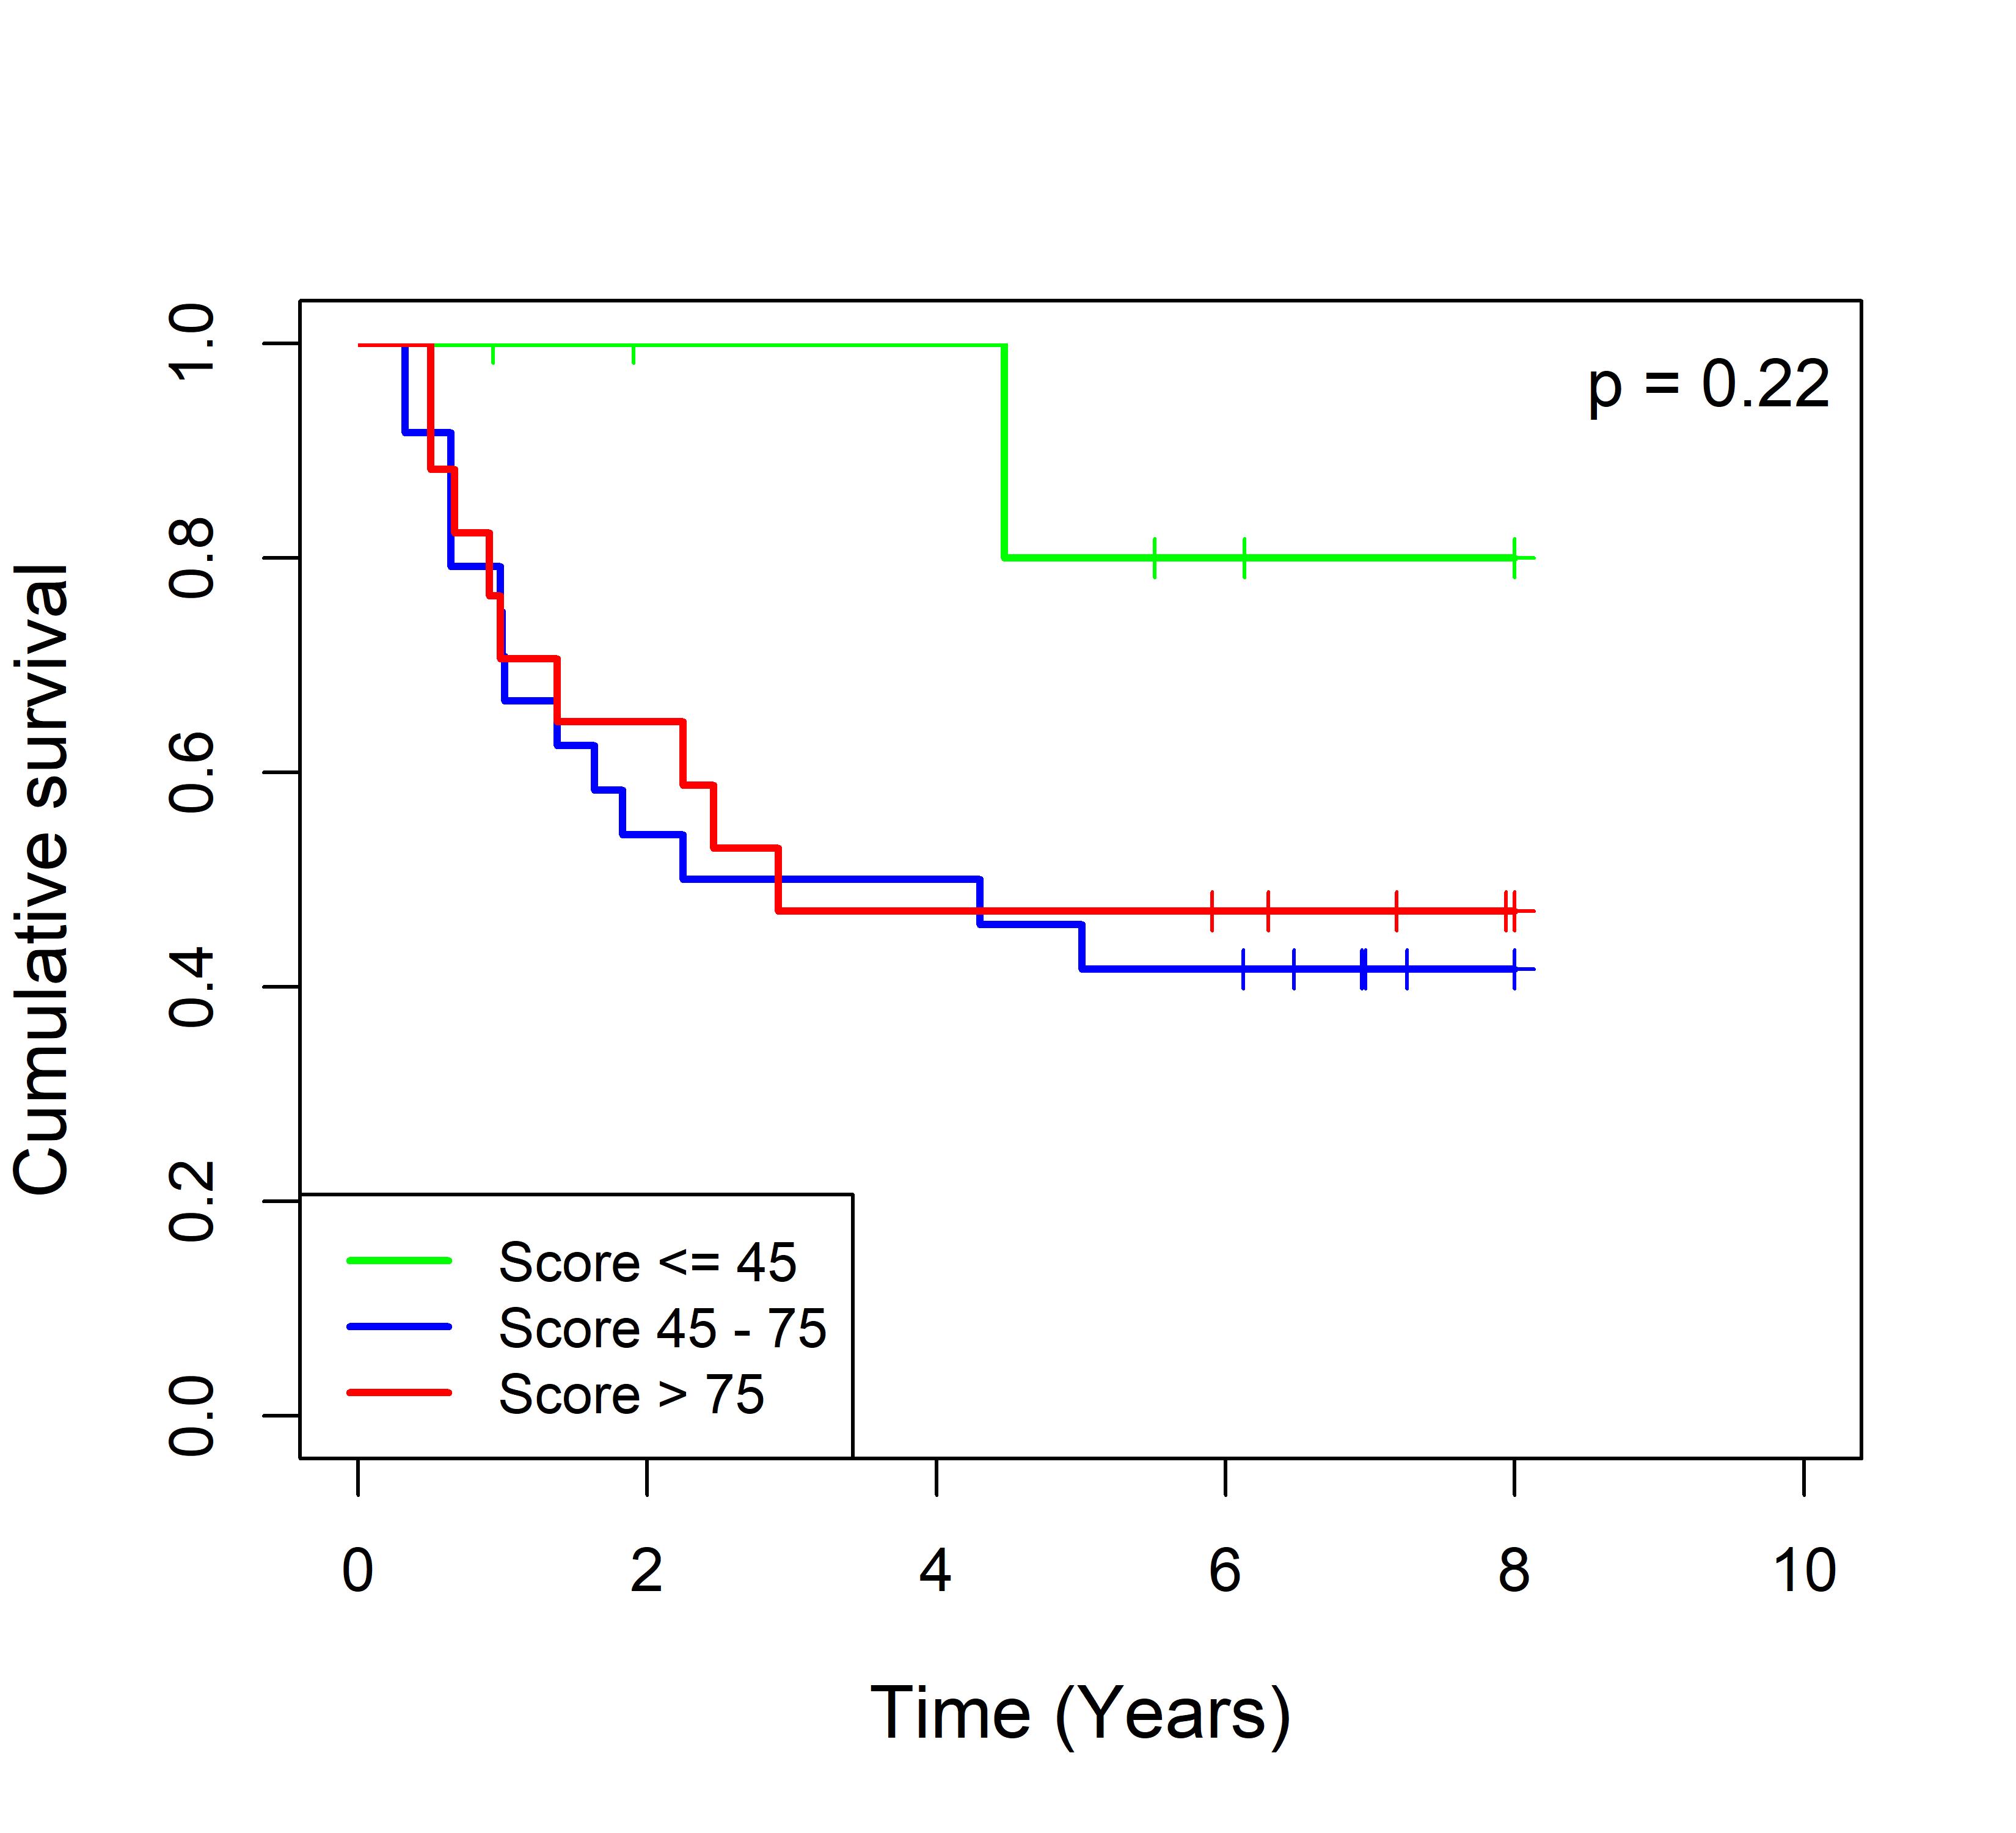
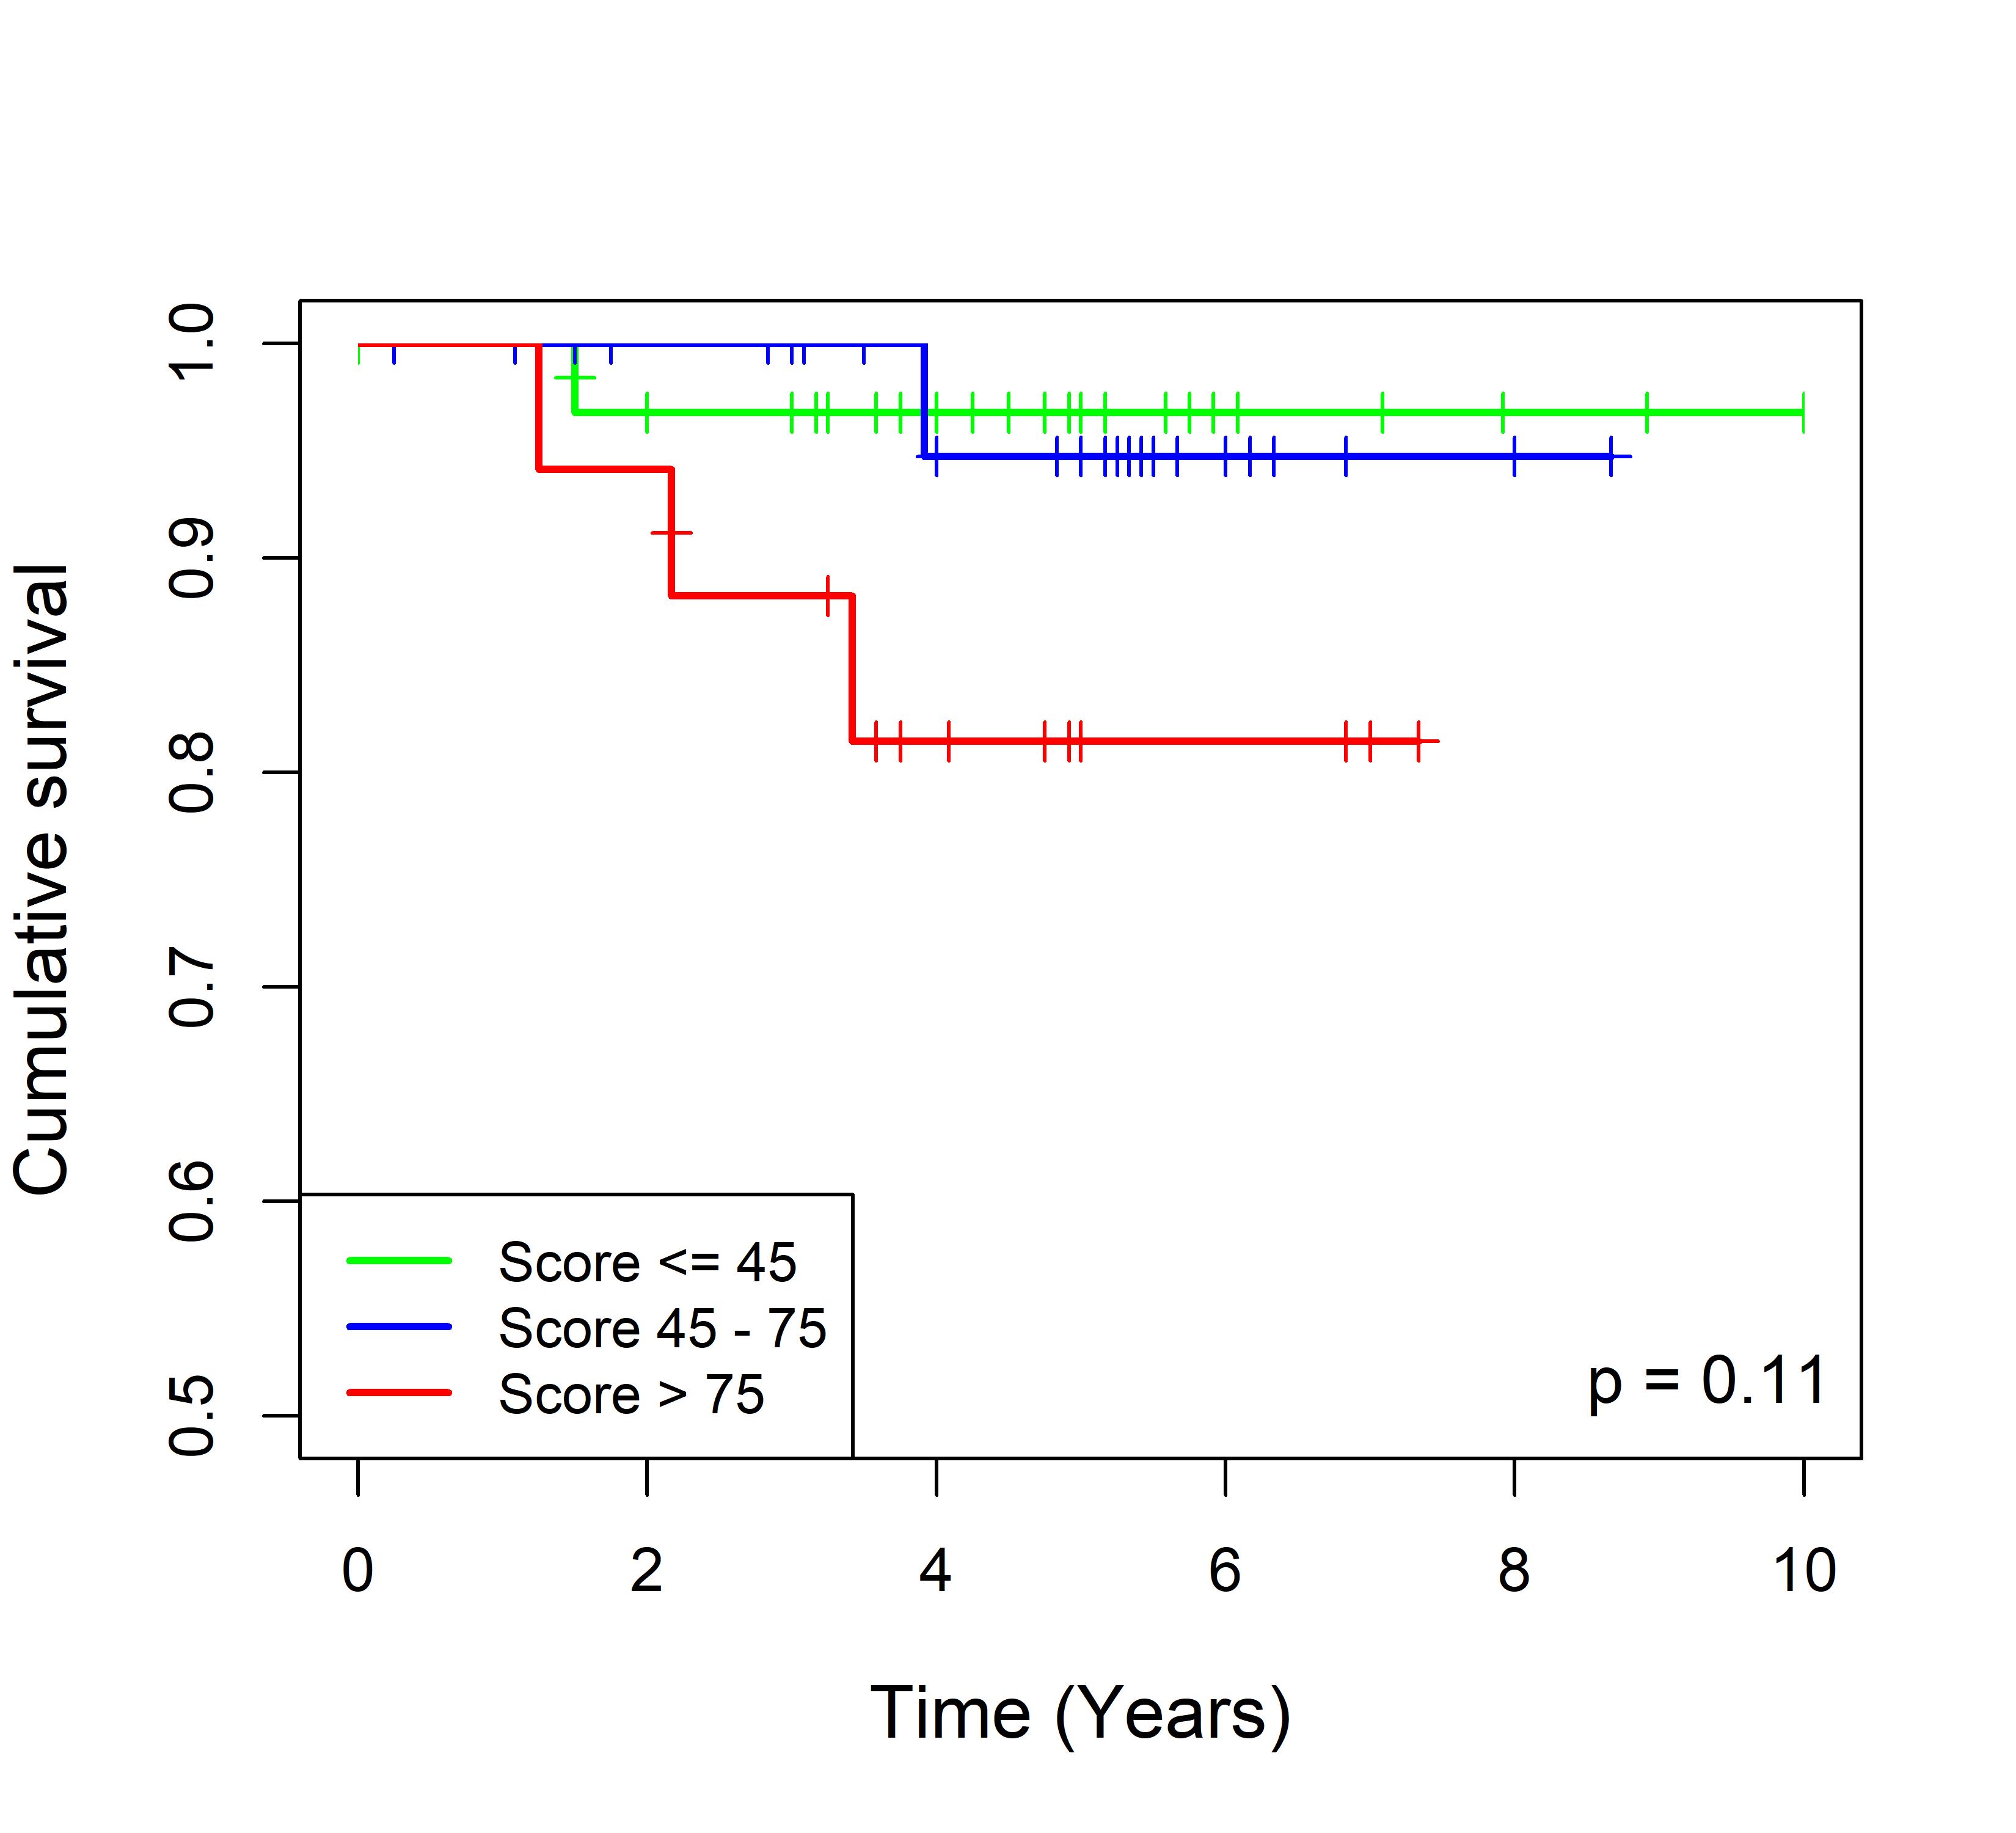
Fig. 2. Association between the Blue_panBC signature score and patient survival in ER-negative breast cancer across 22 TMO-based cohorts. Each Kaplan-Meier plot represents the analysis of a single, independent cohort. We developed an algorithm to calculate absolute Blue_panBC score signature scores independently of cohort-wide data. This enables direct comparison of scores across TMO arrays and allows for the calculation of signature scores for newly added individual samples. All samples were stratified into three groups based on their signature scores: low (≤45), medium (45–75), and high (>75). The cumulative survival rates were then compared among these groups. Data for the 27 non-TMO-based breast cancer cohorts is presented in Fig.3.