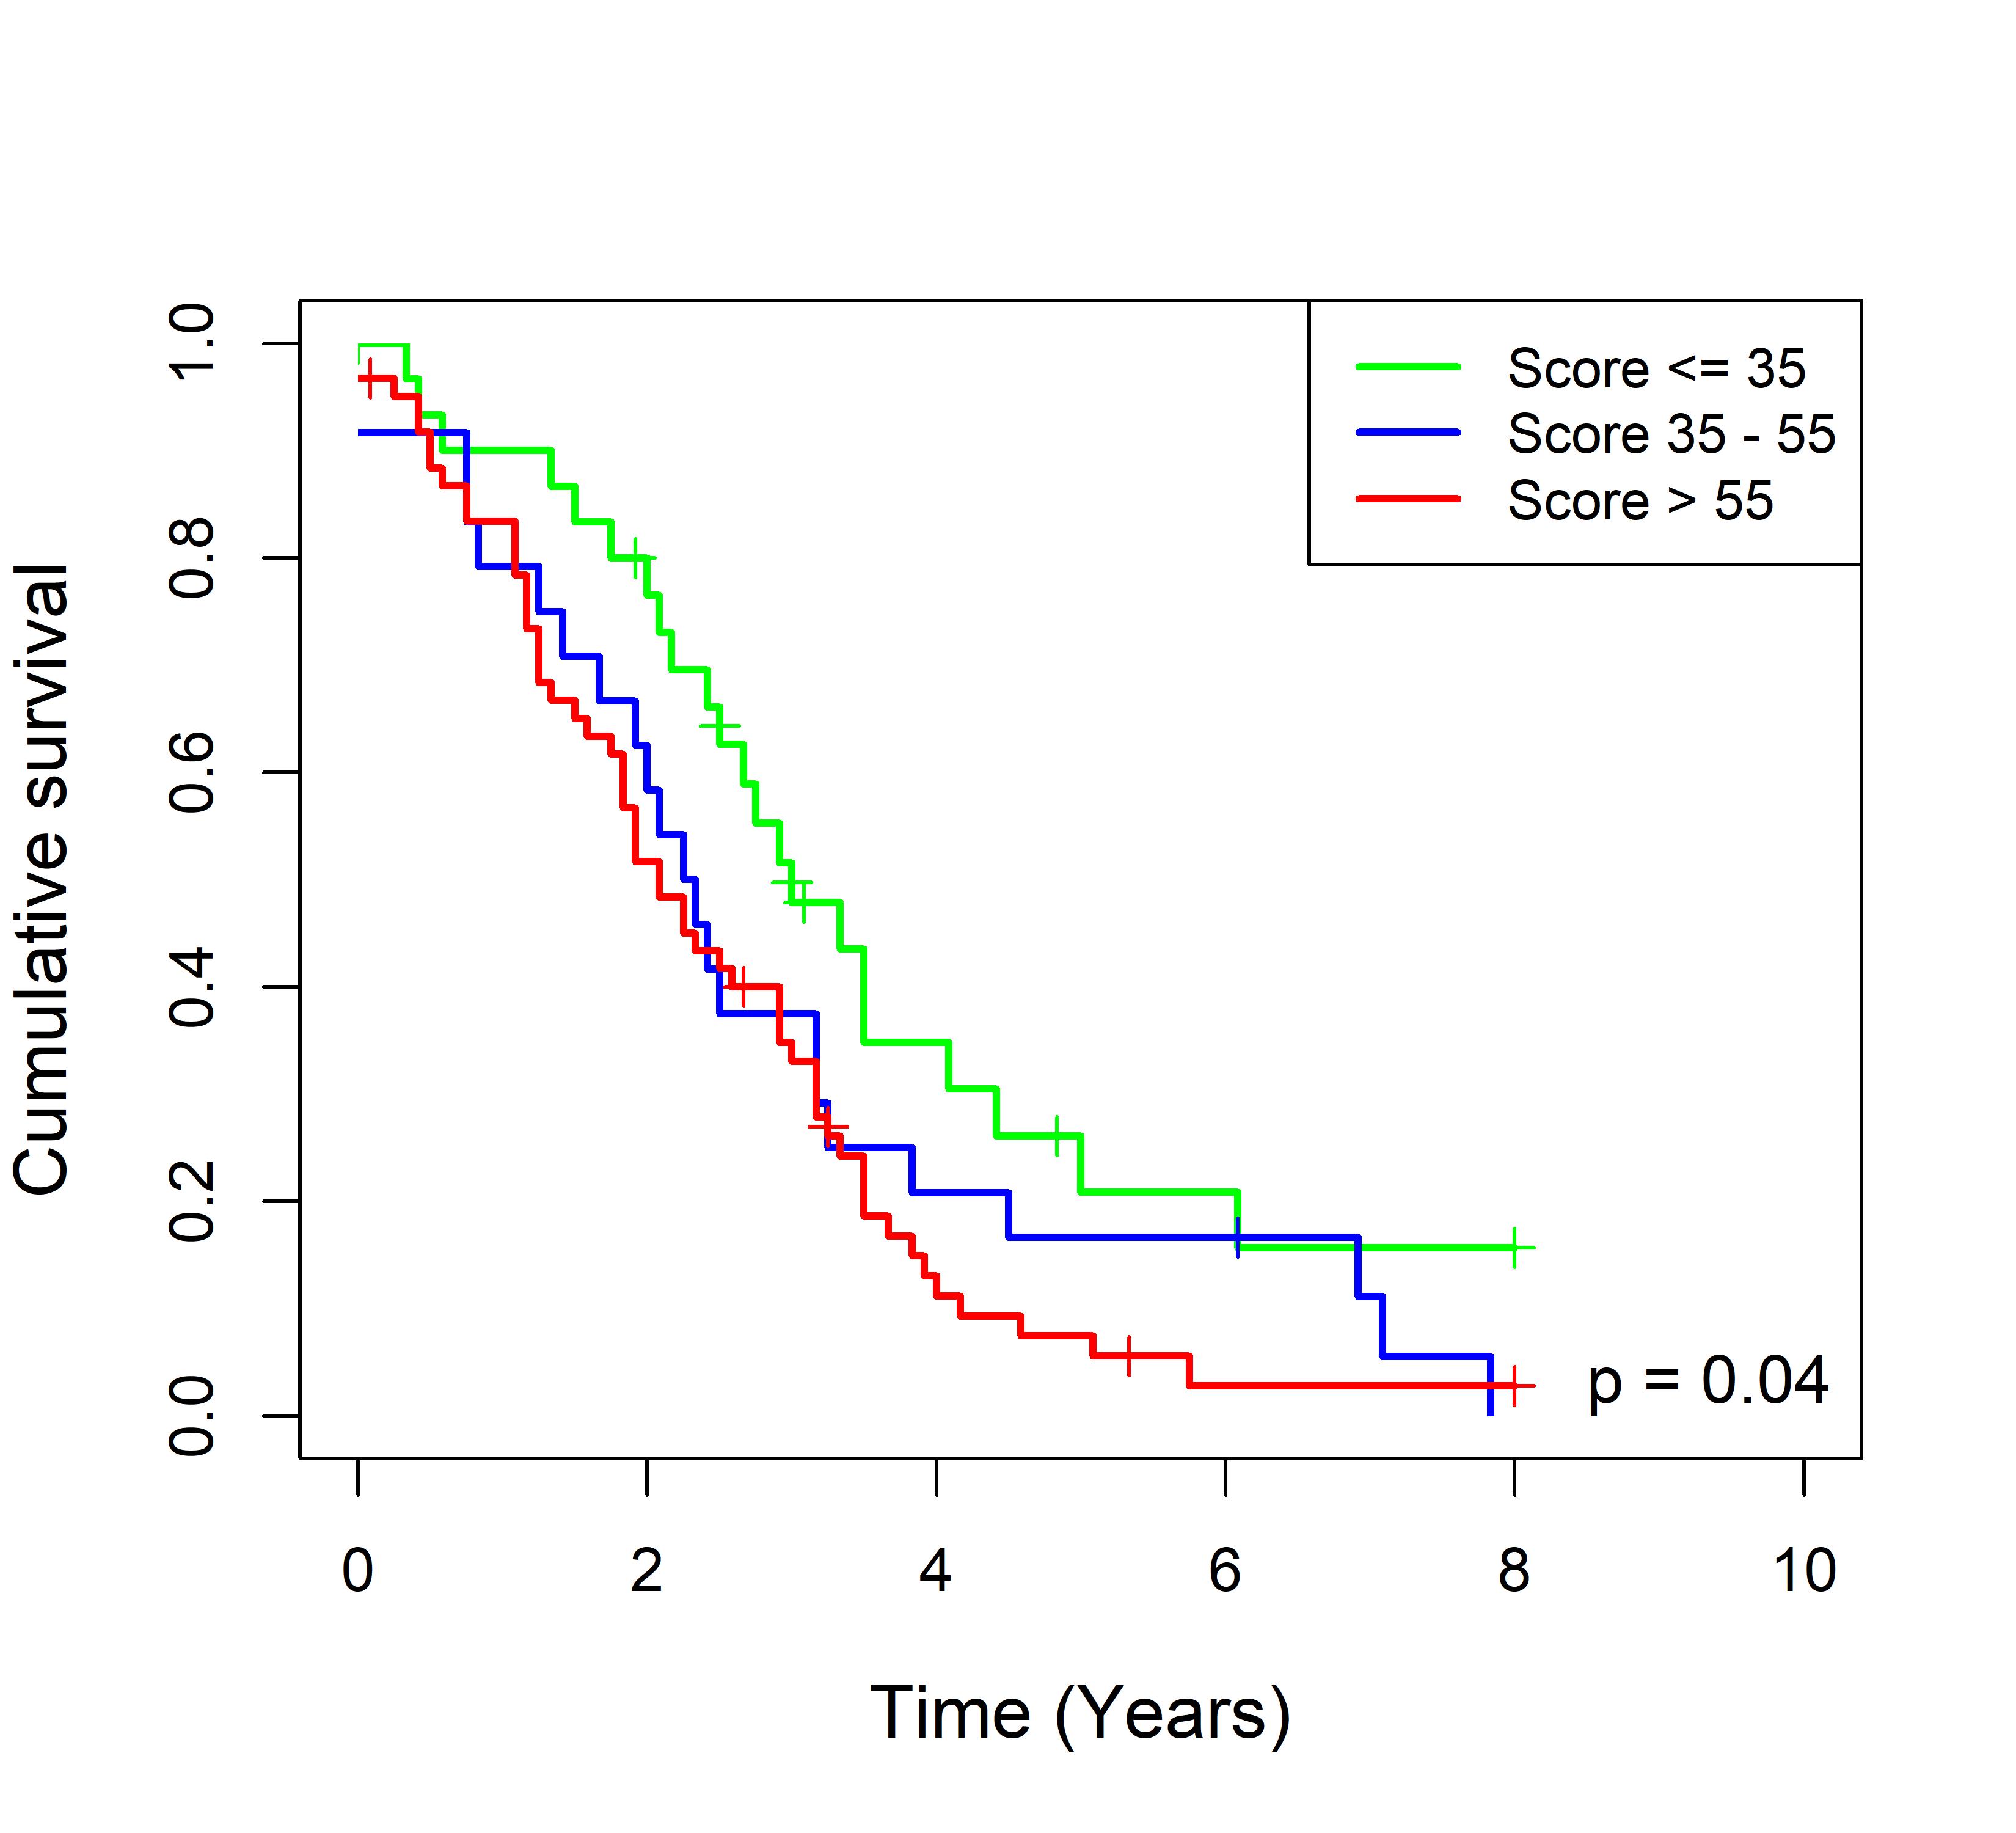
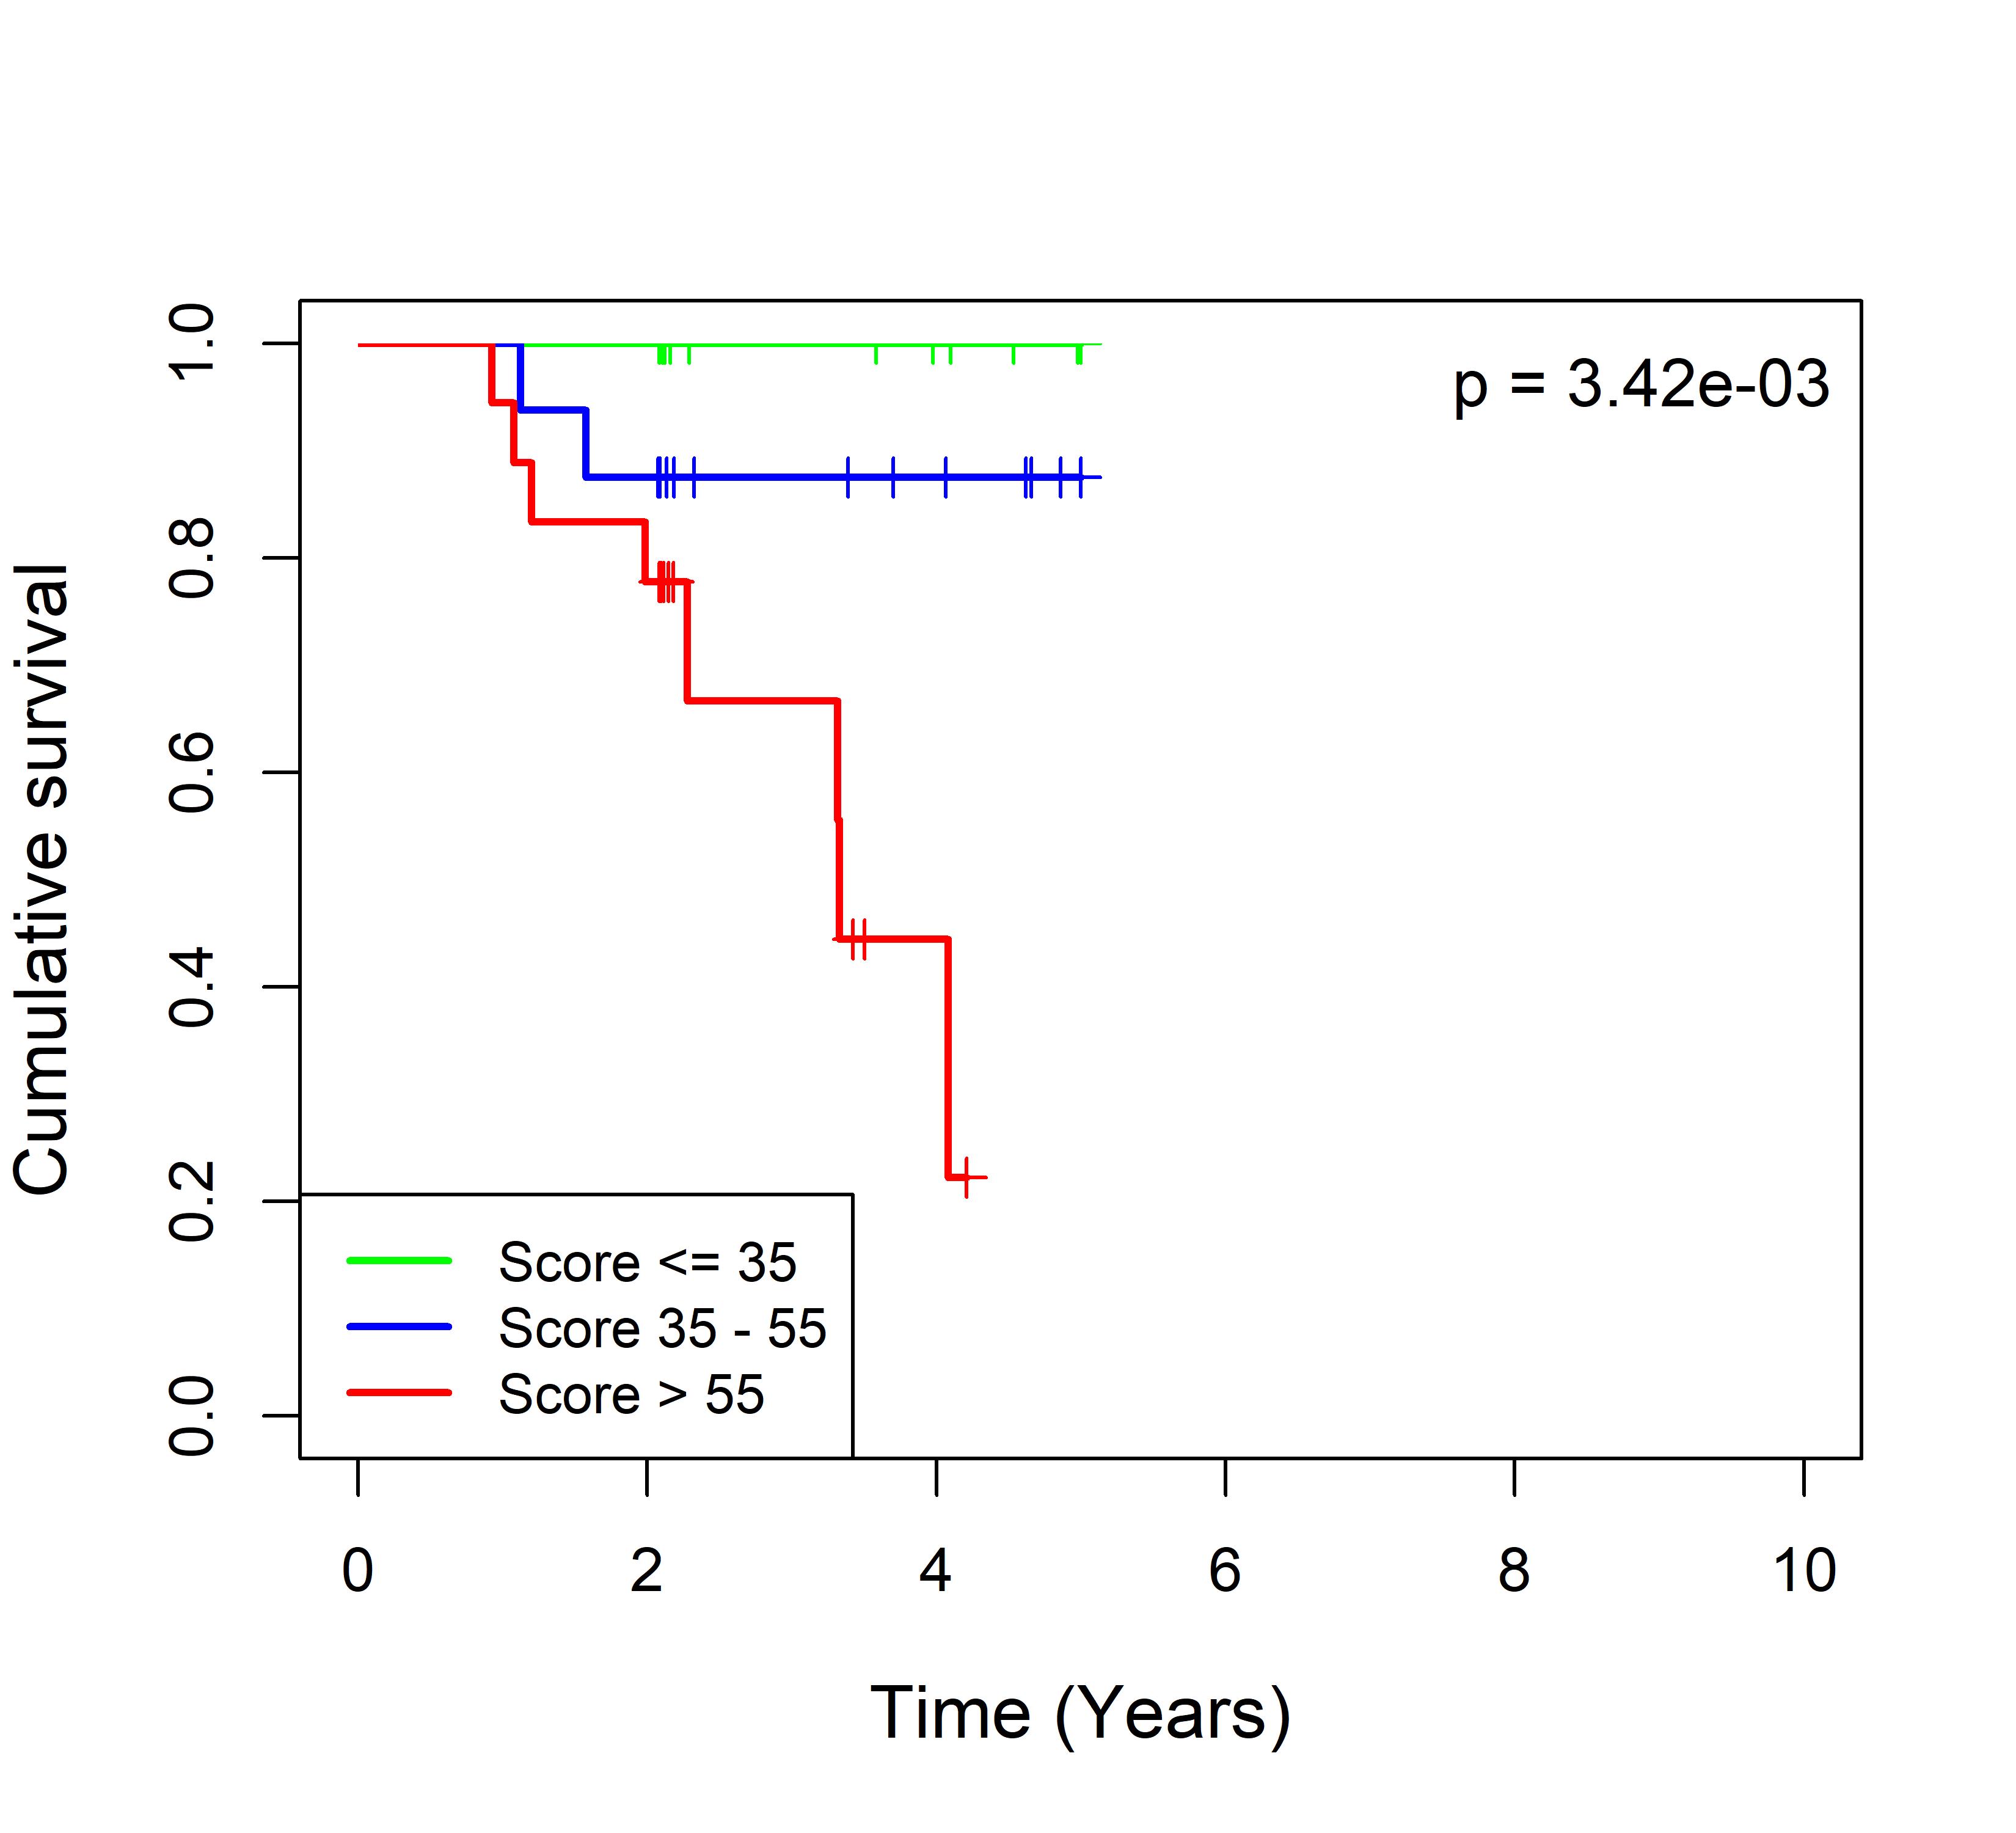
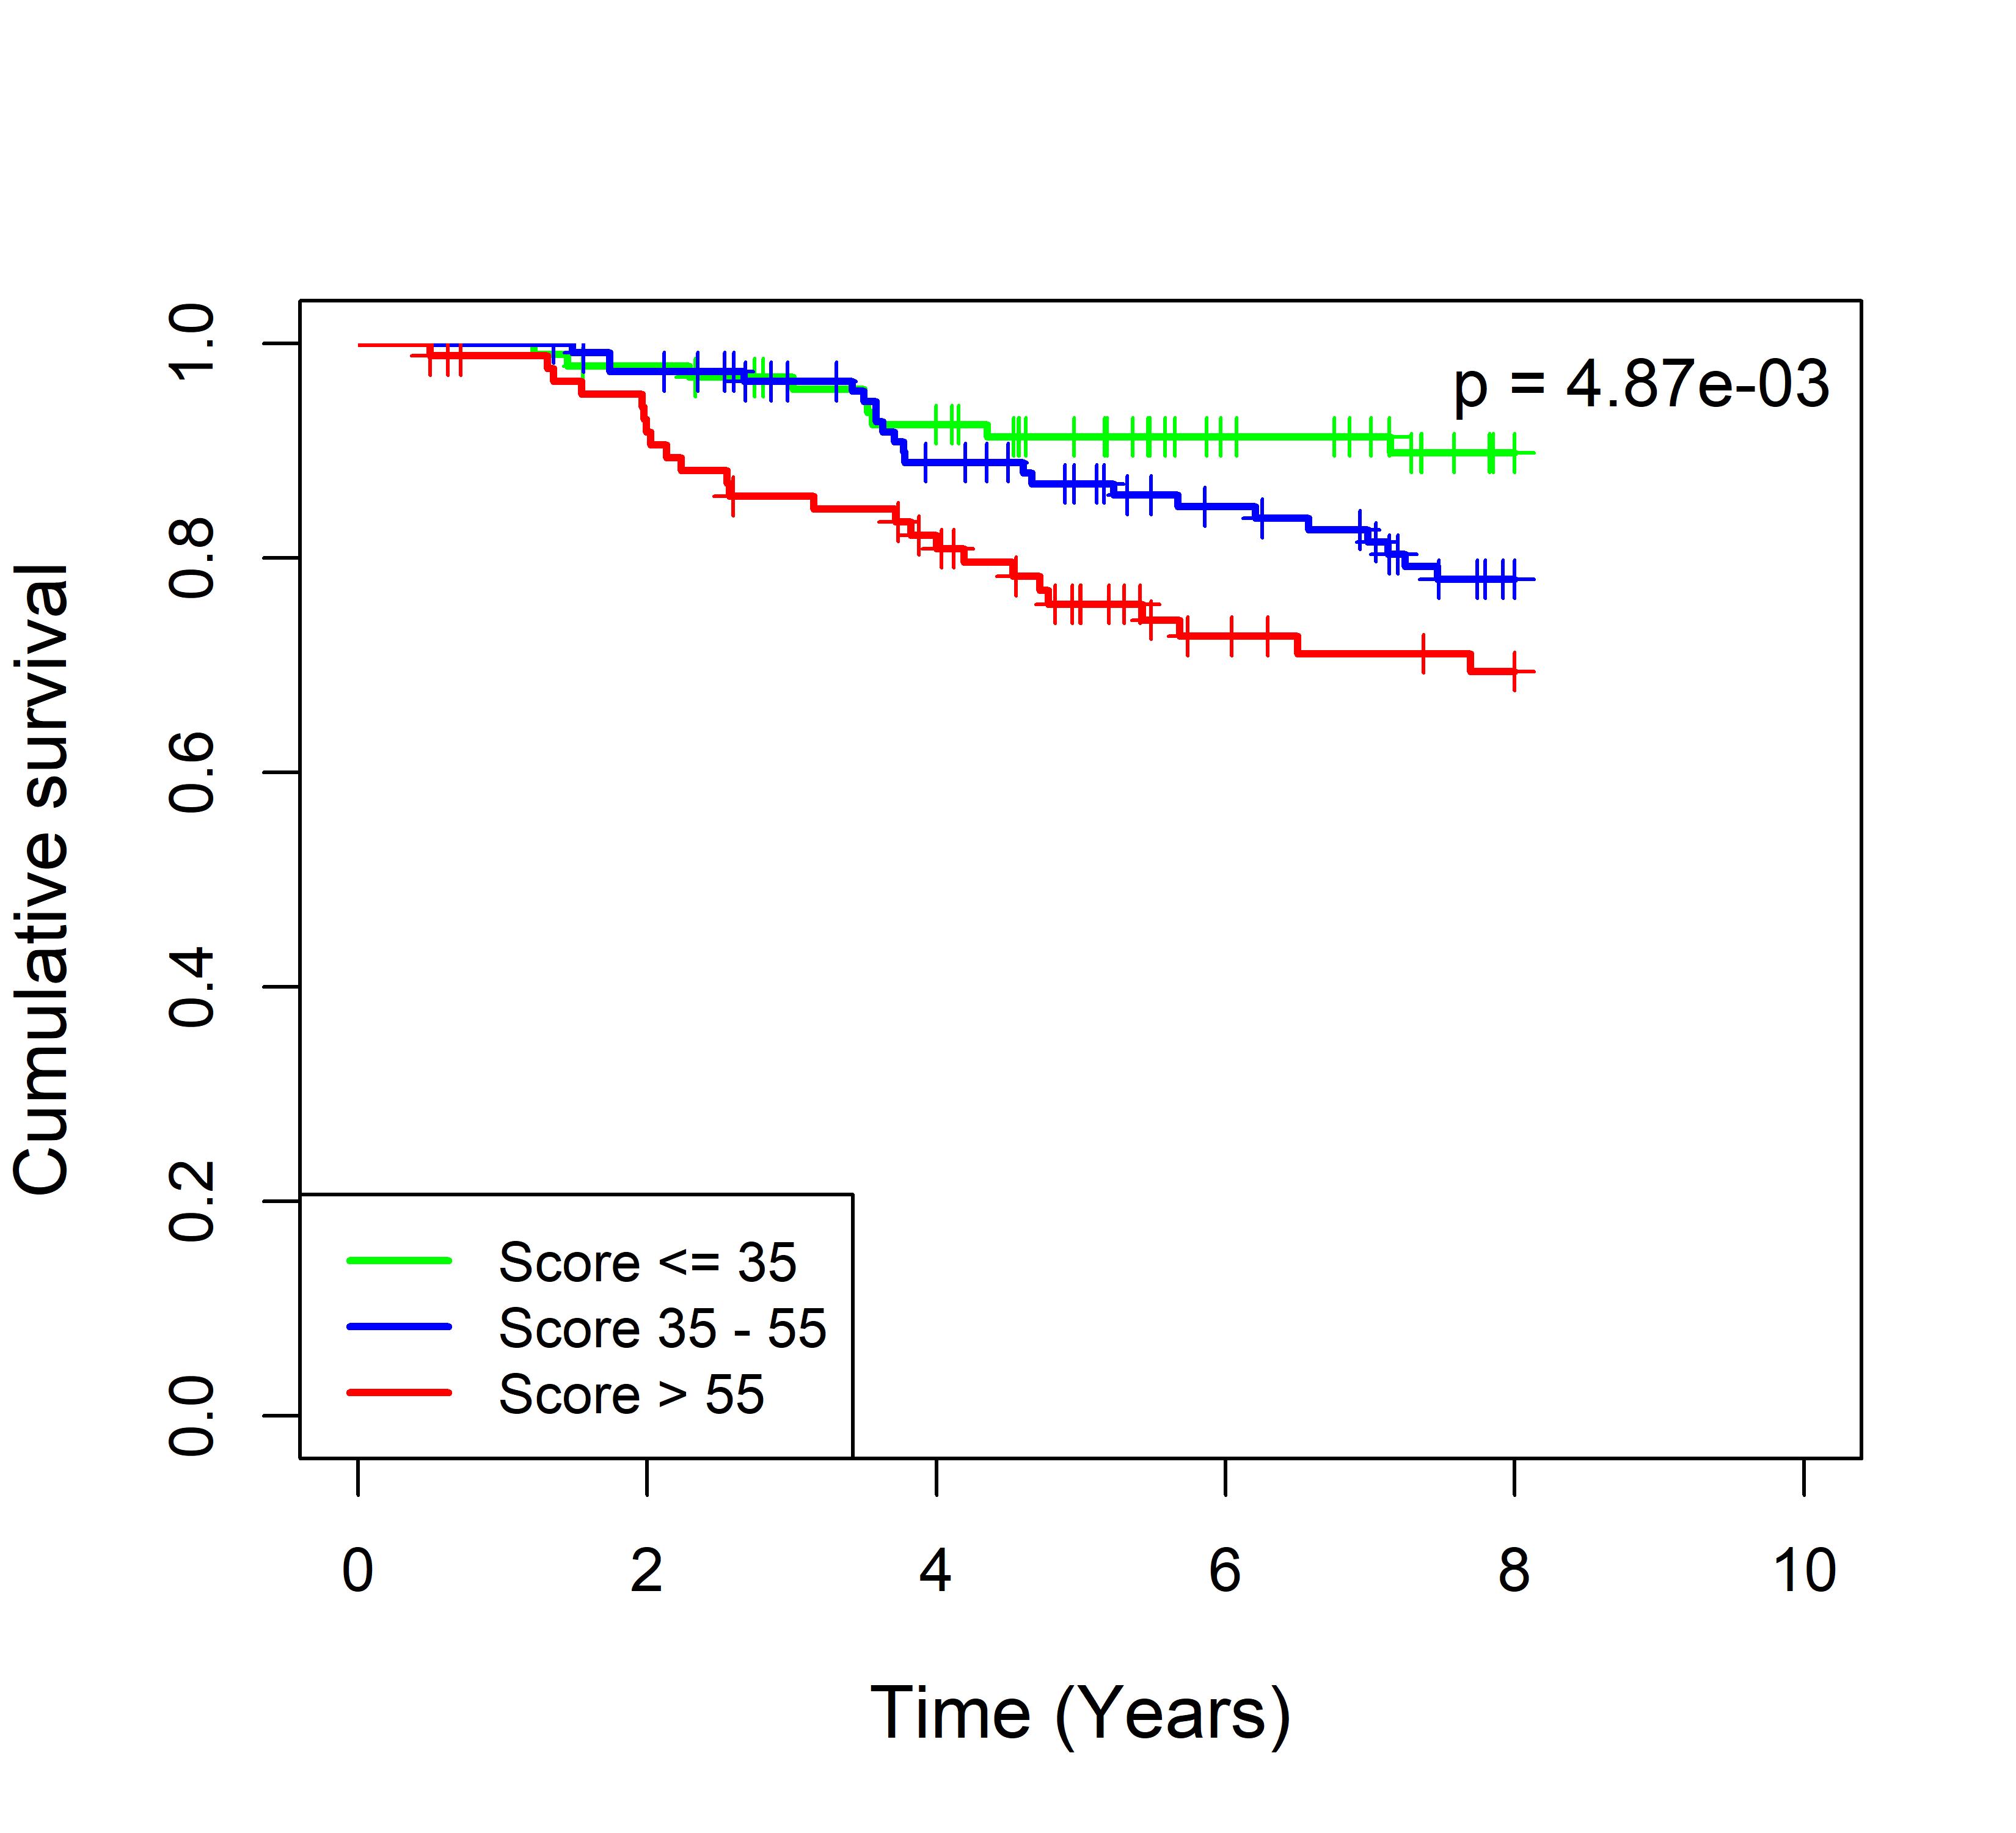
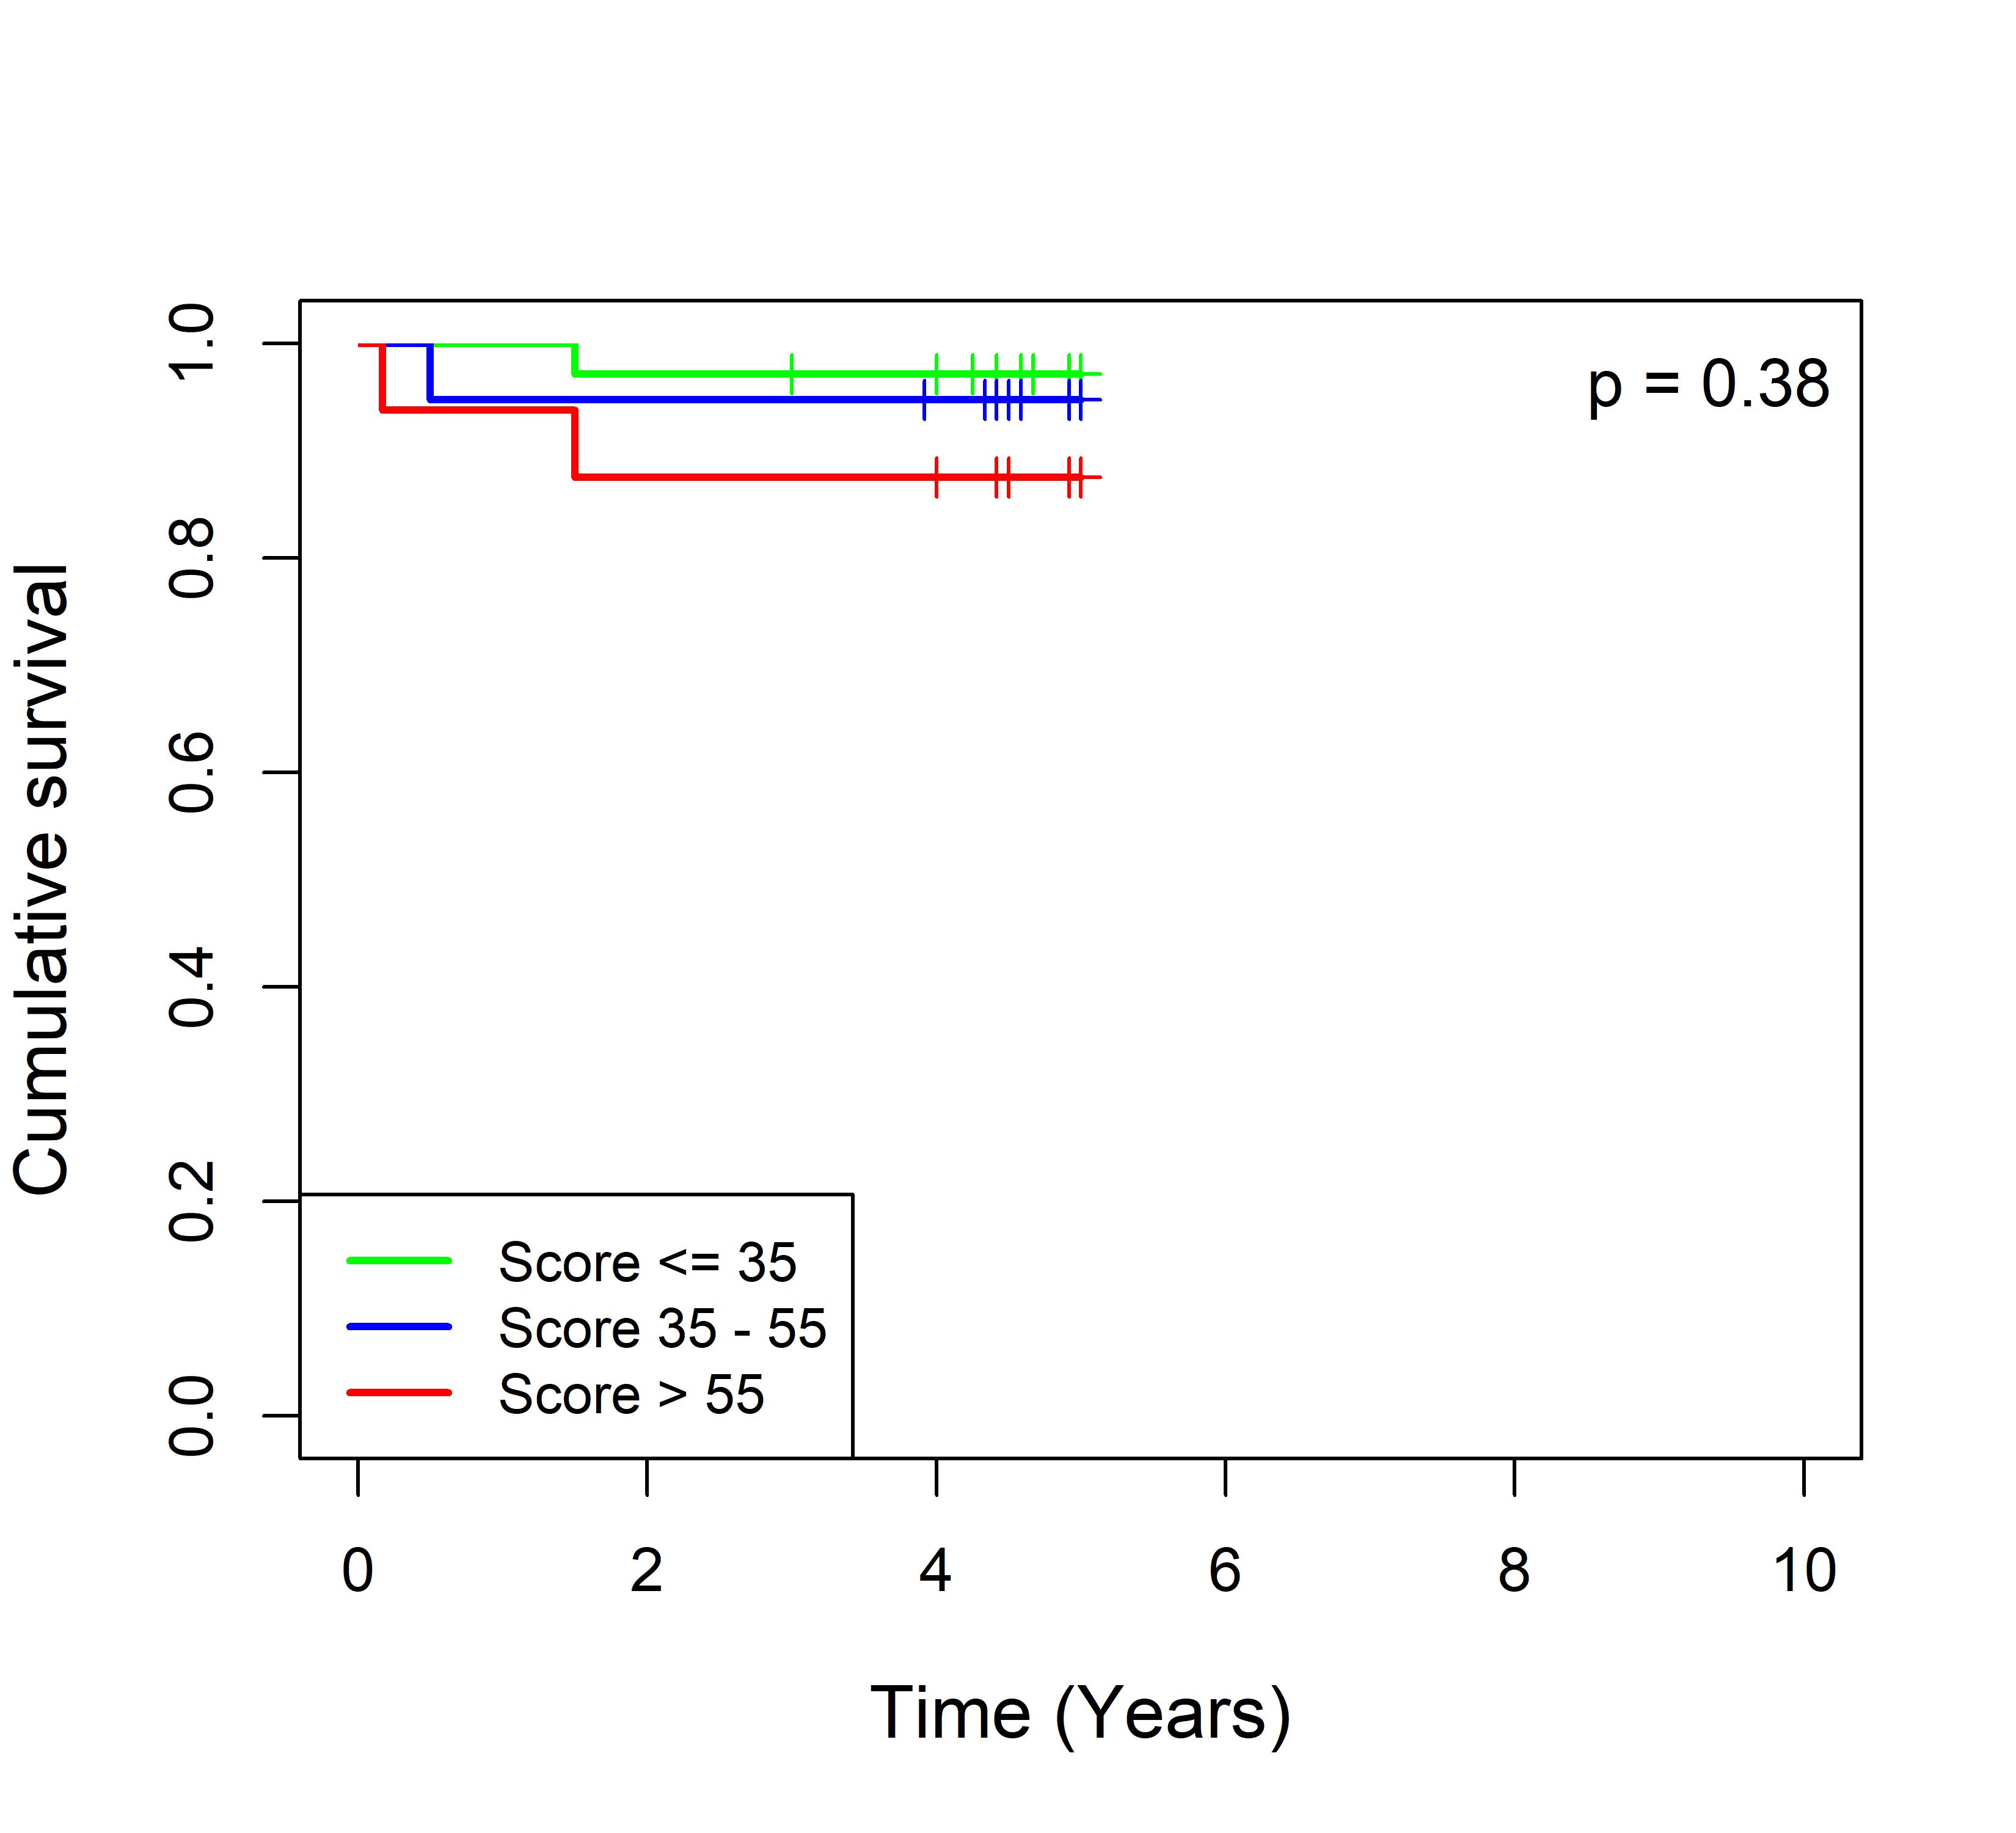
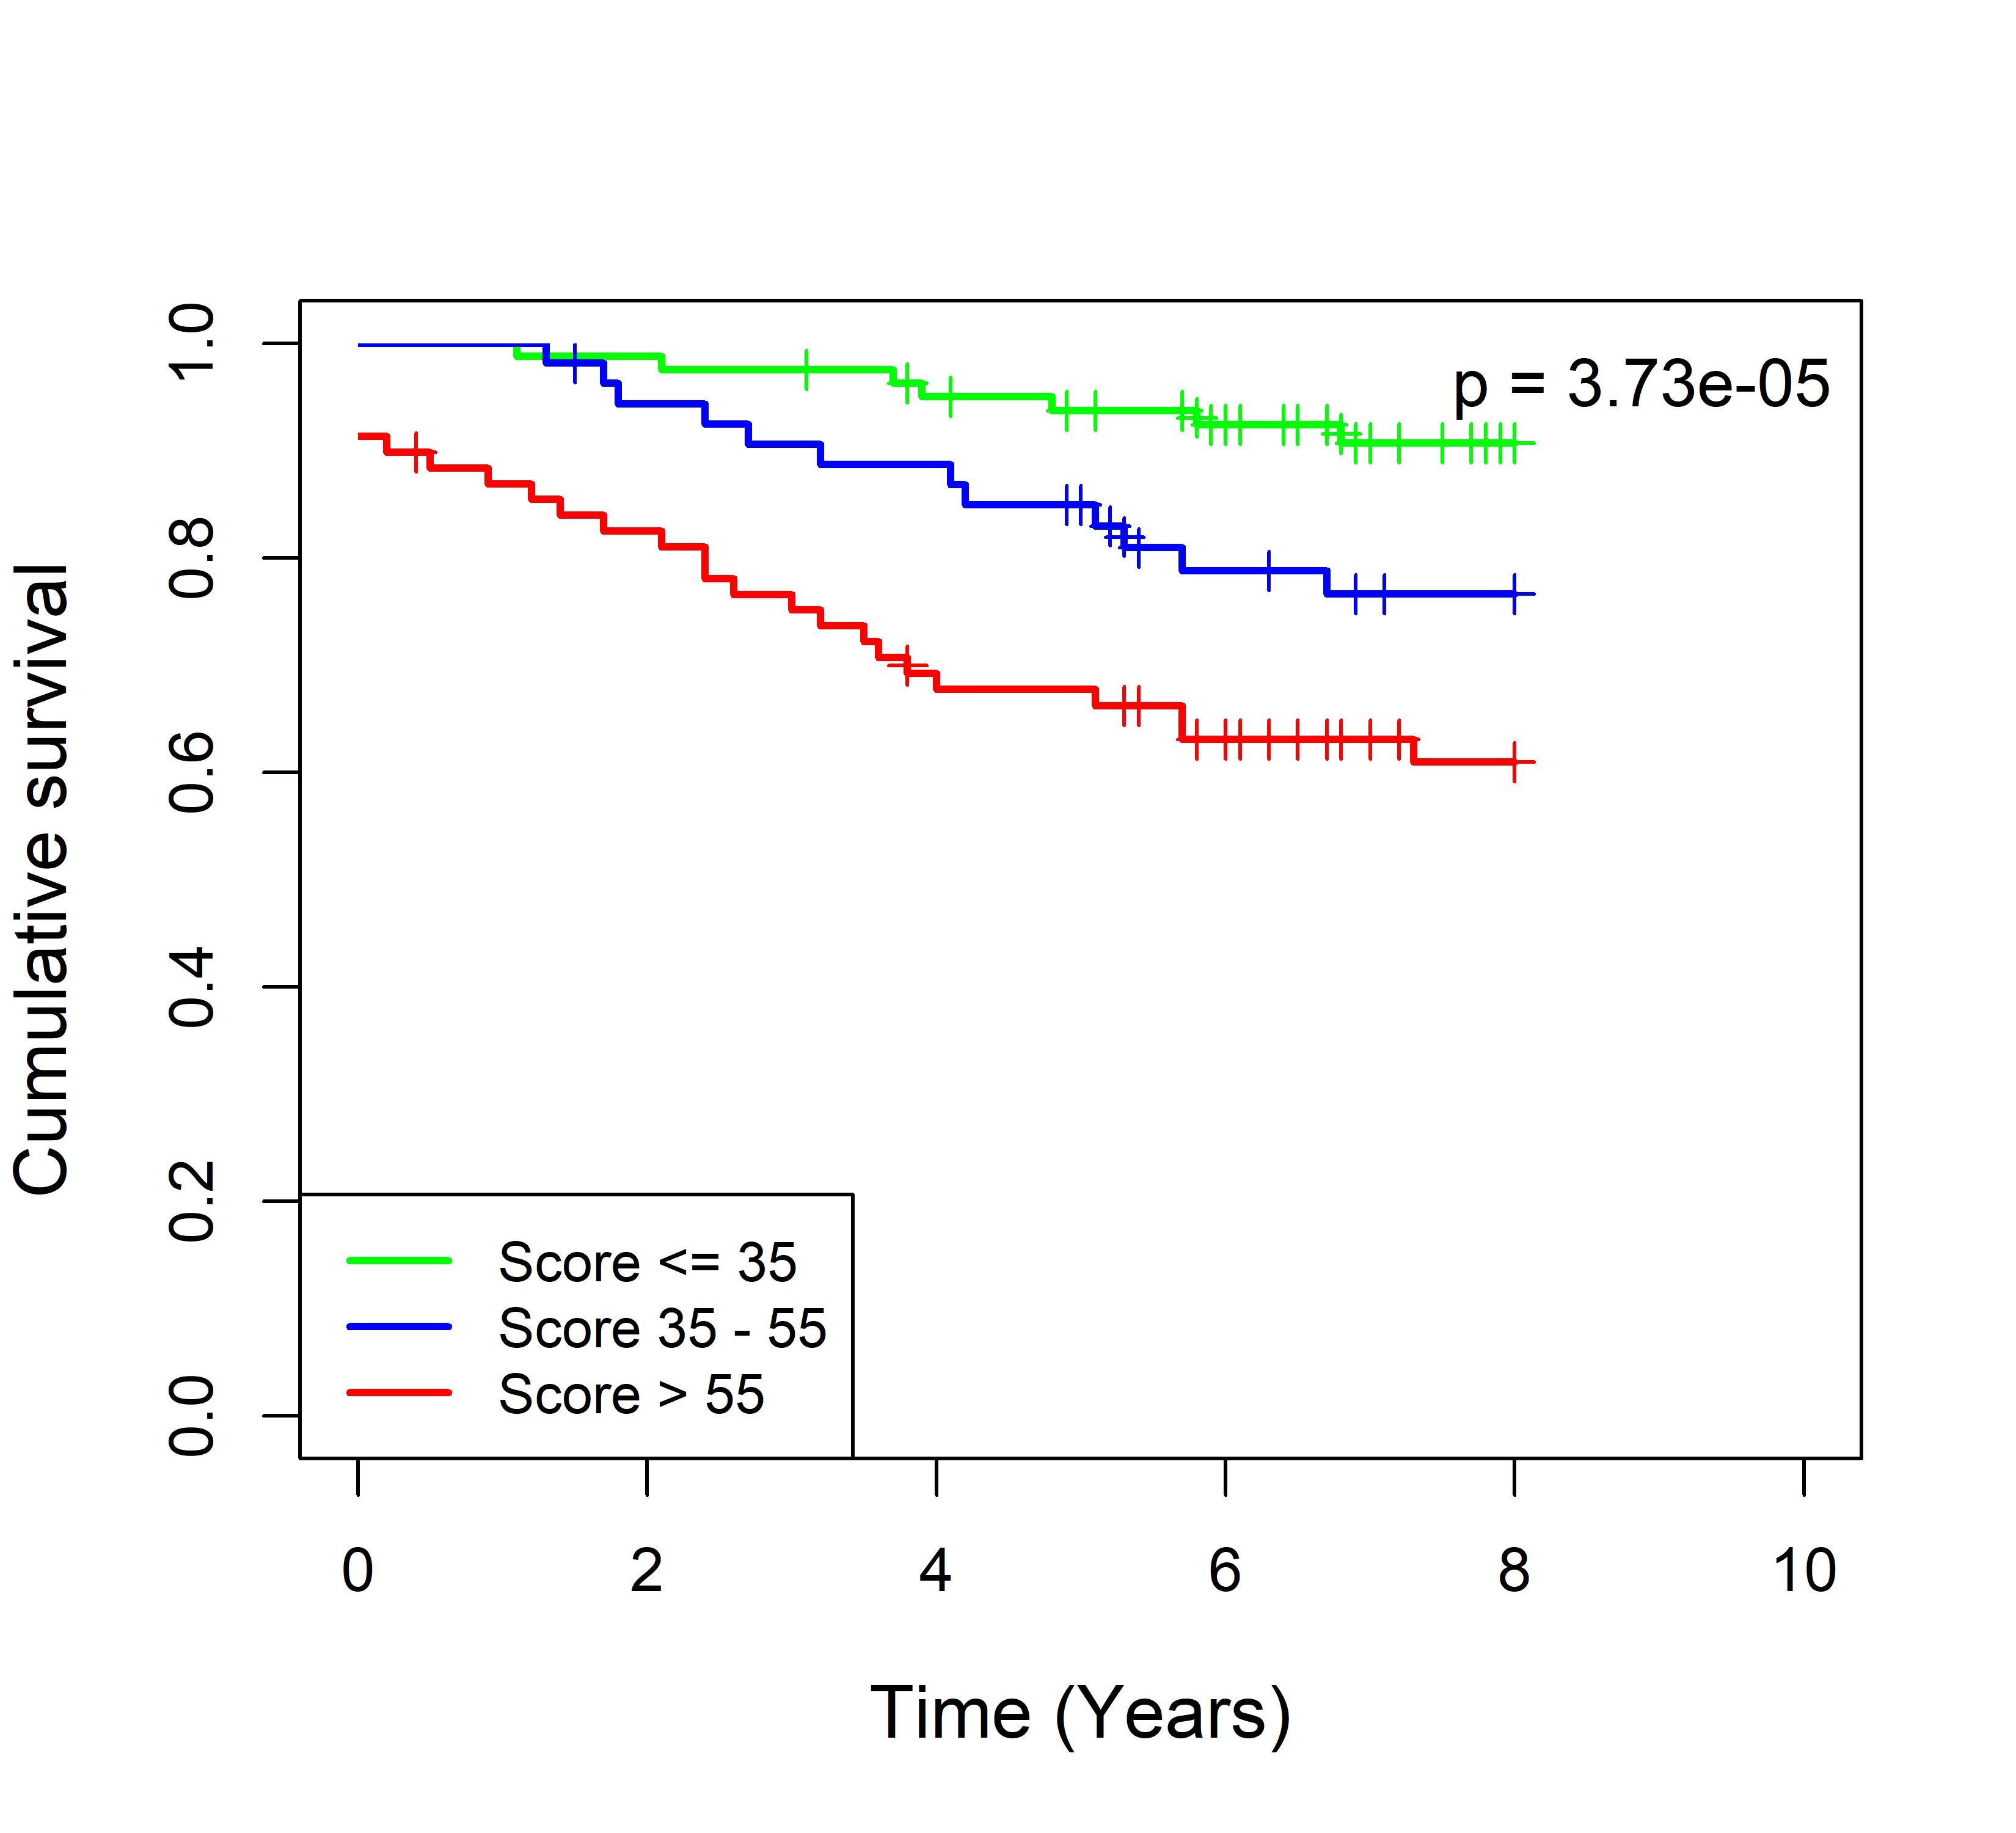
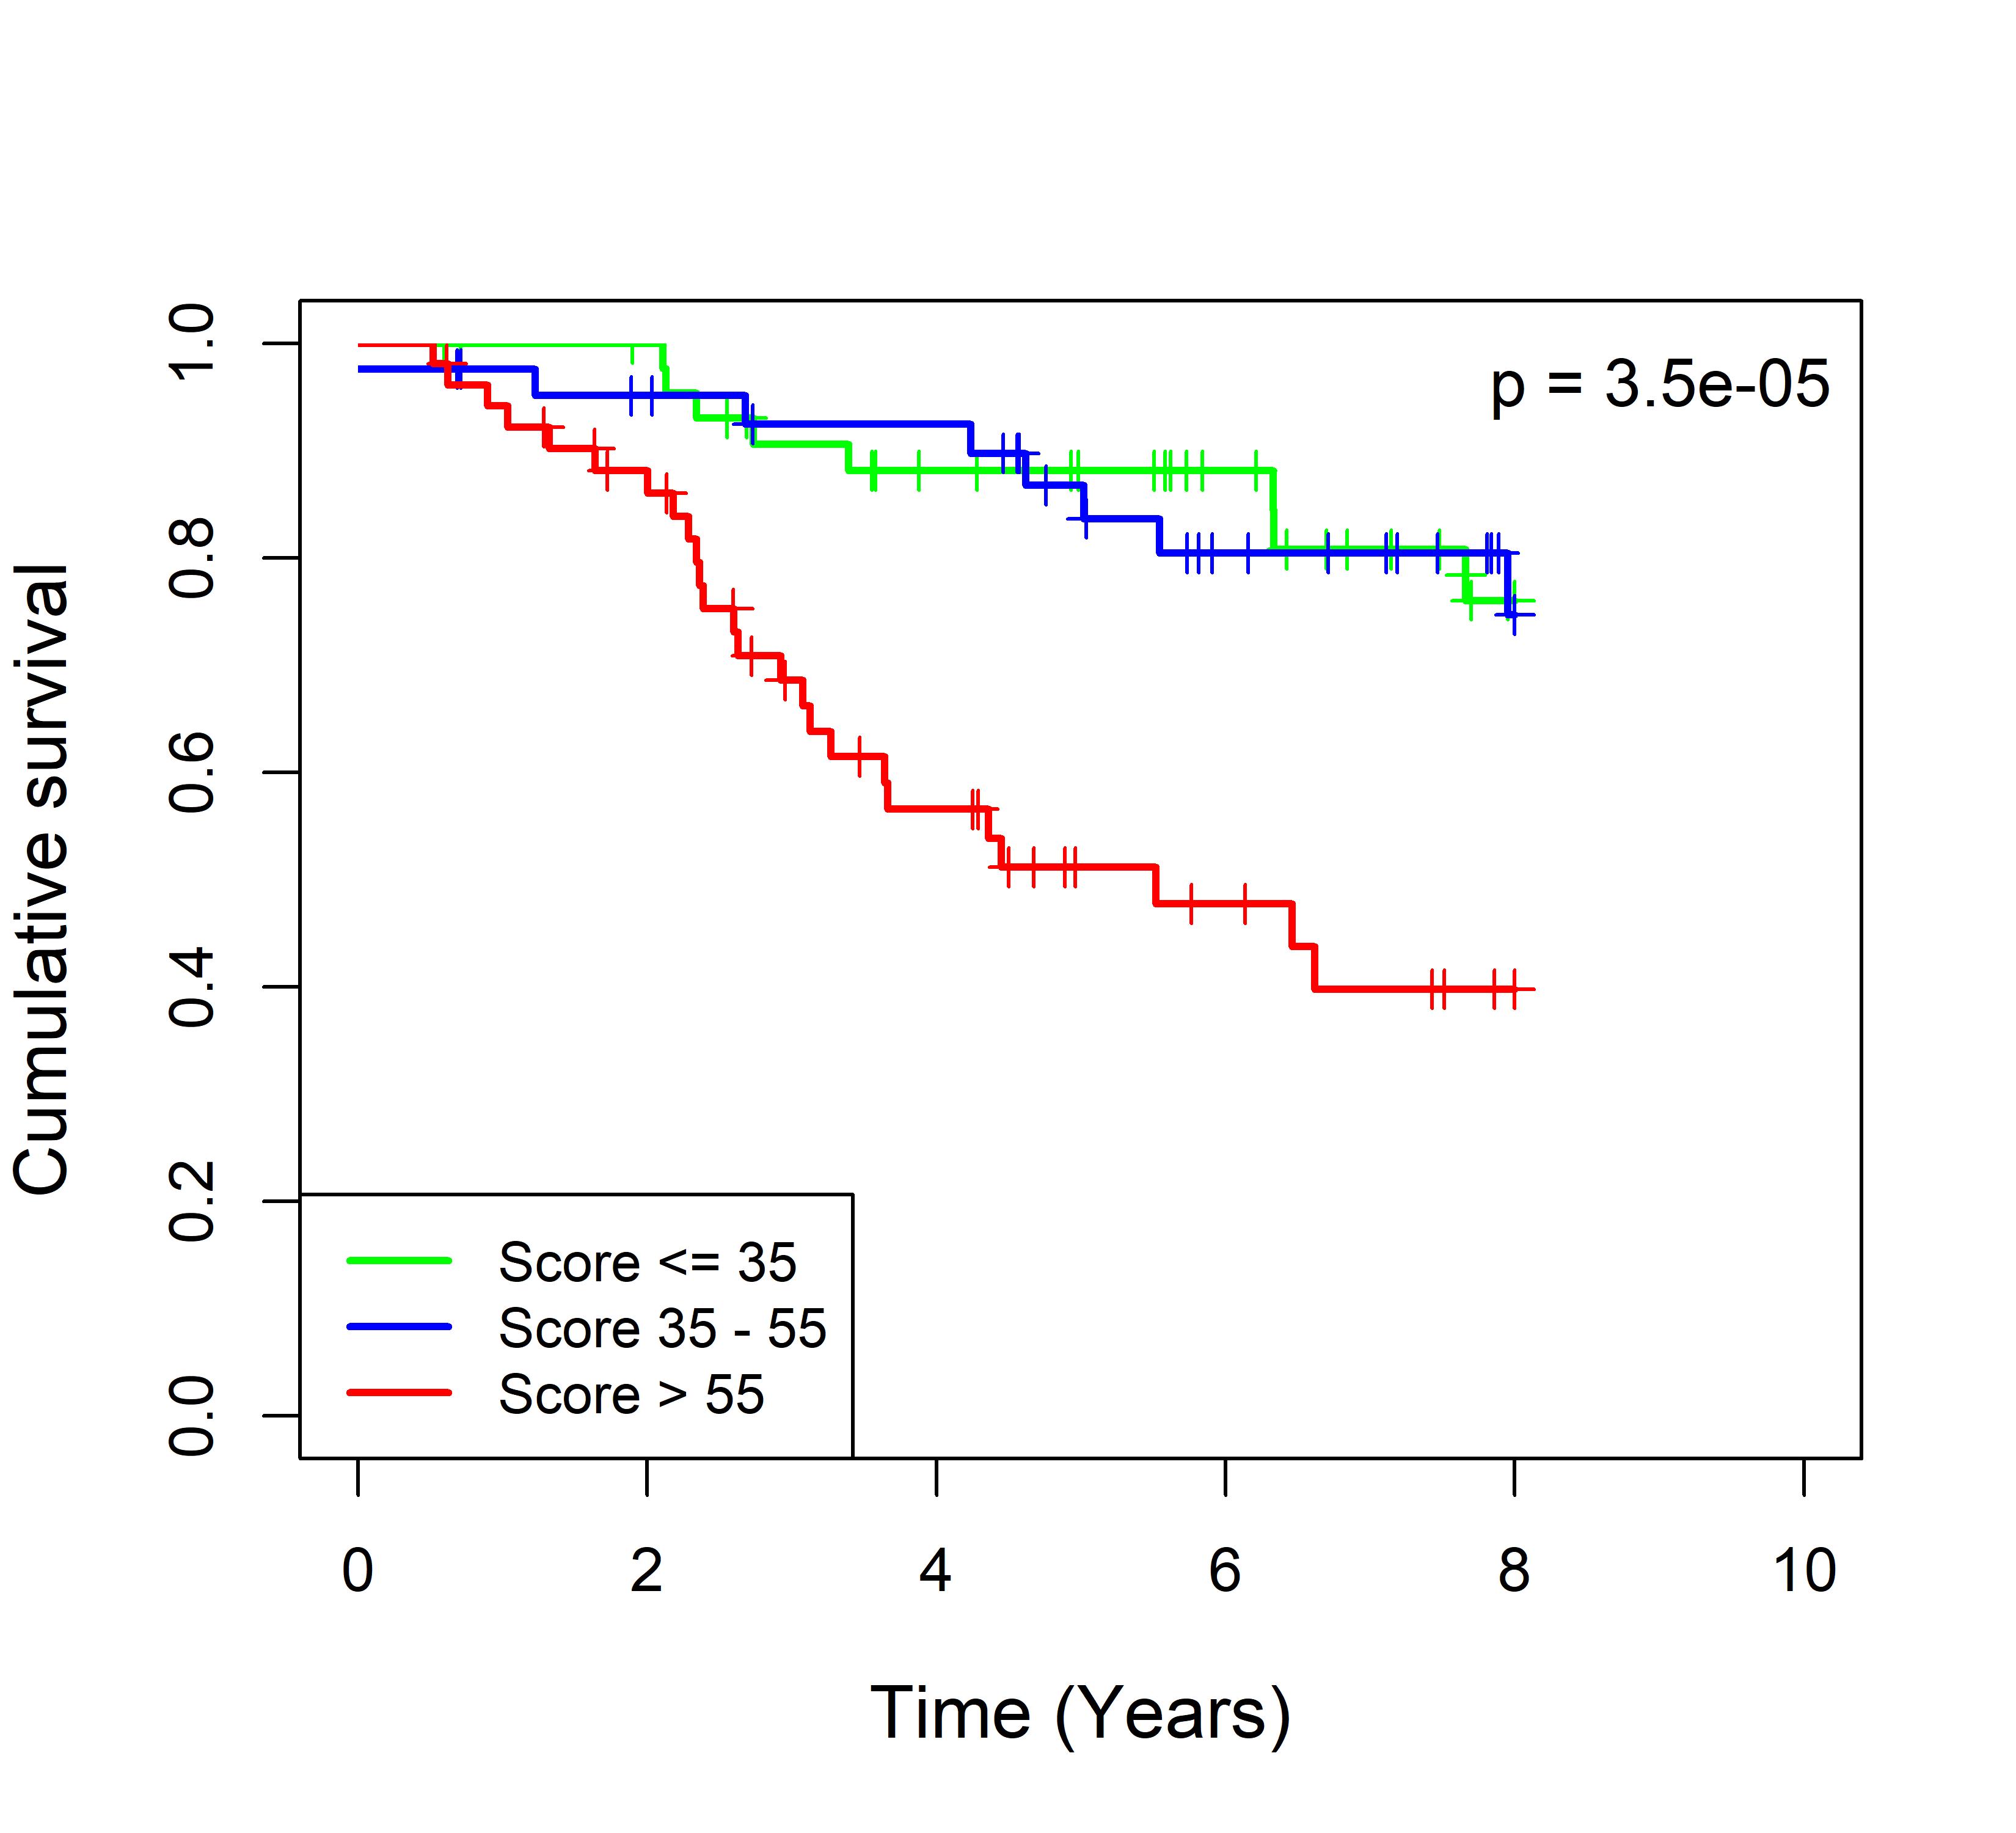
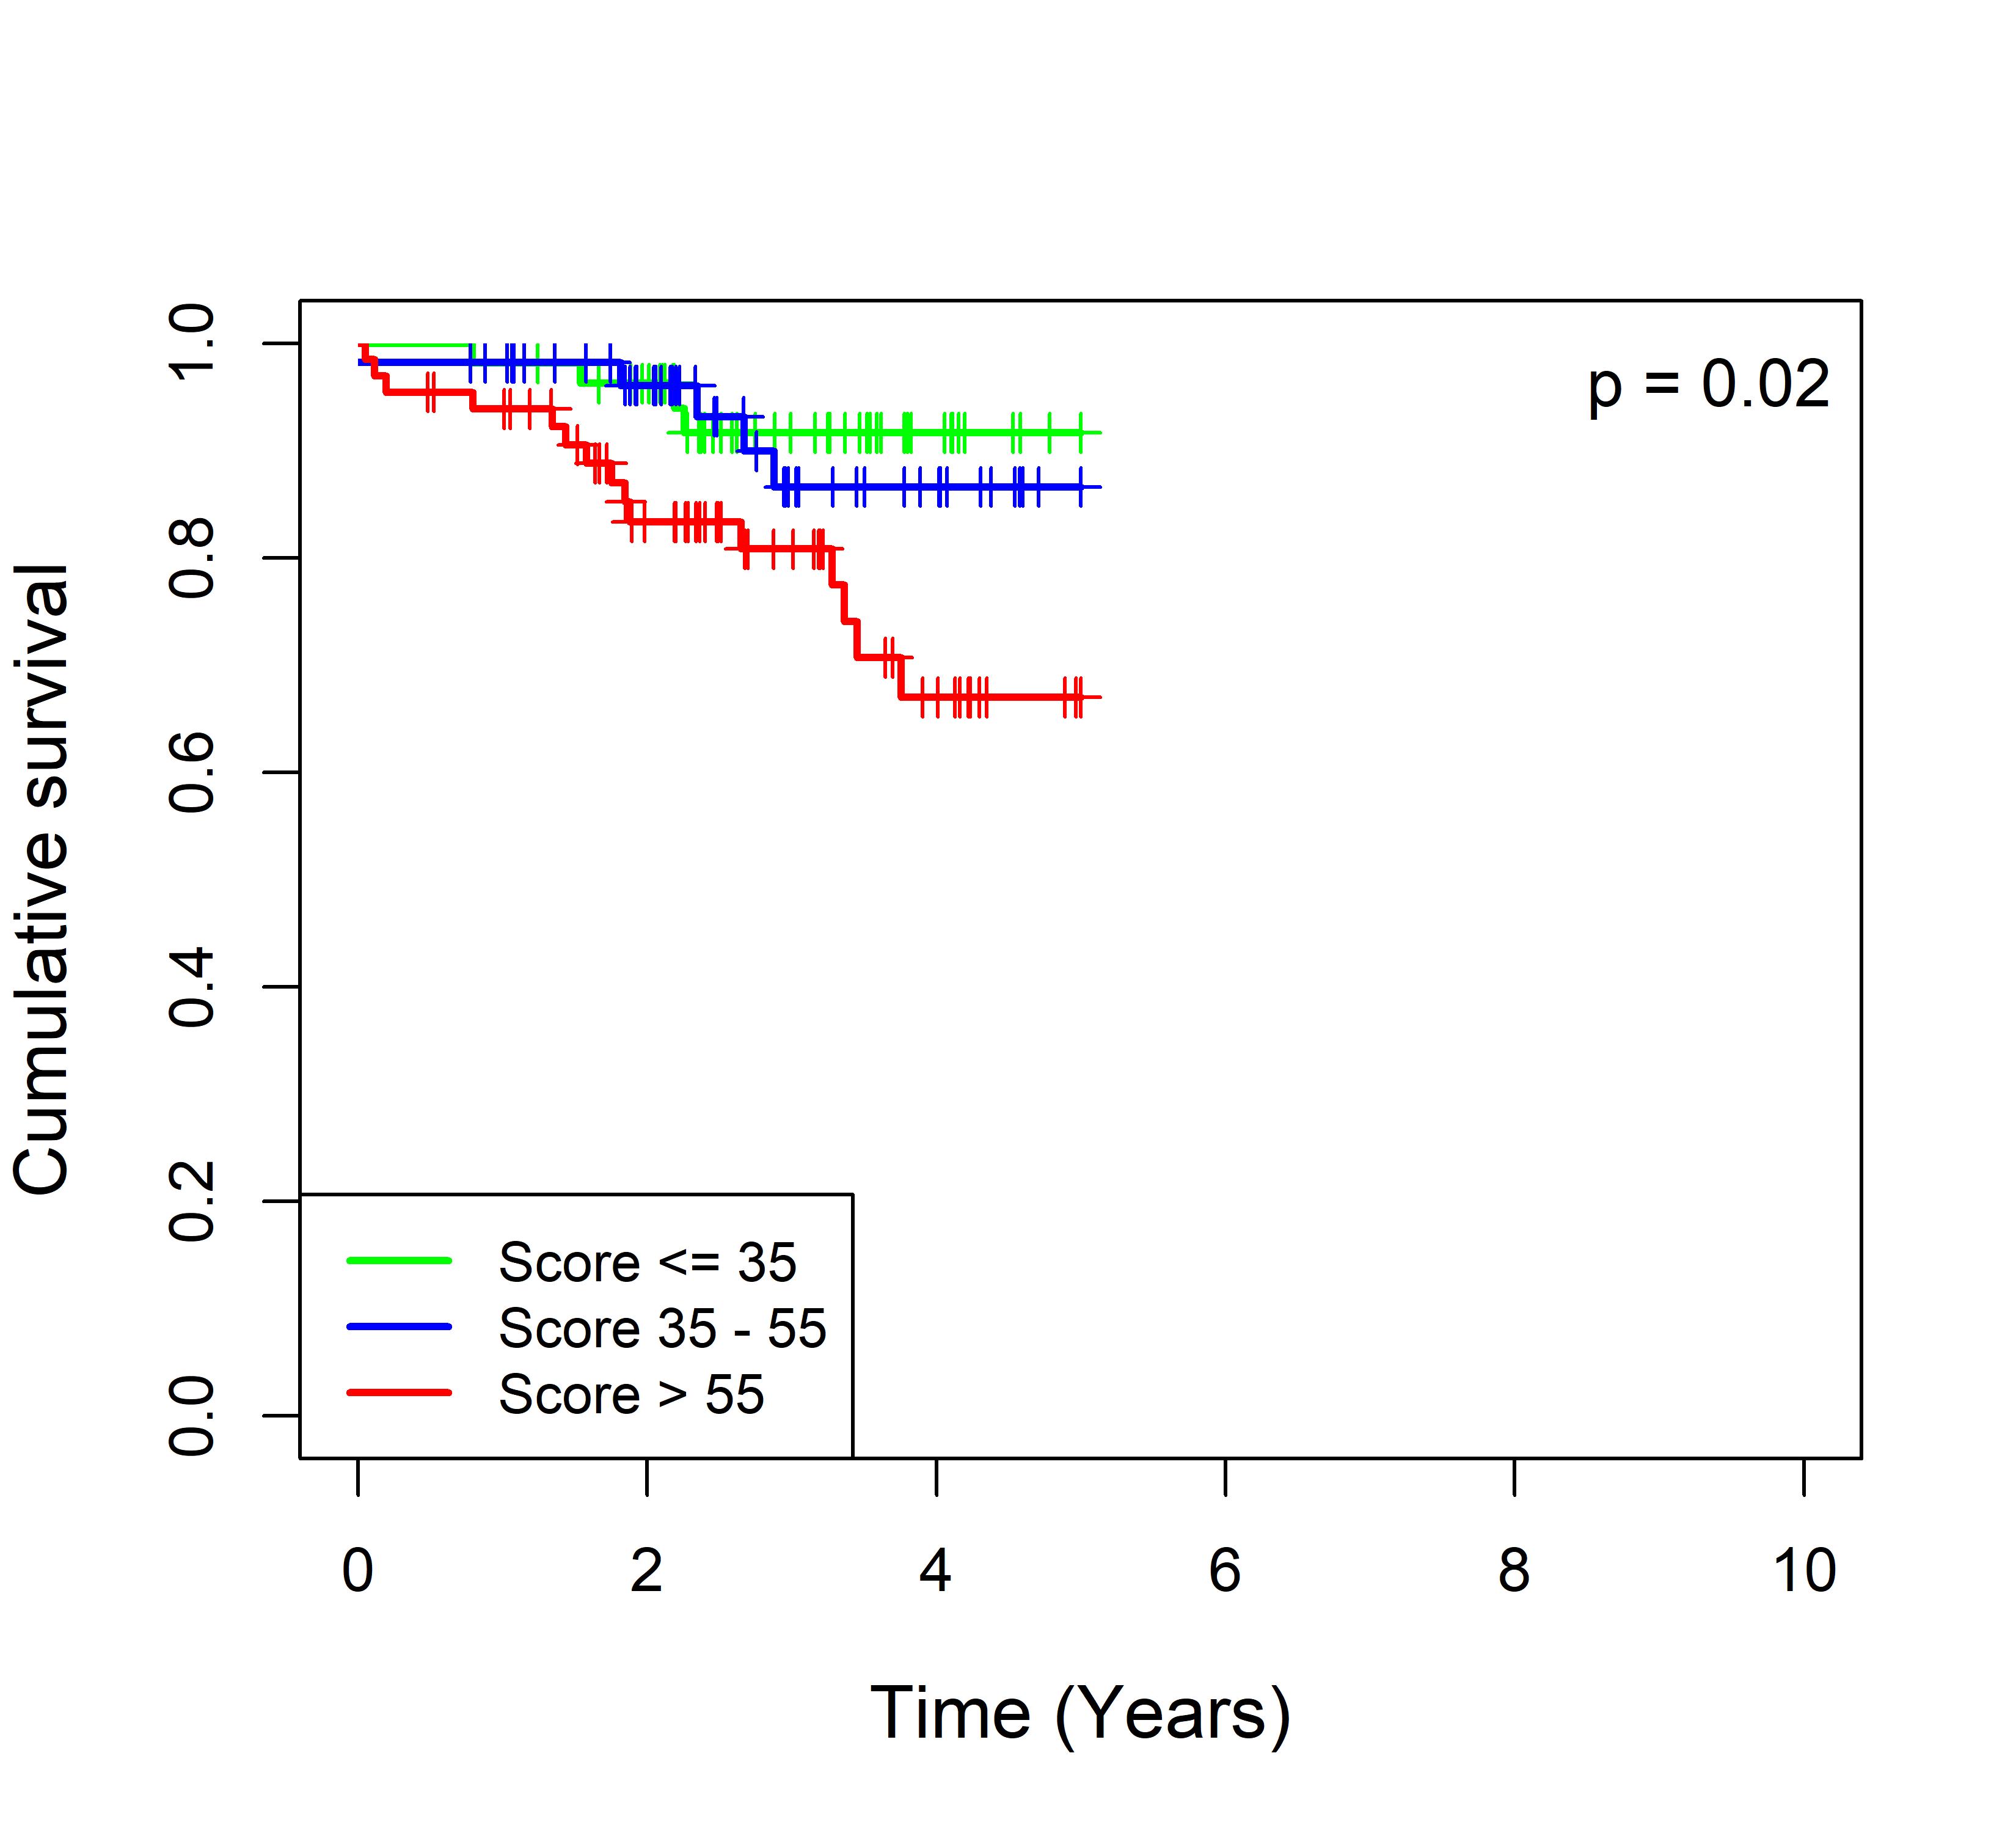
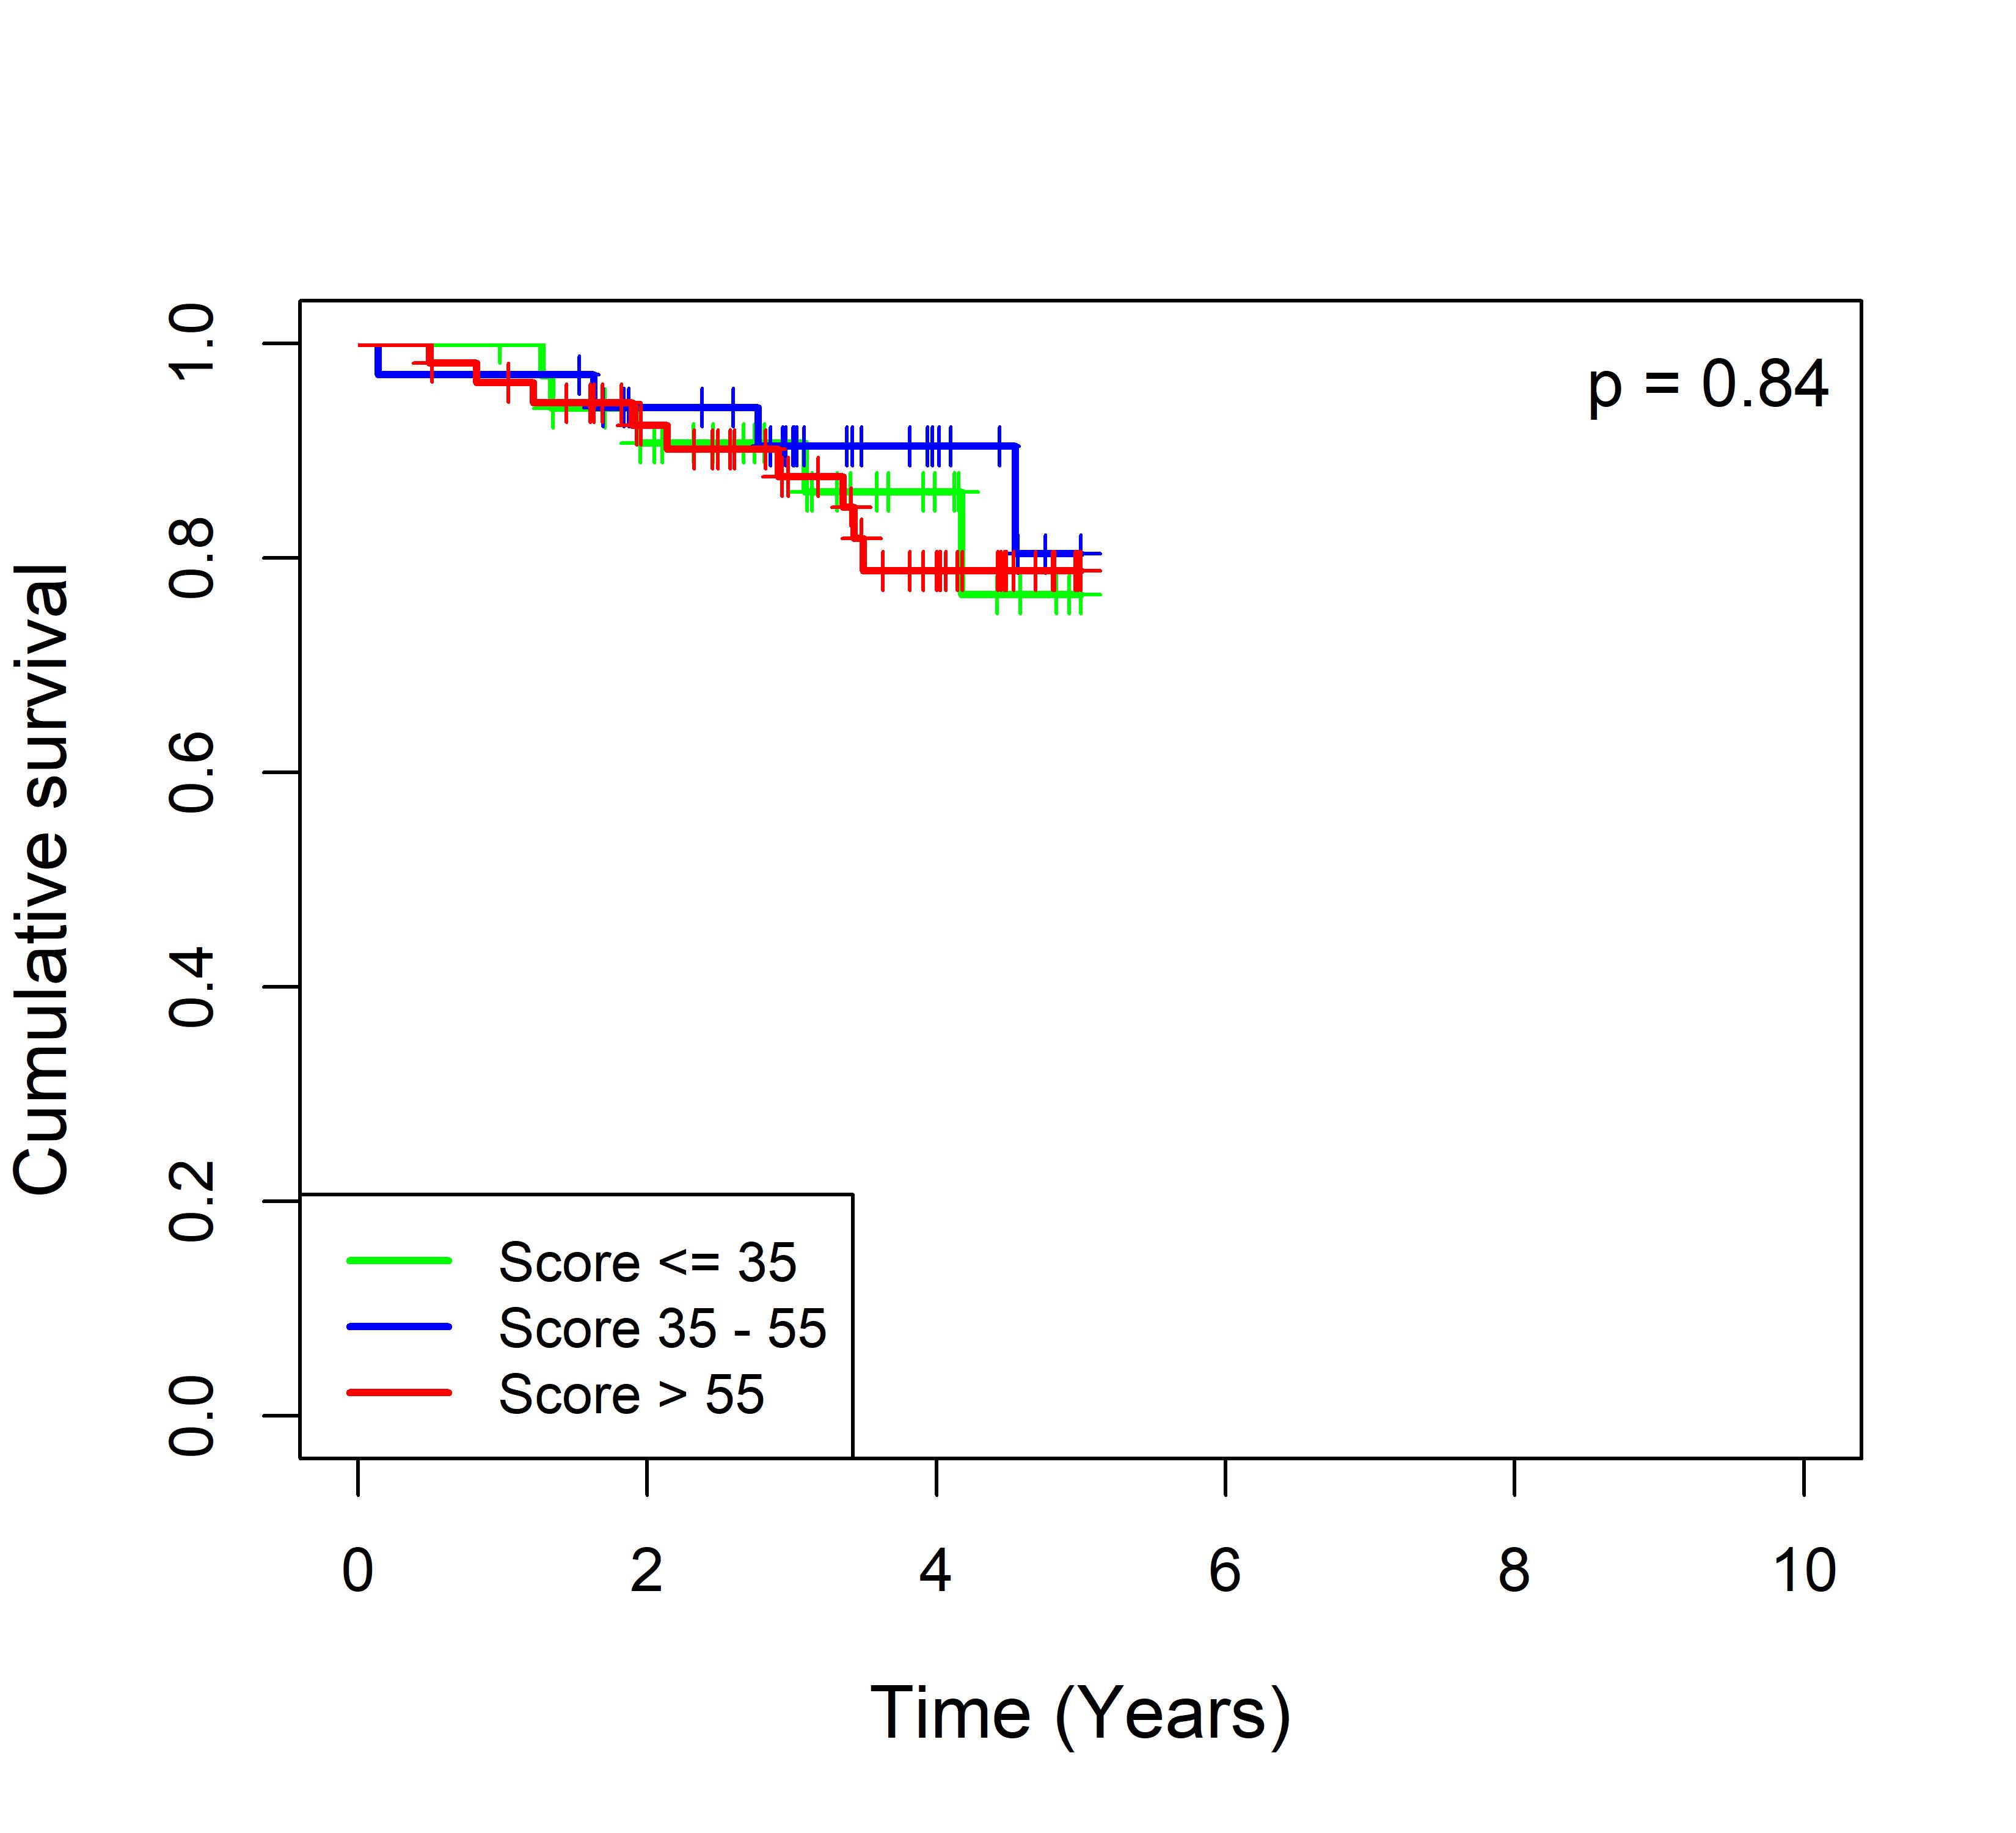
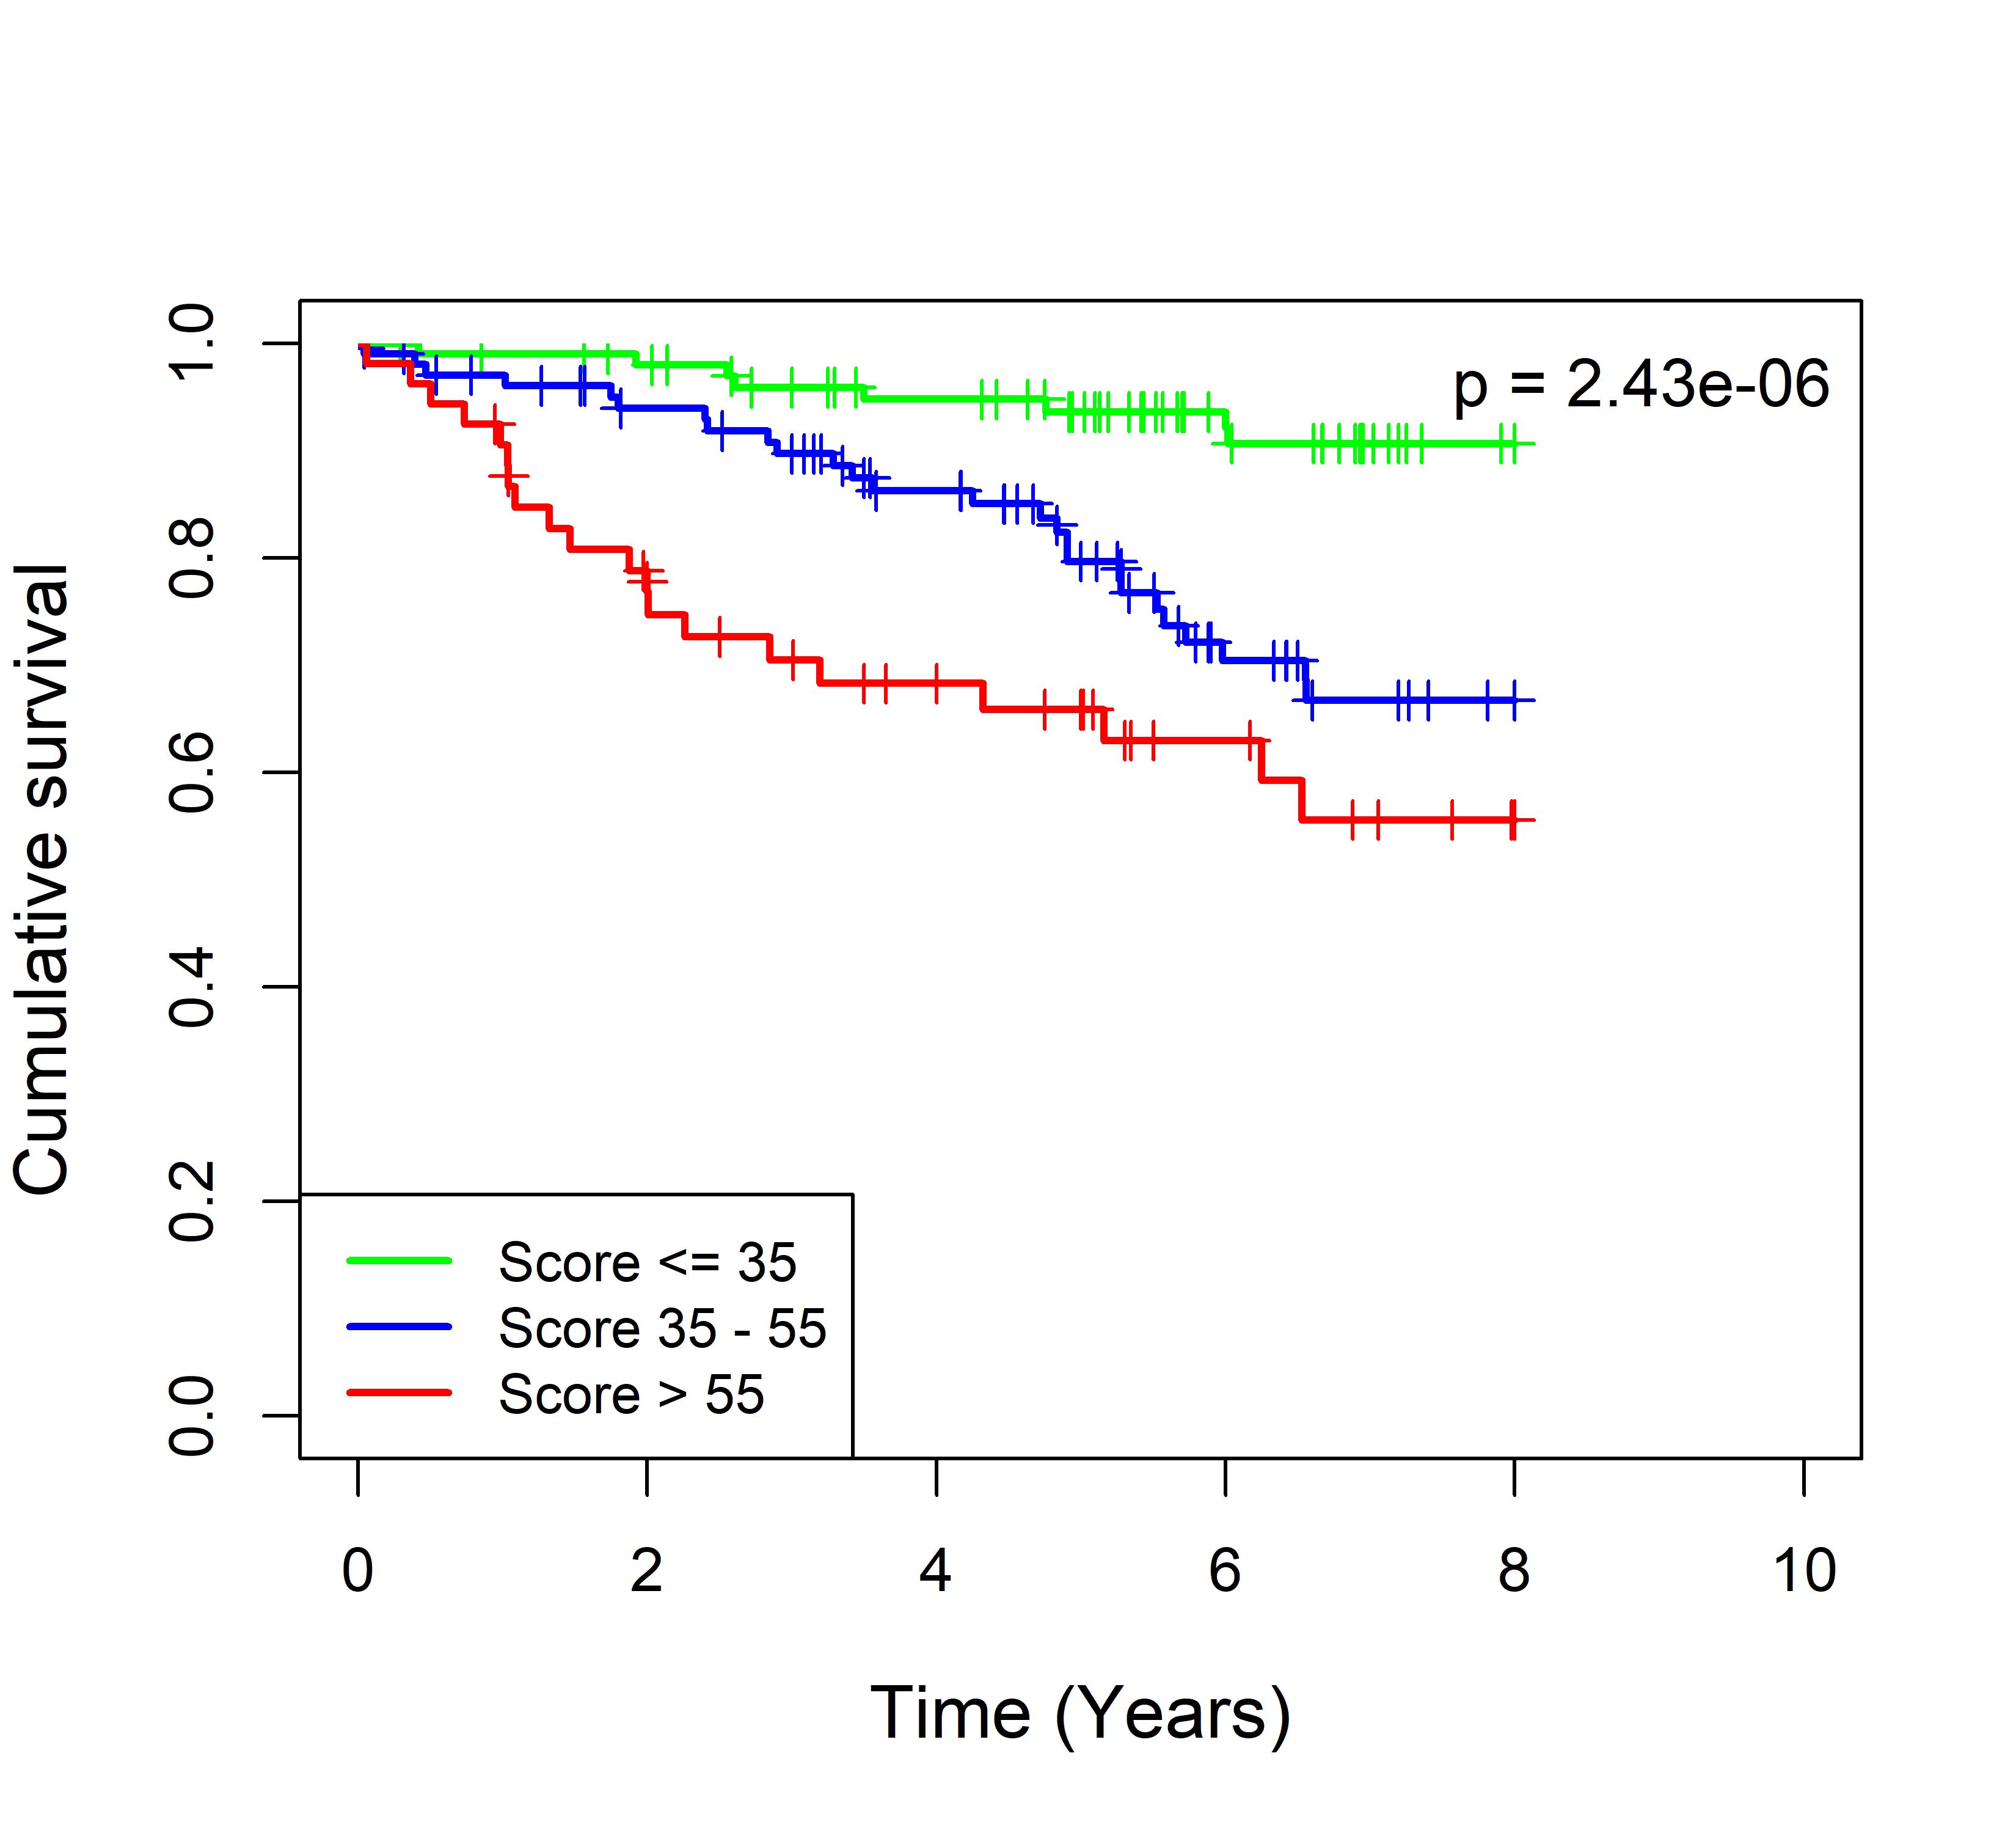
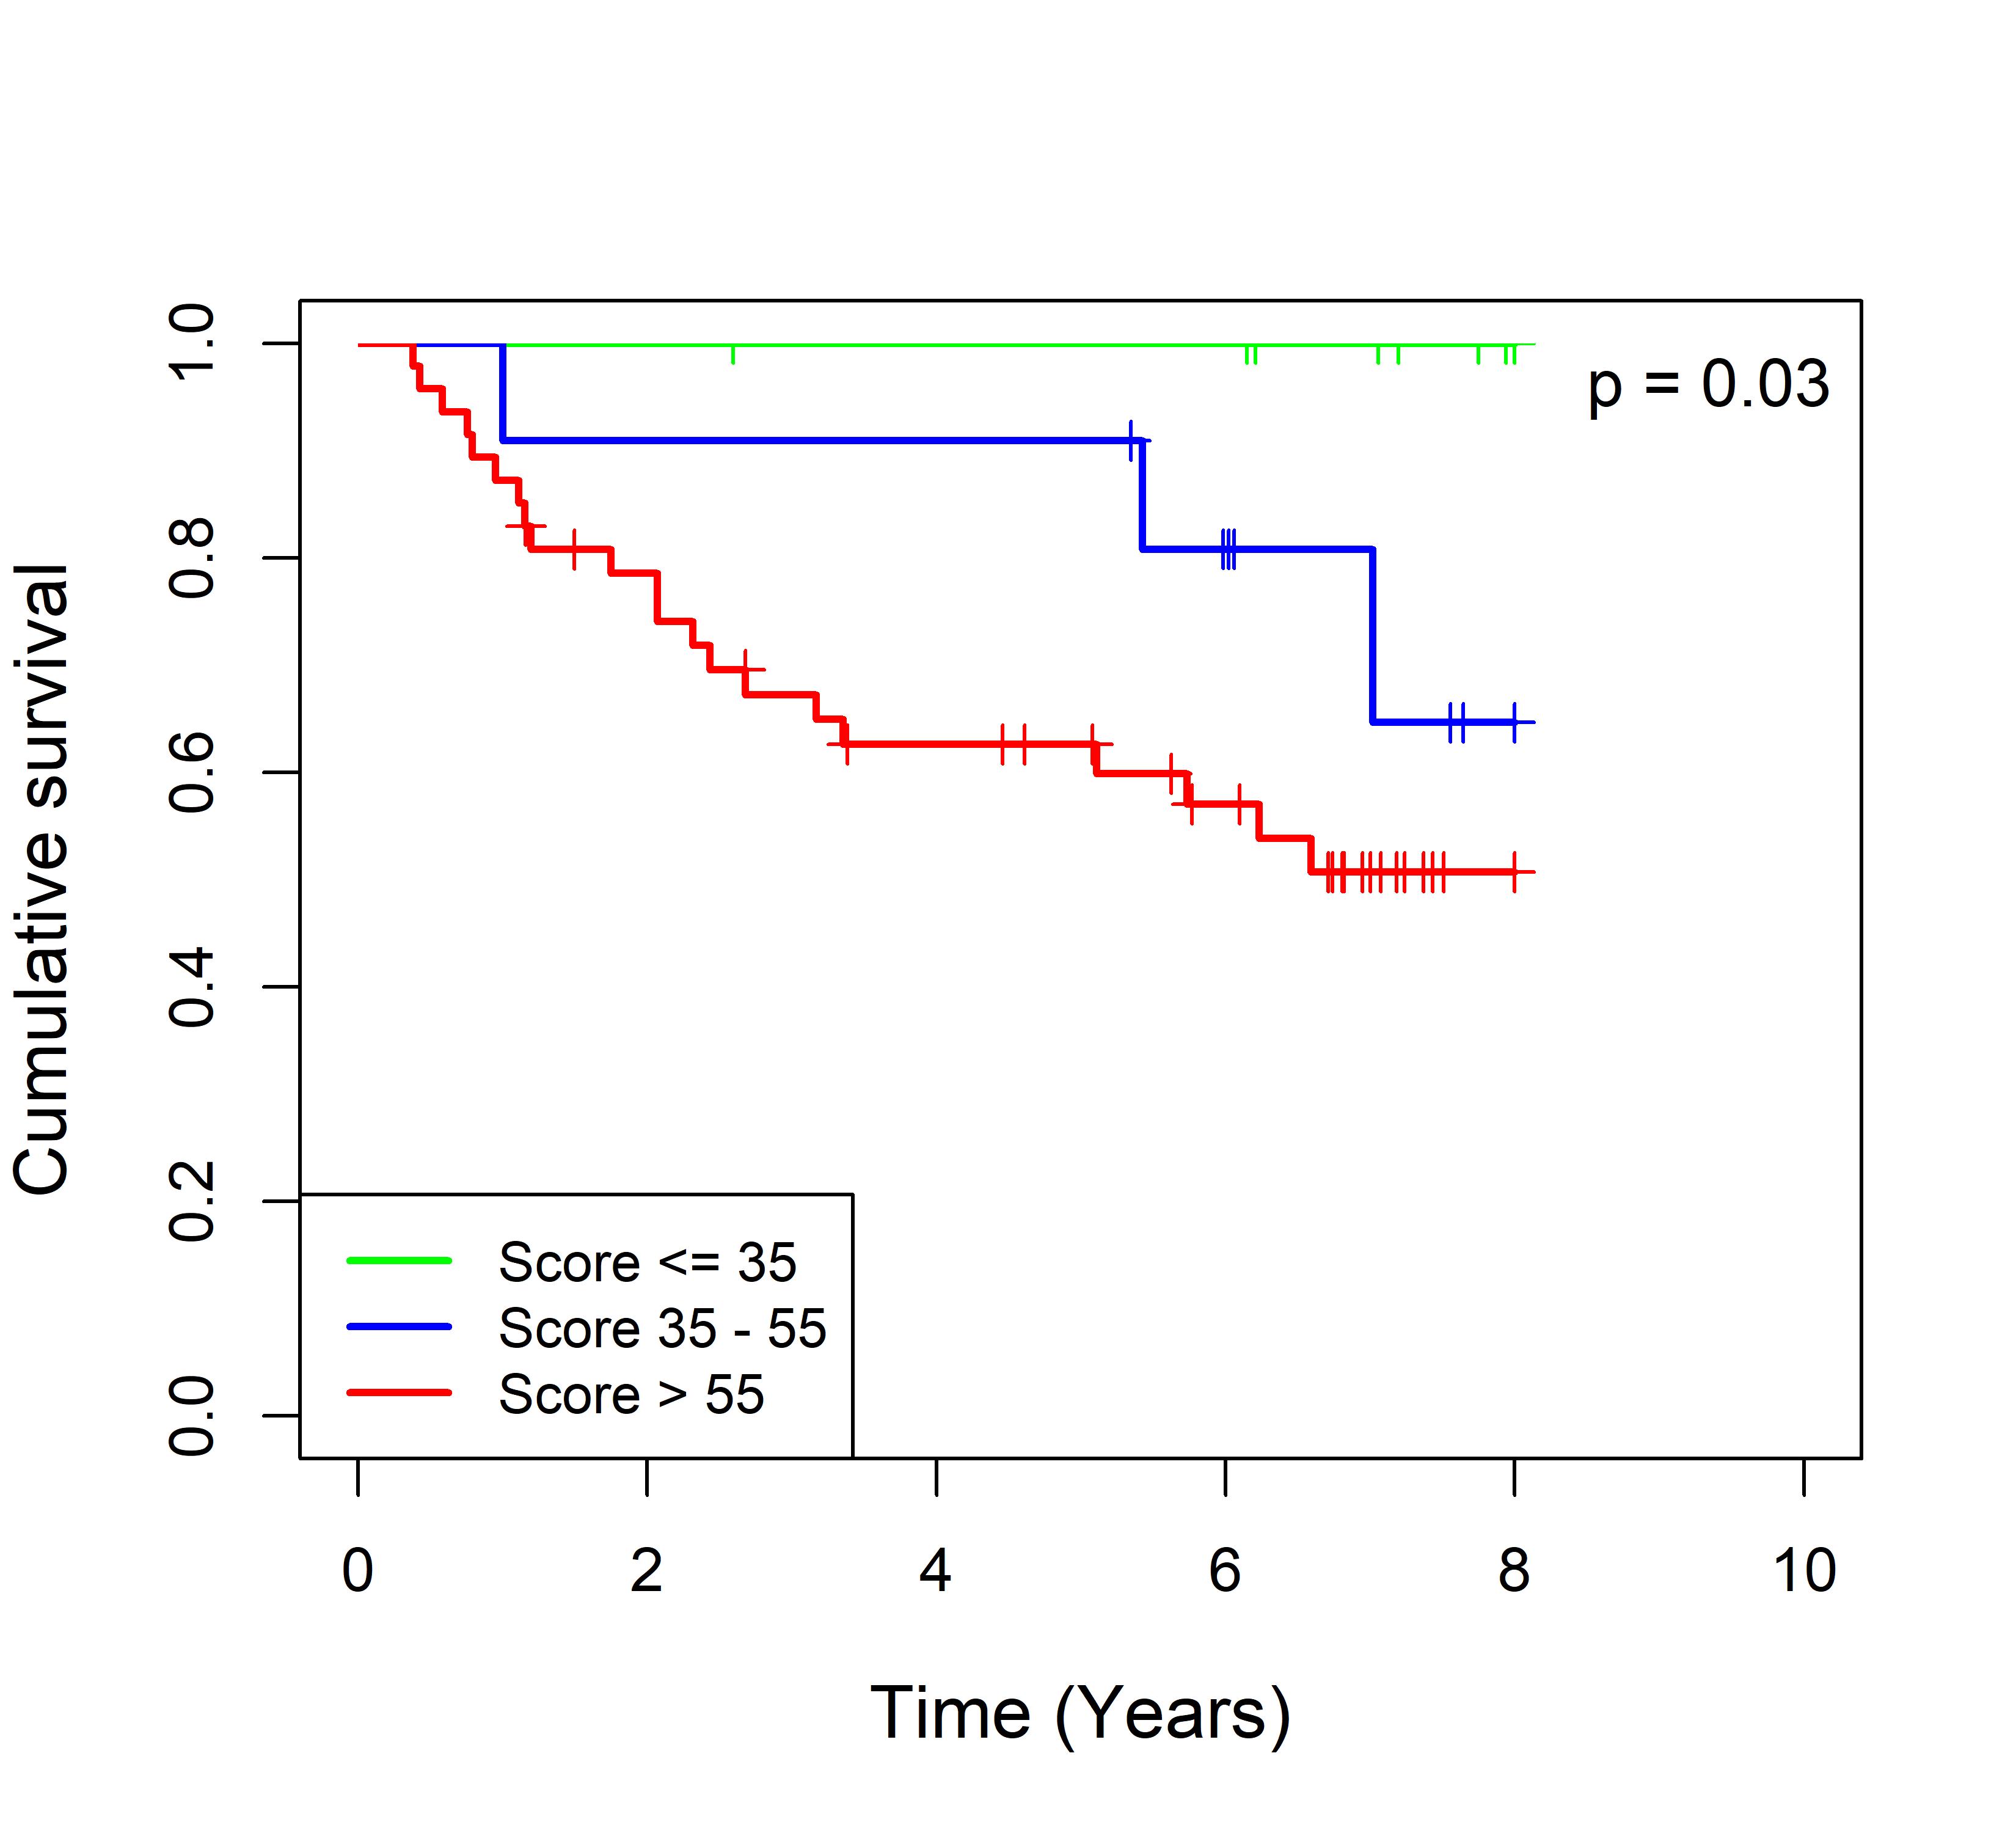
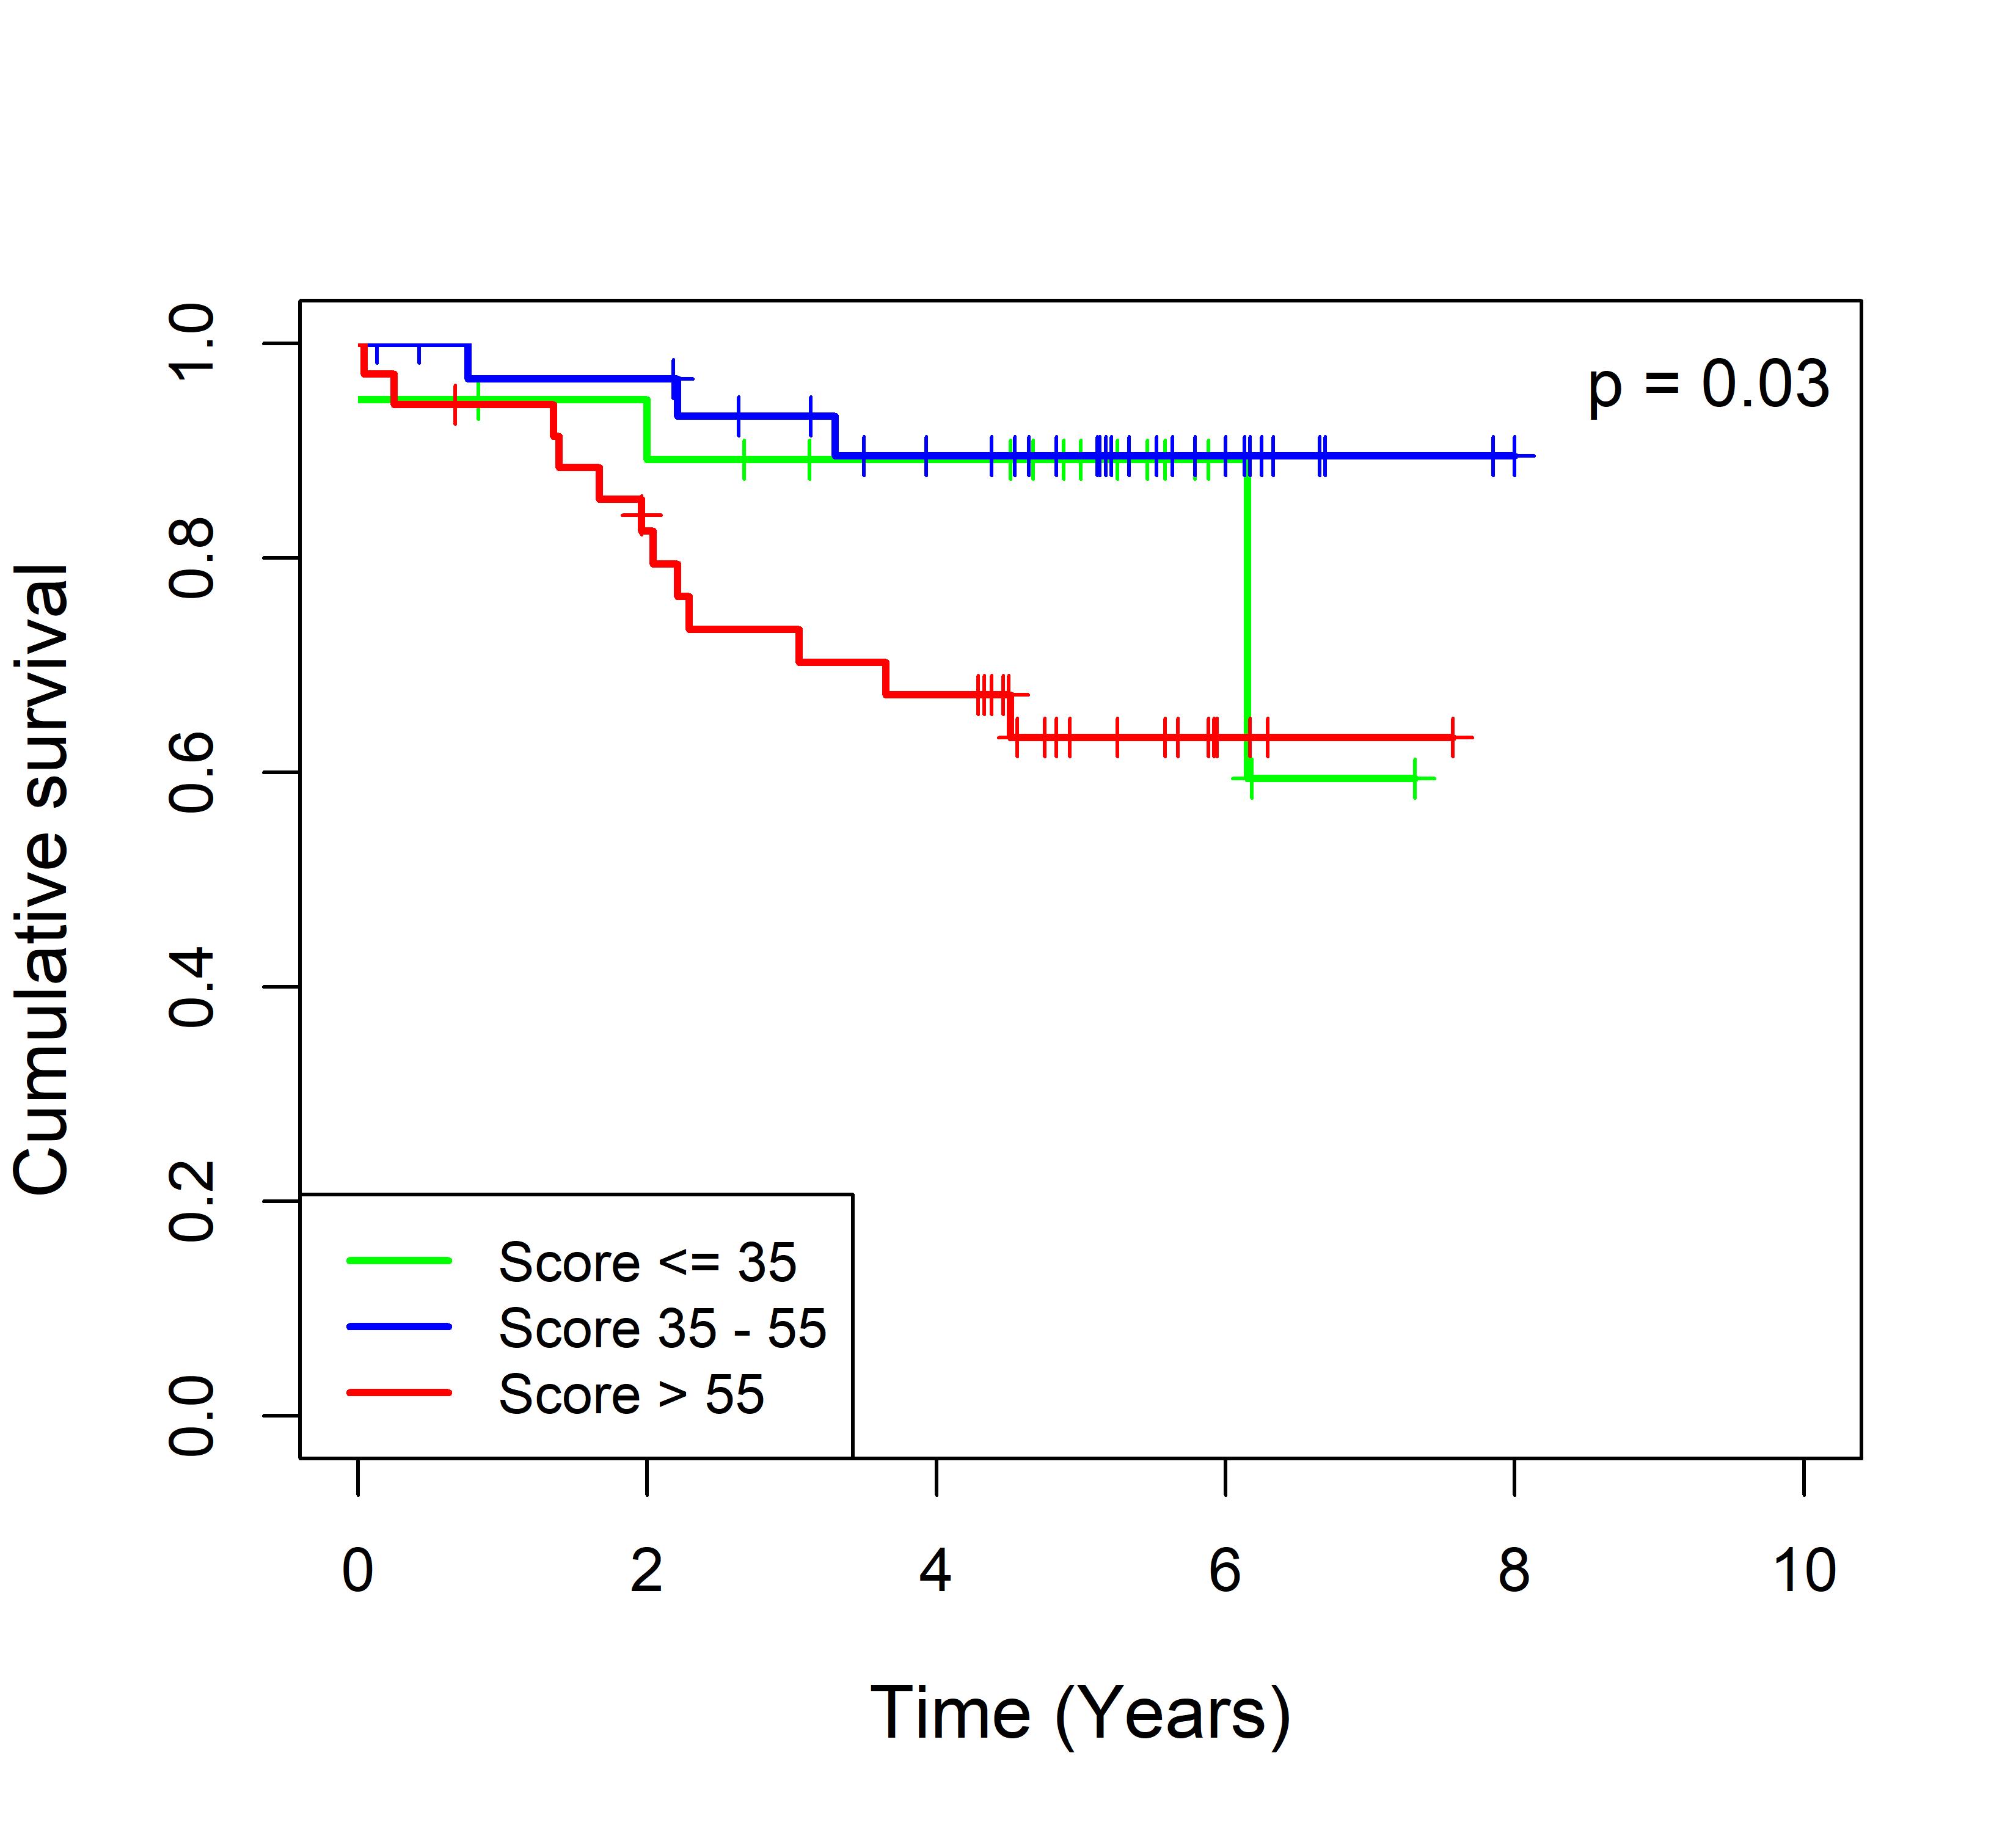
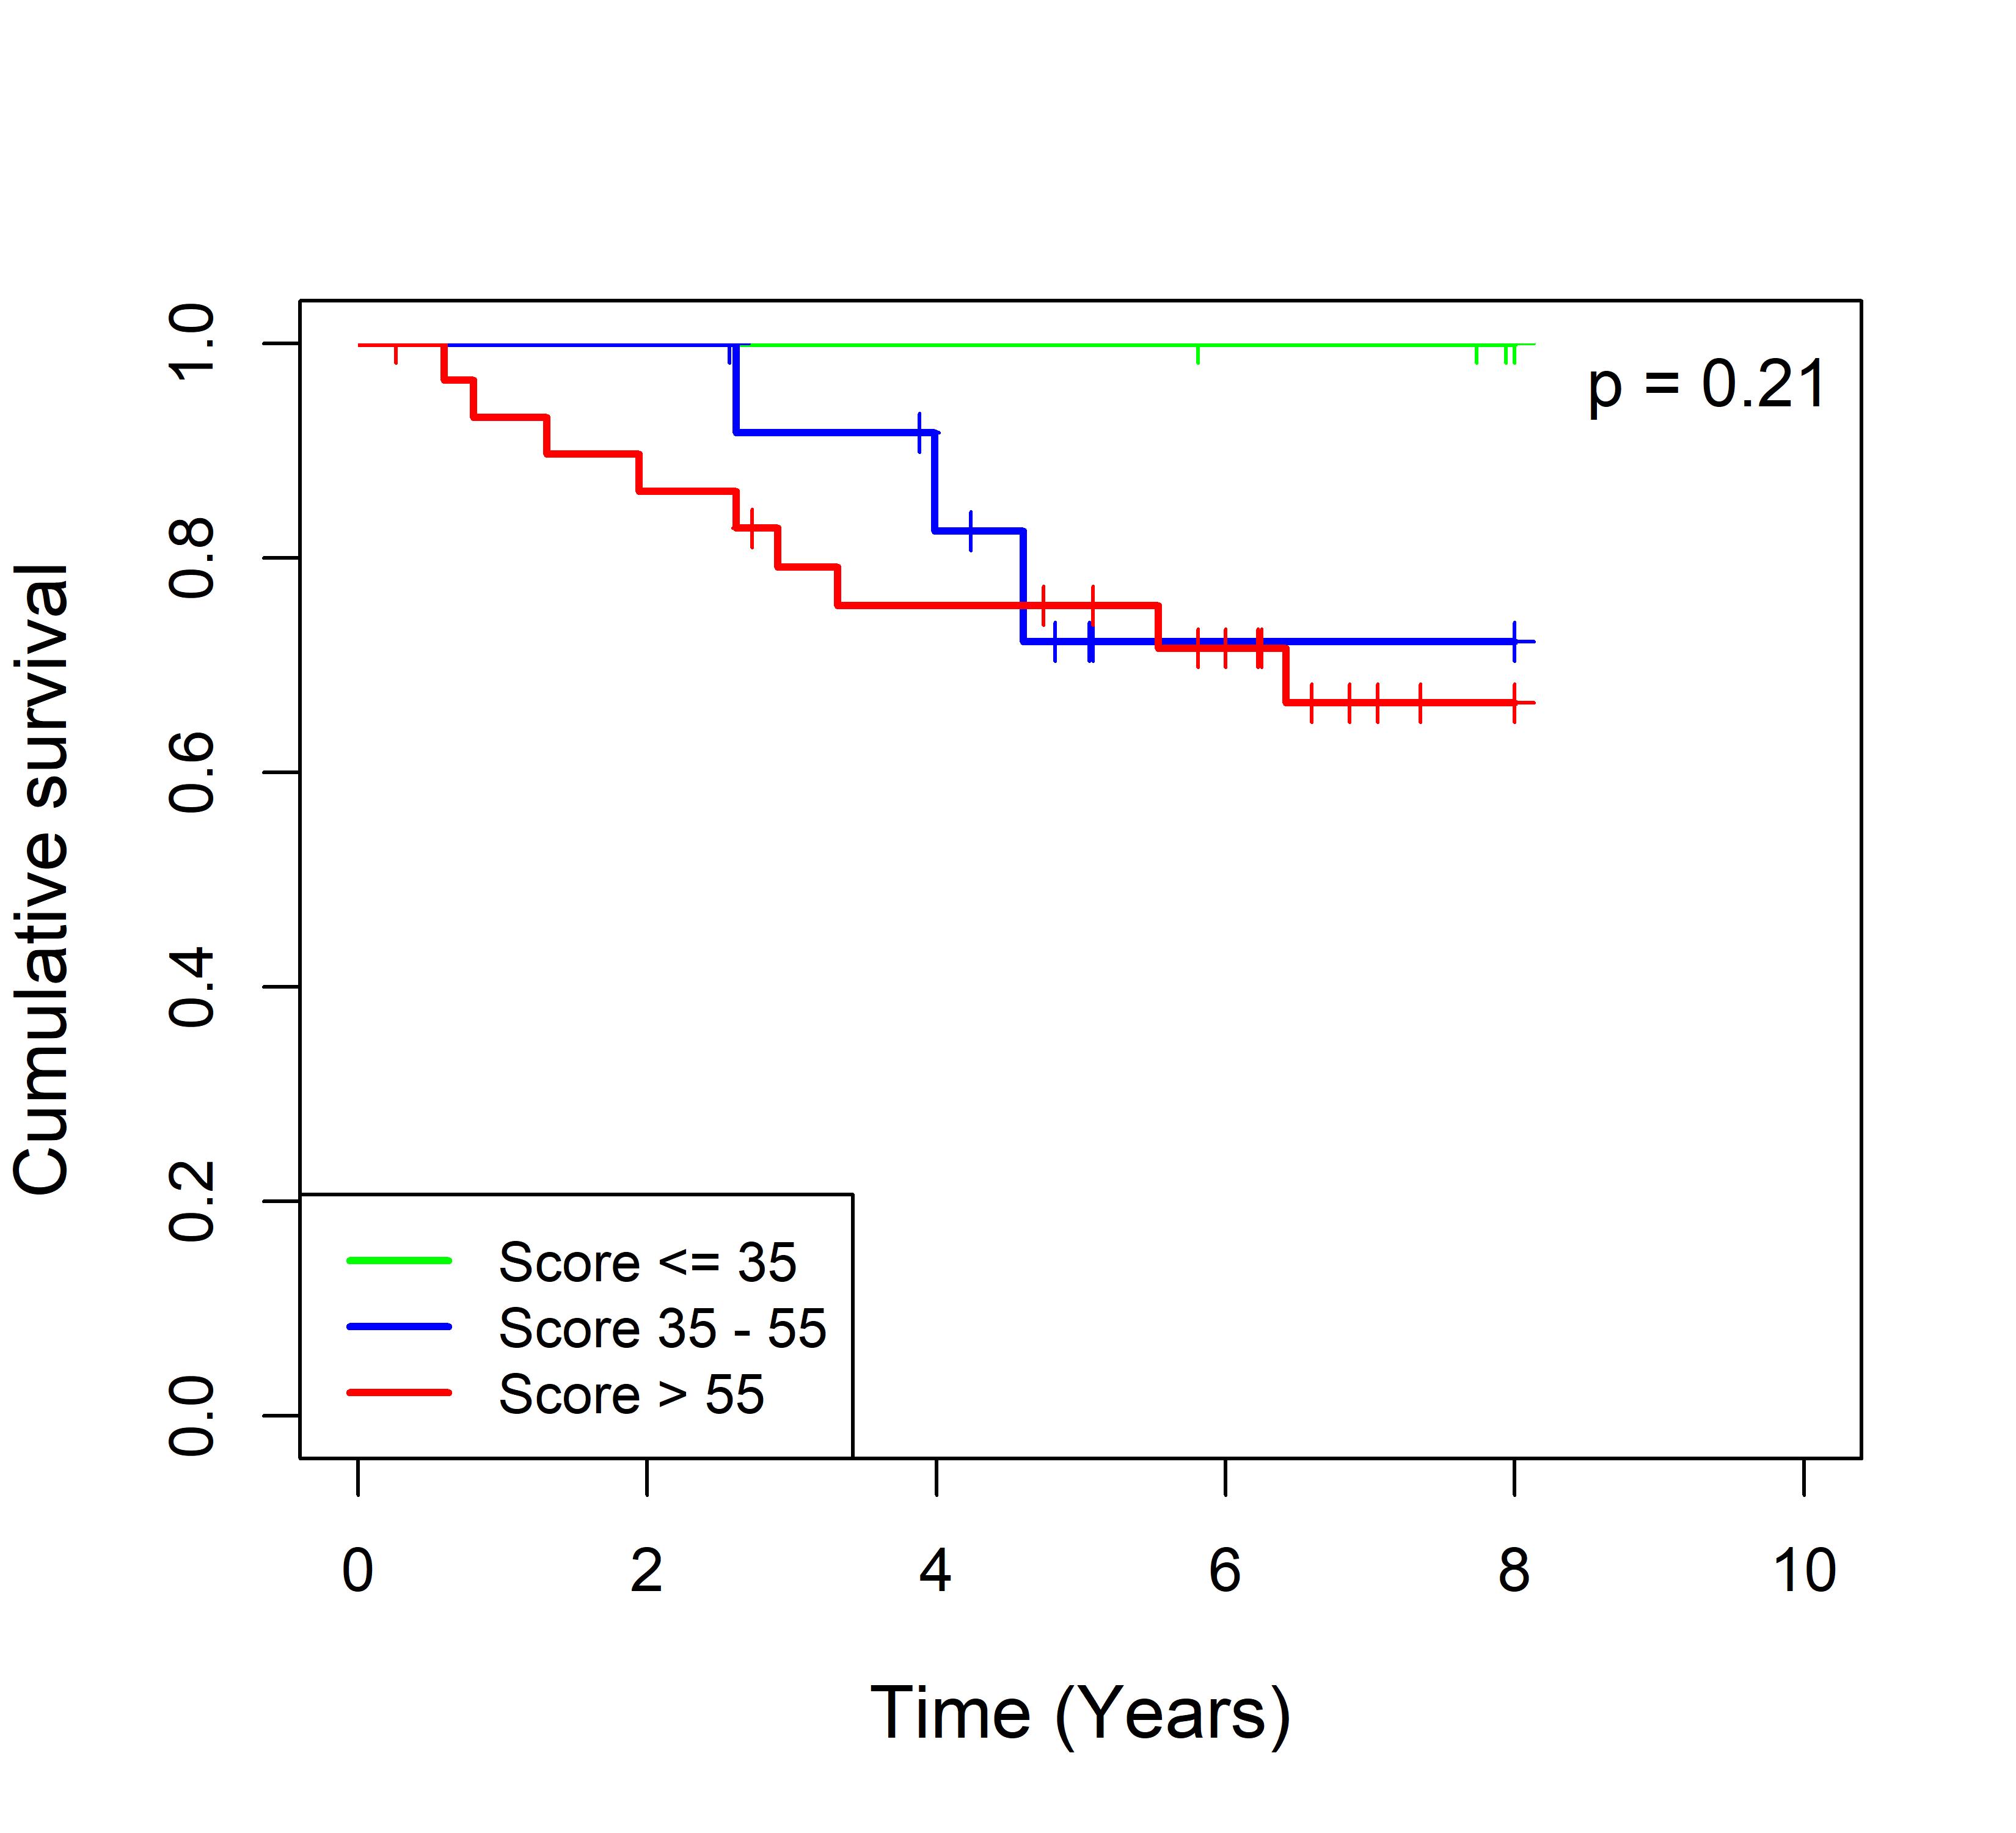
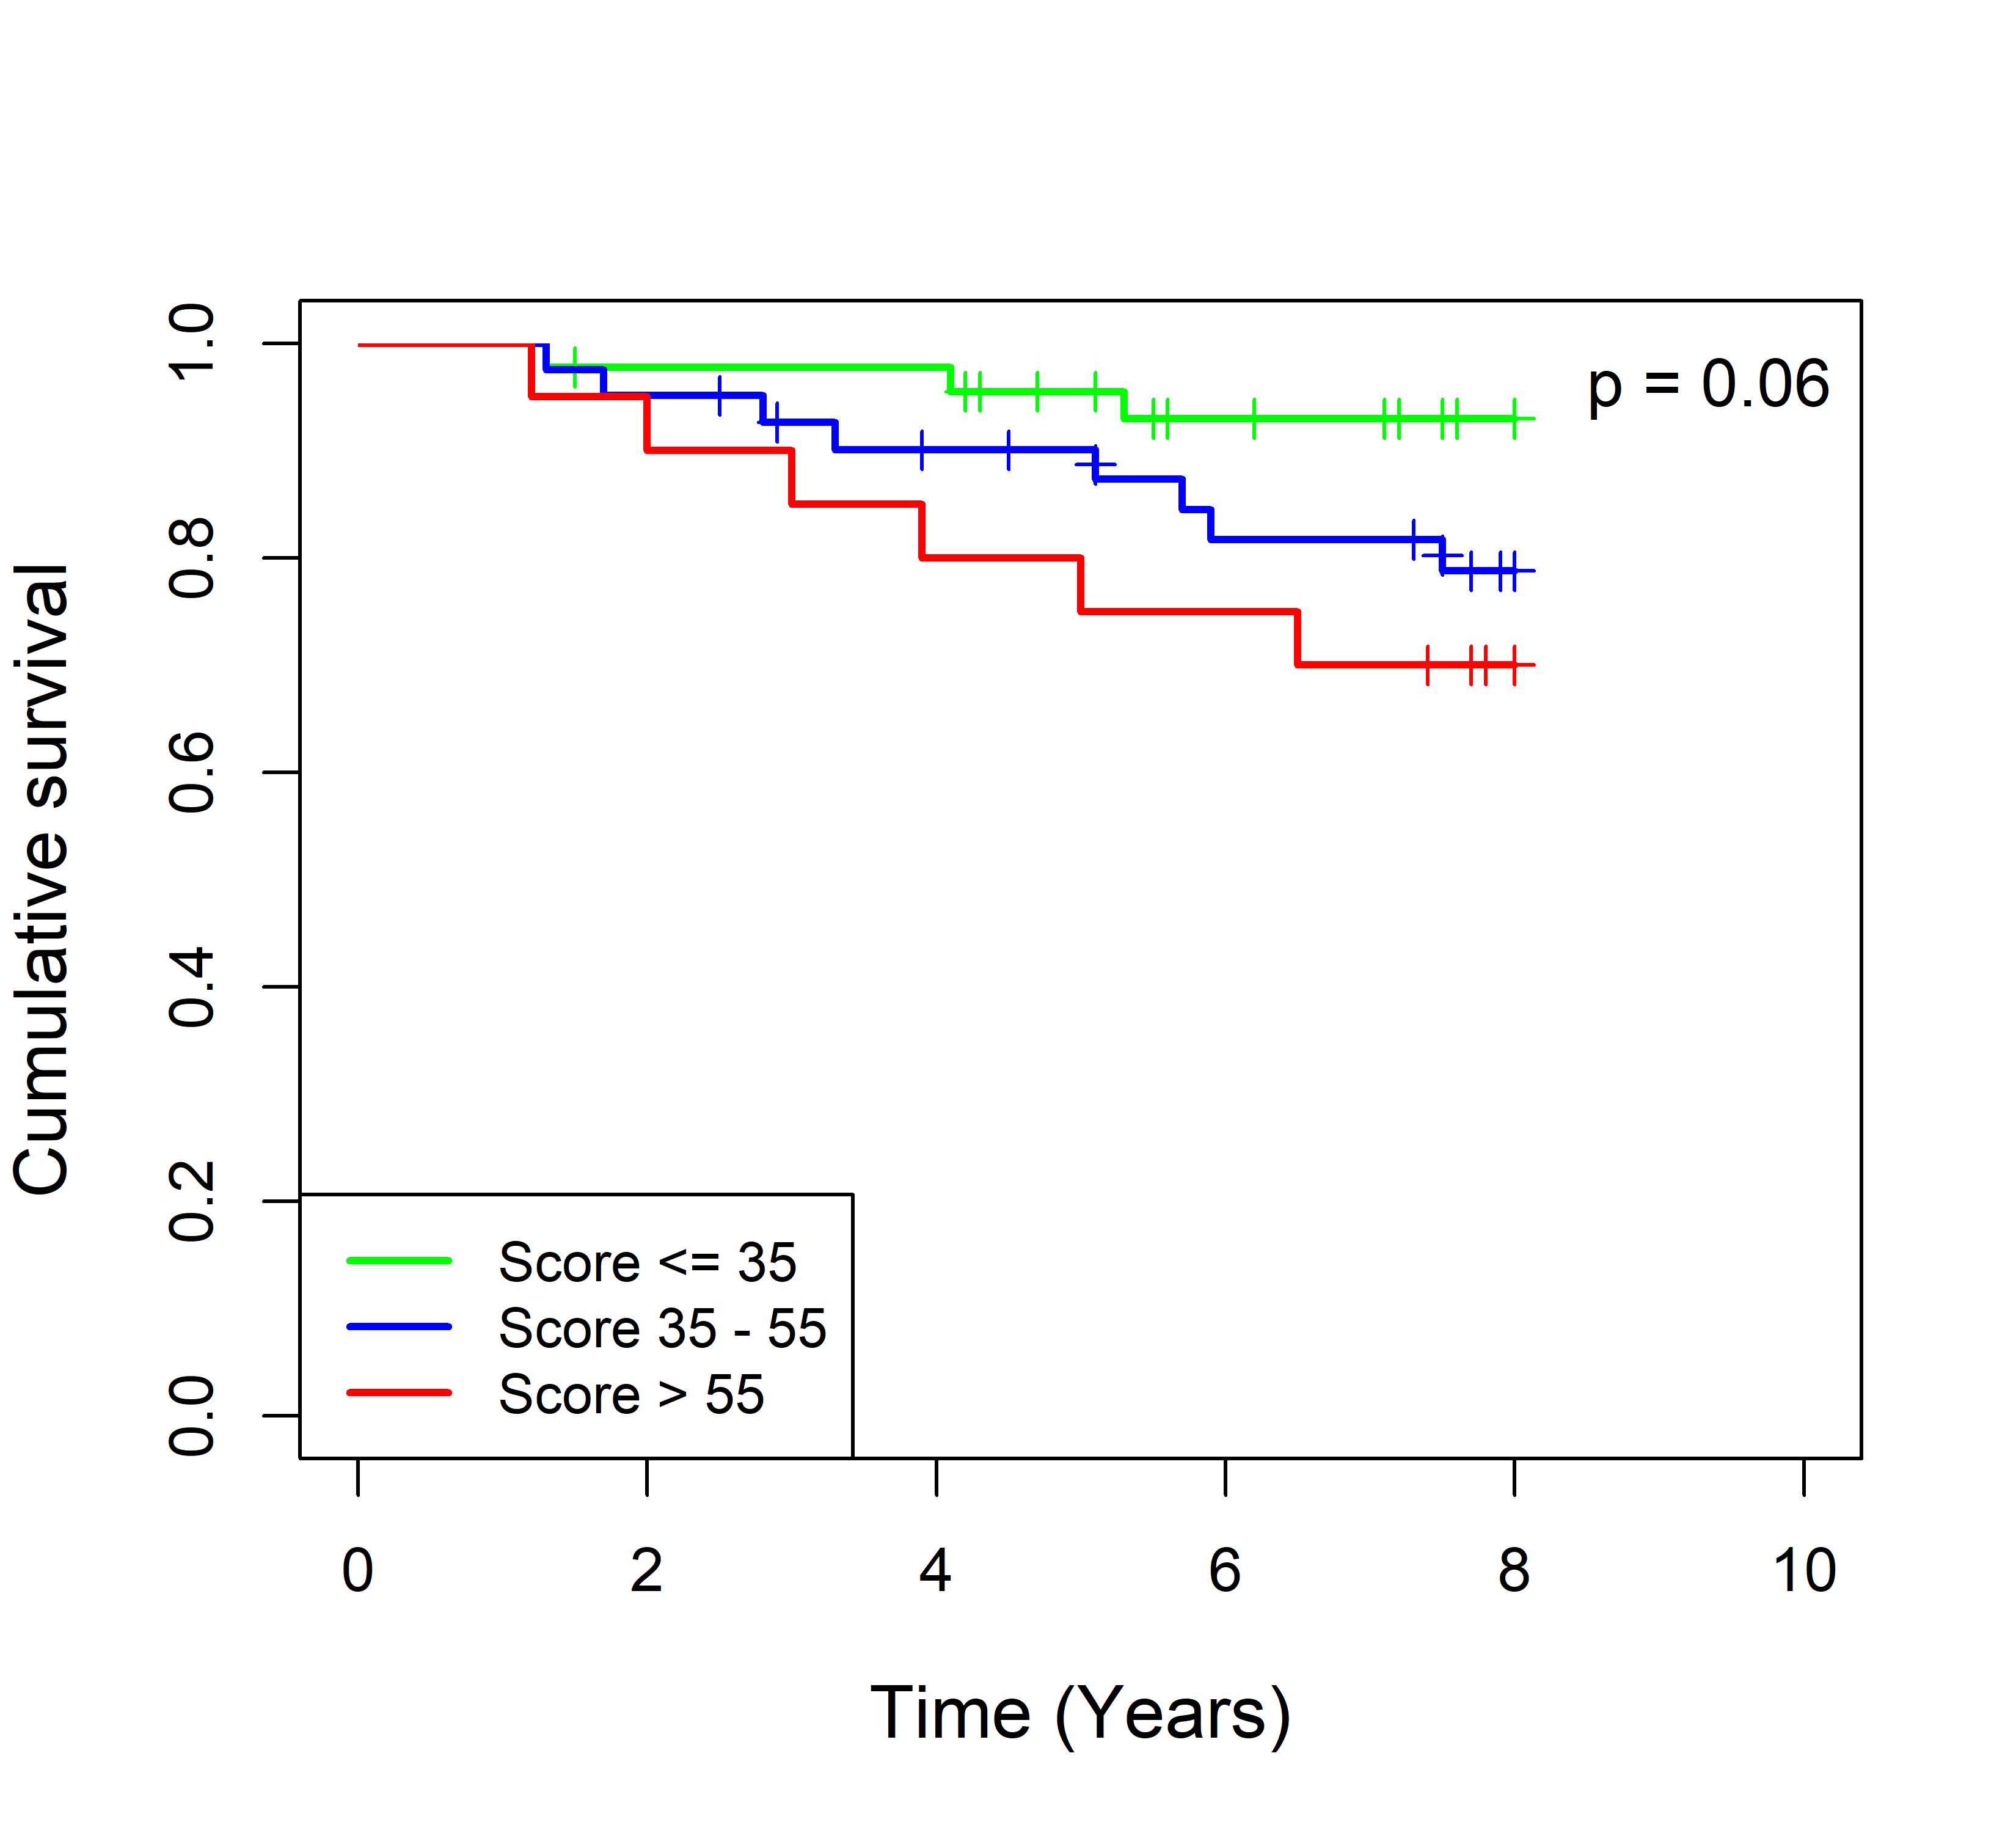
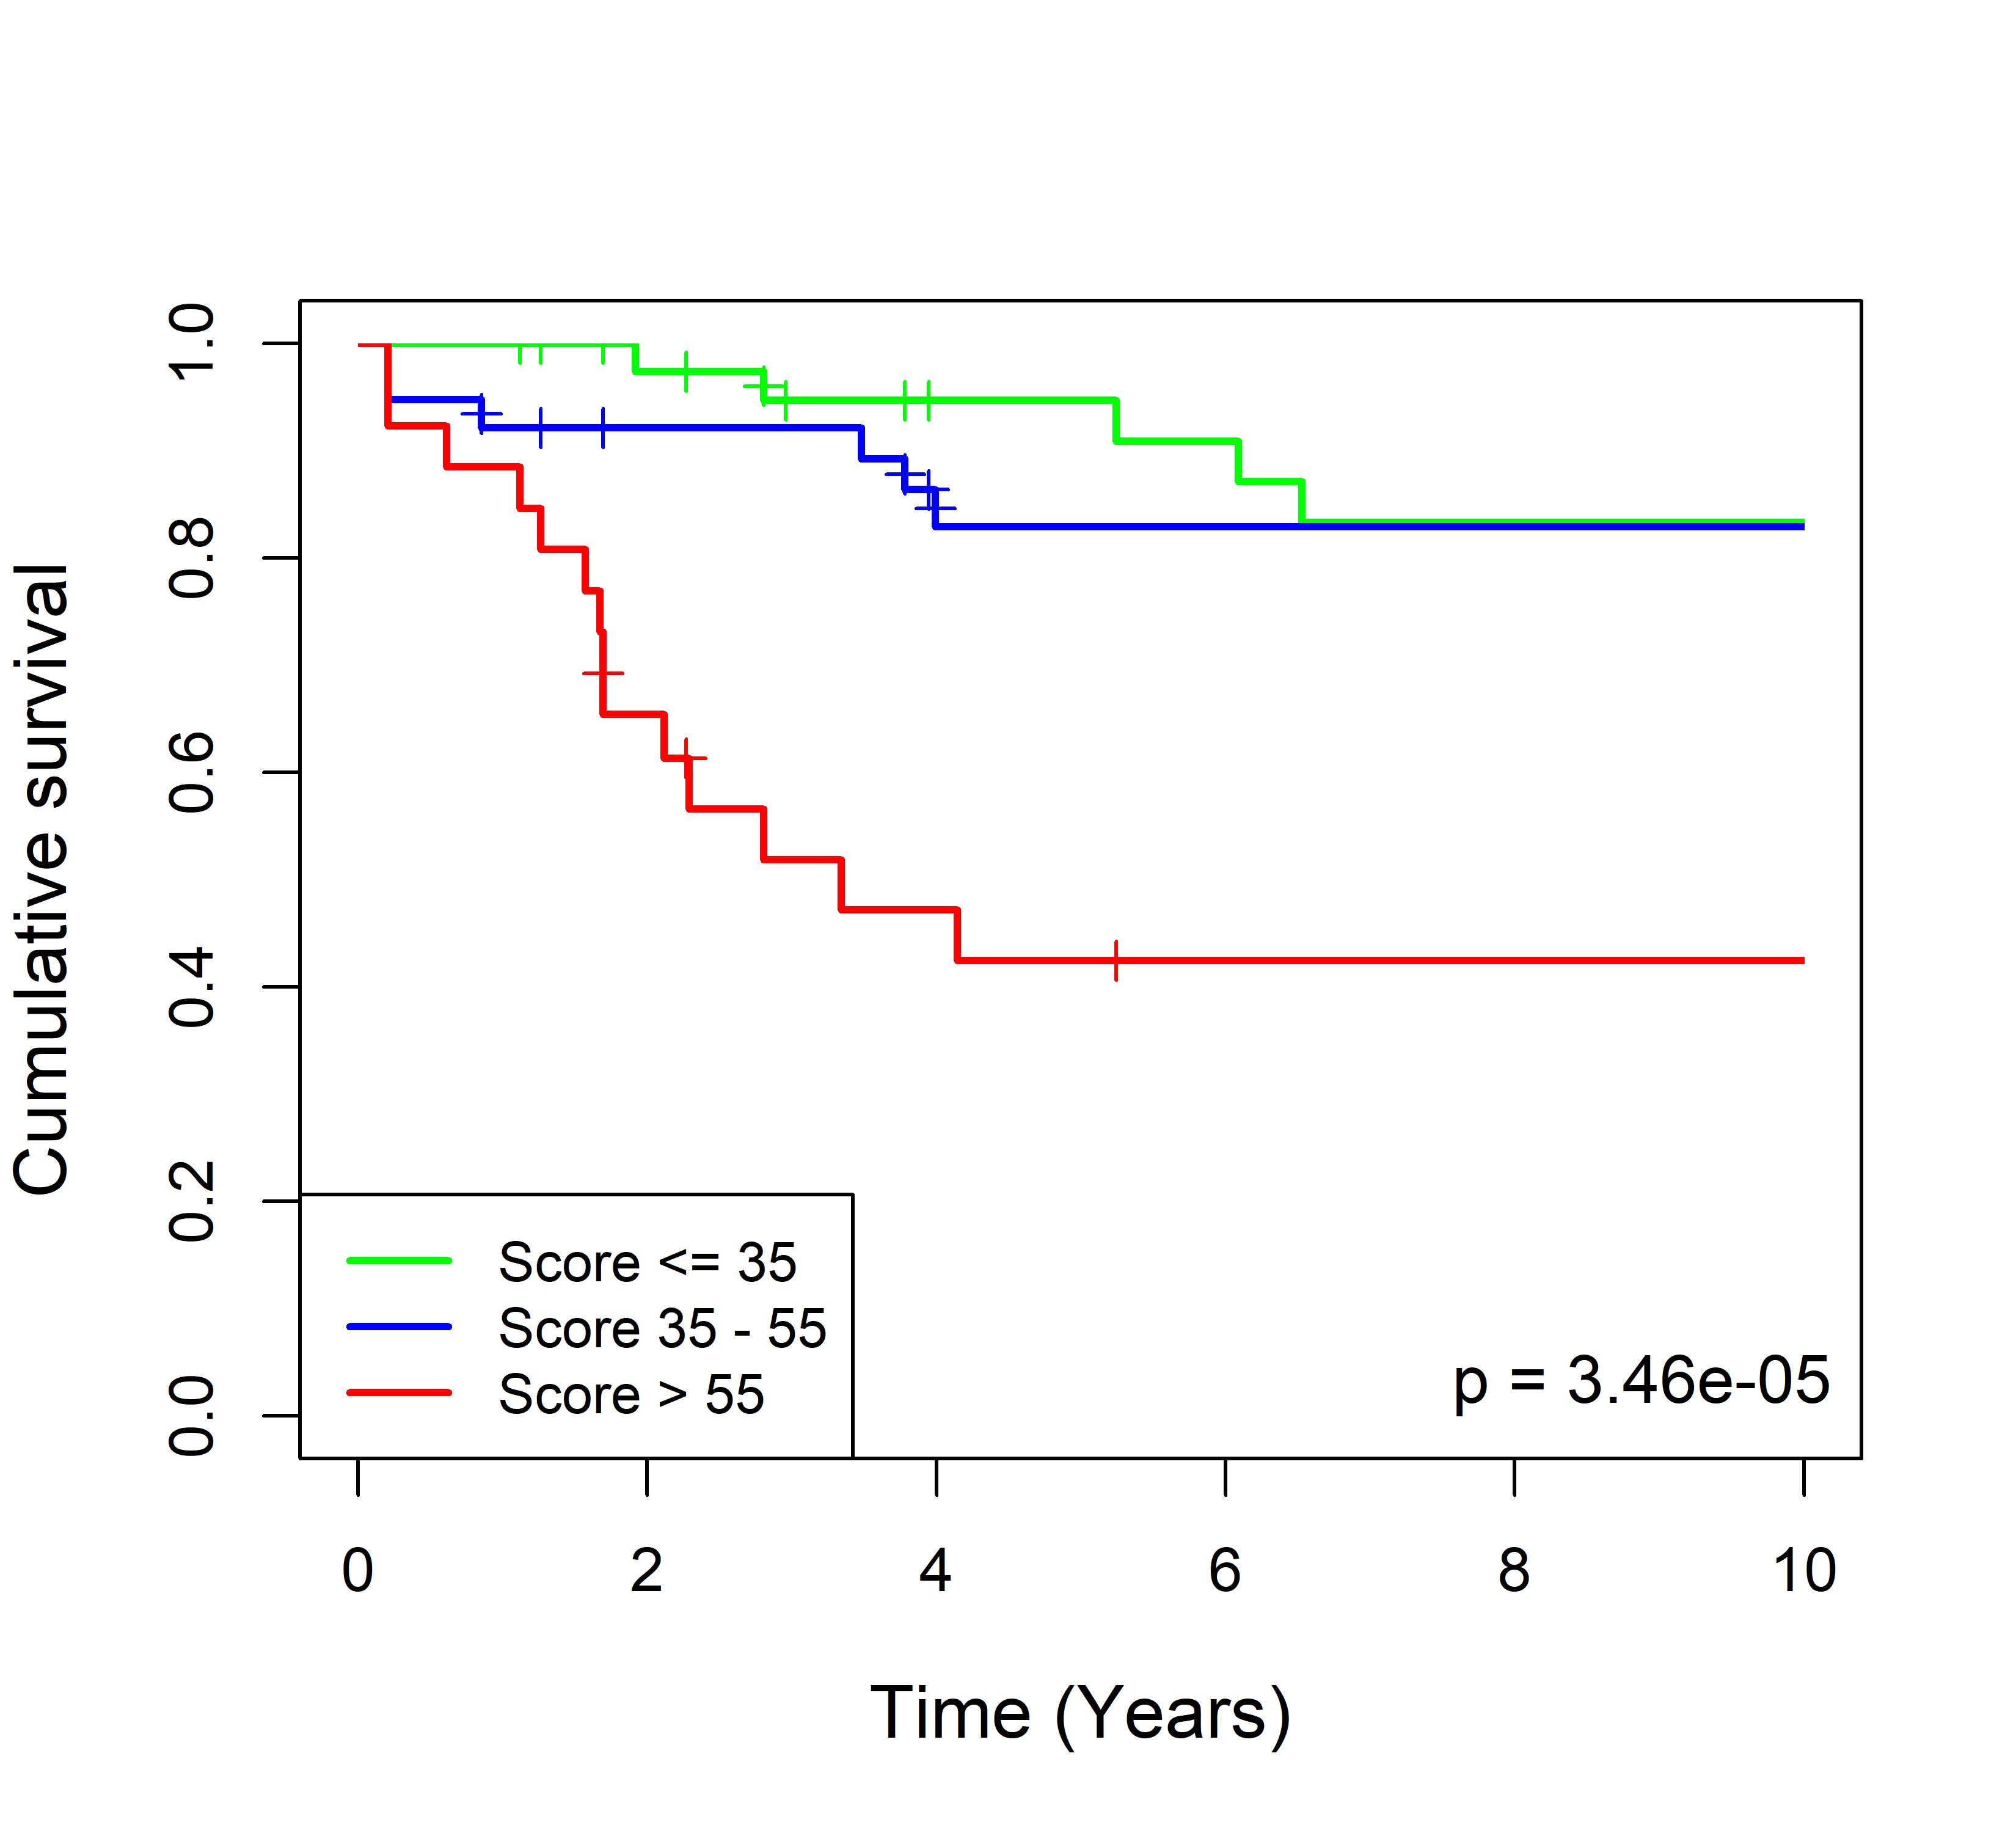
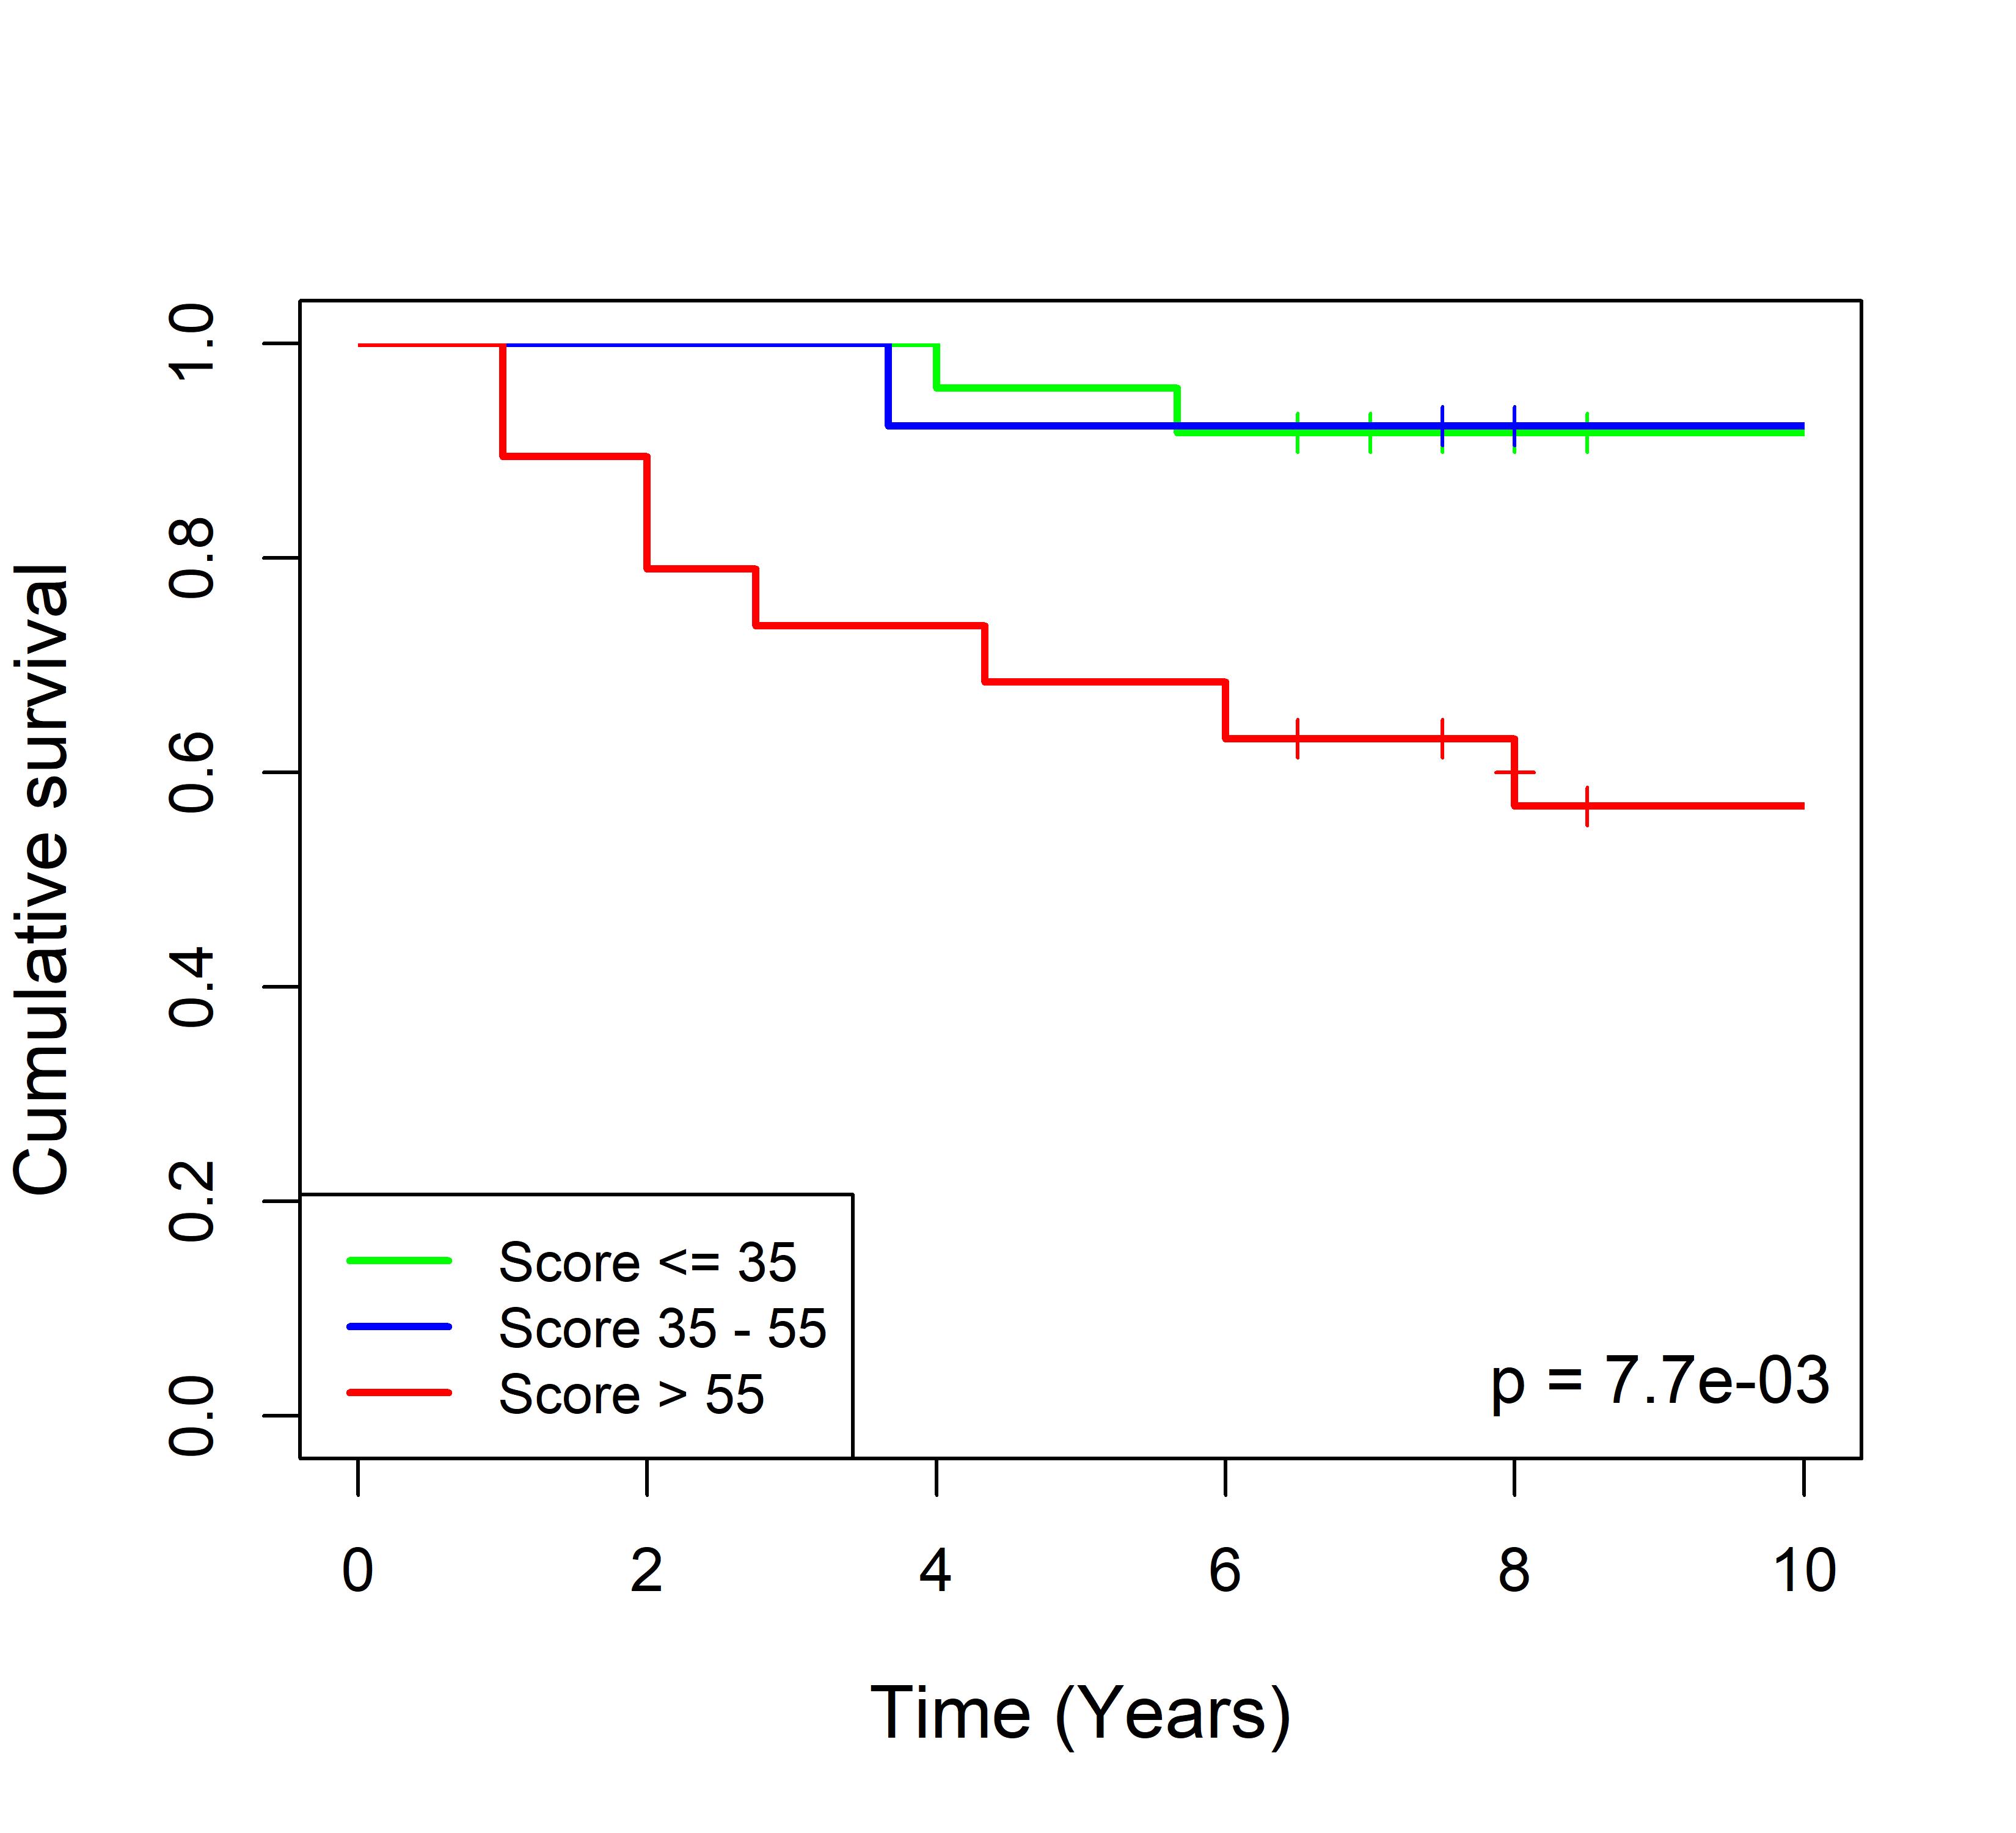
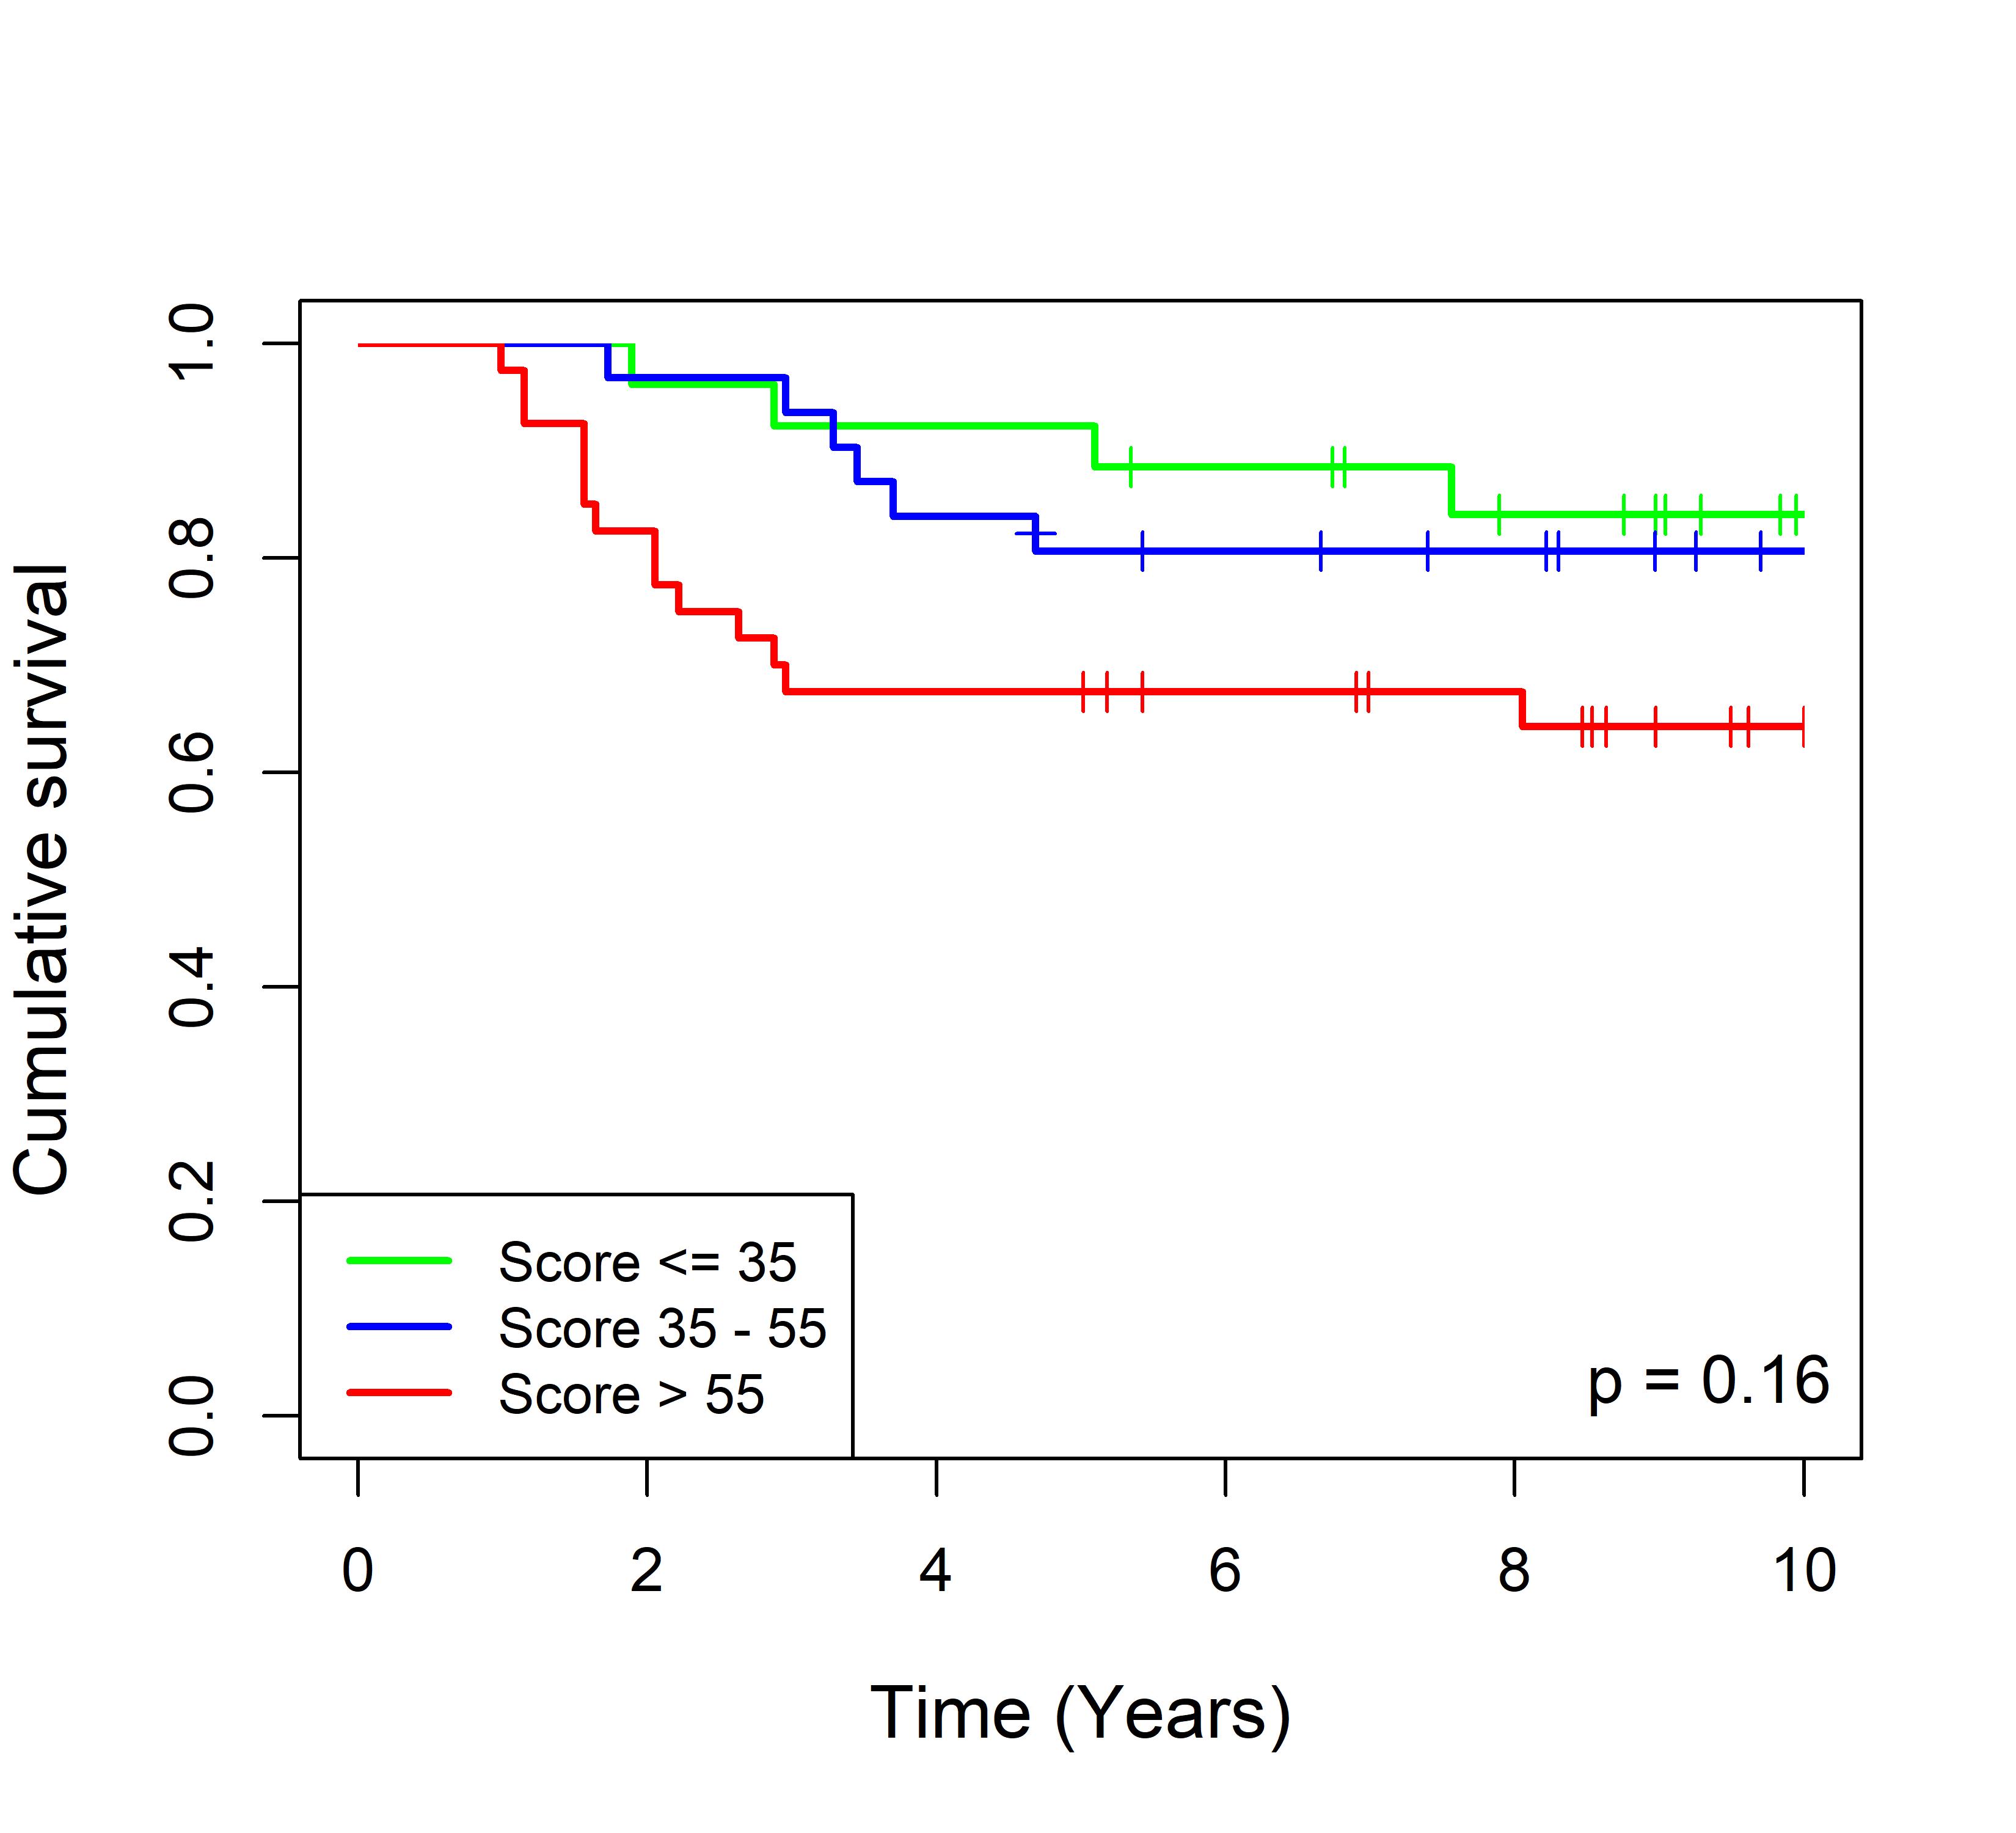
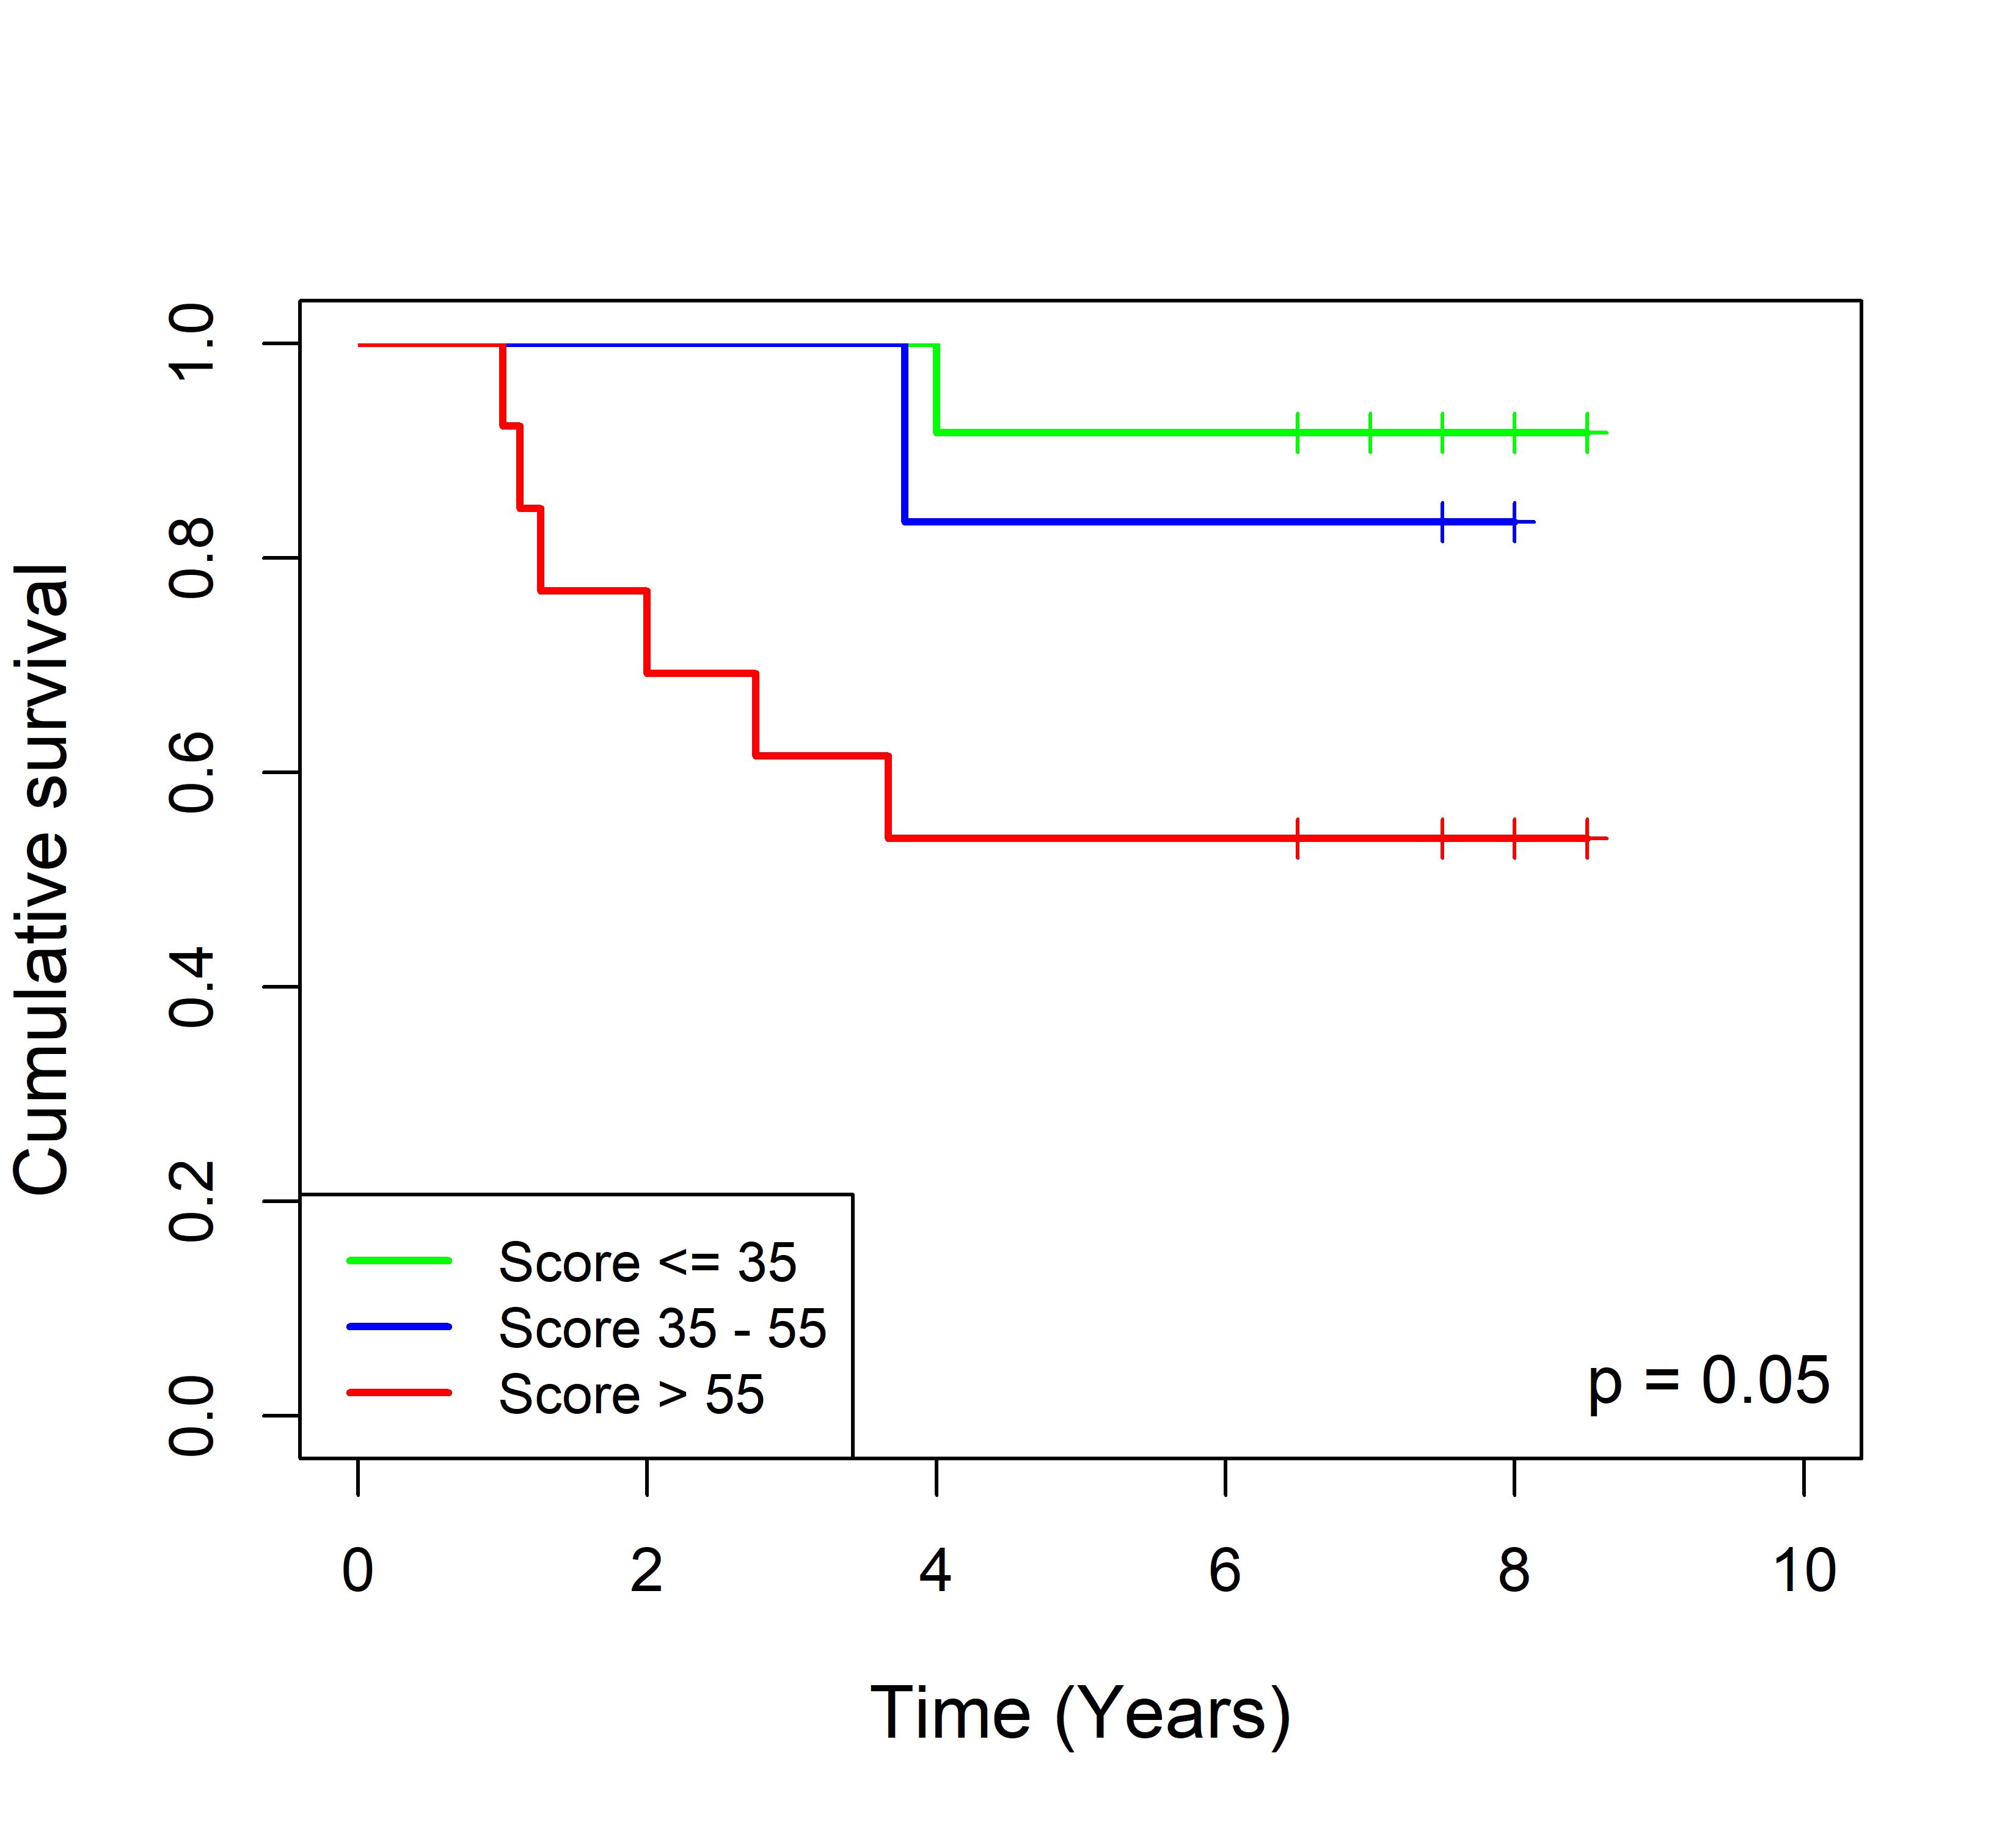
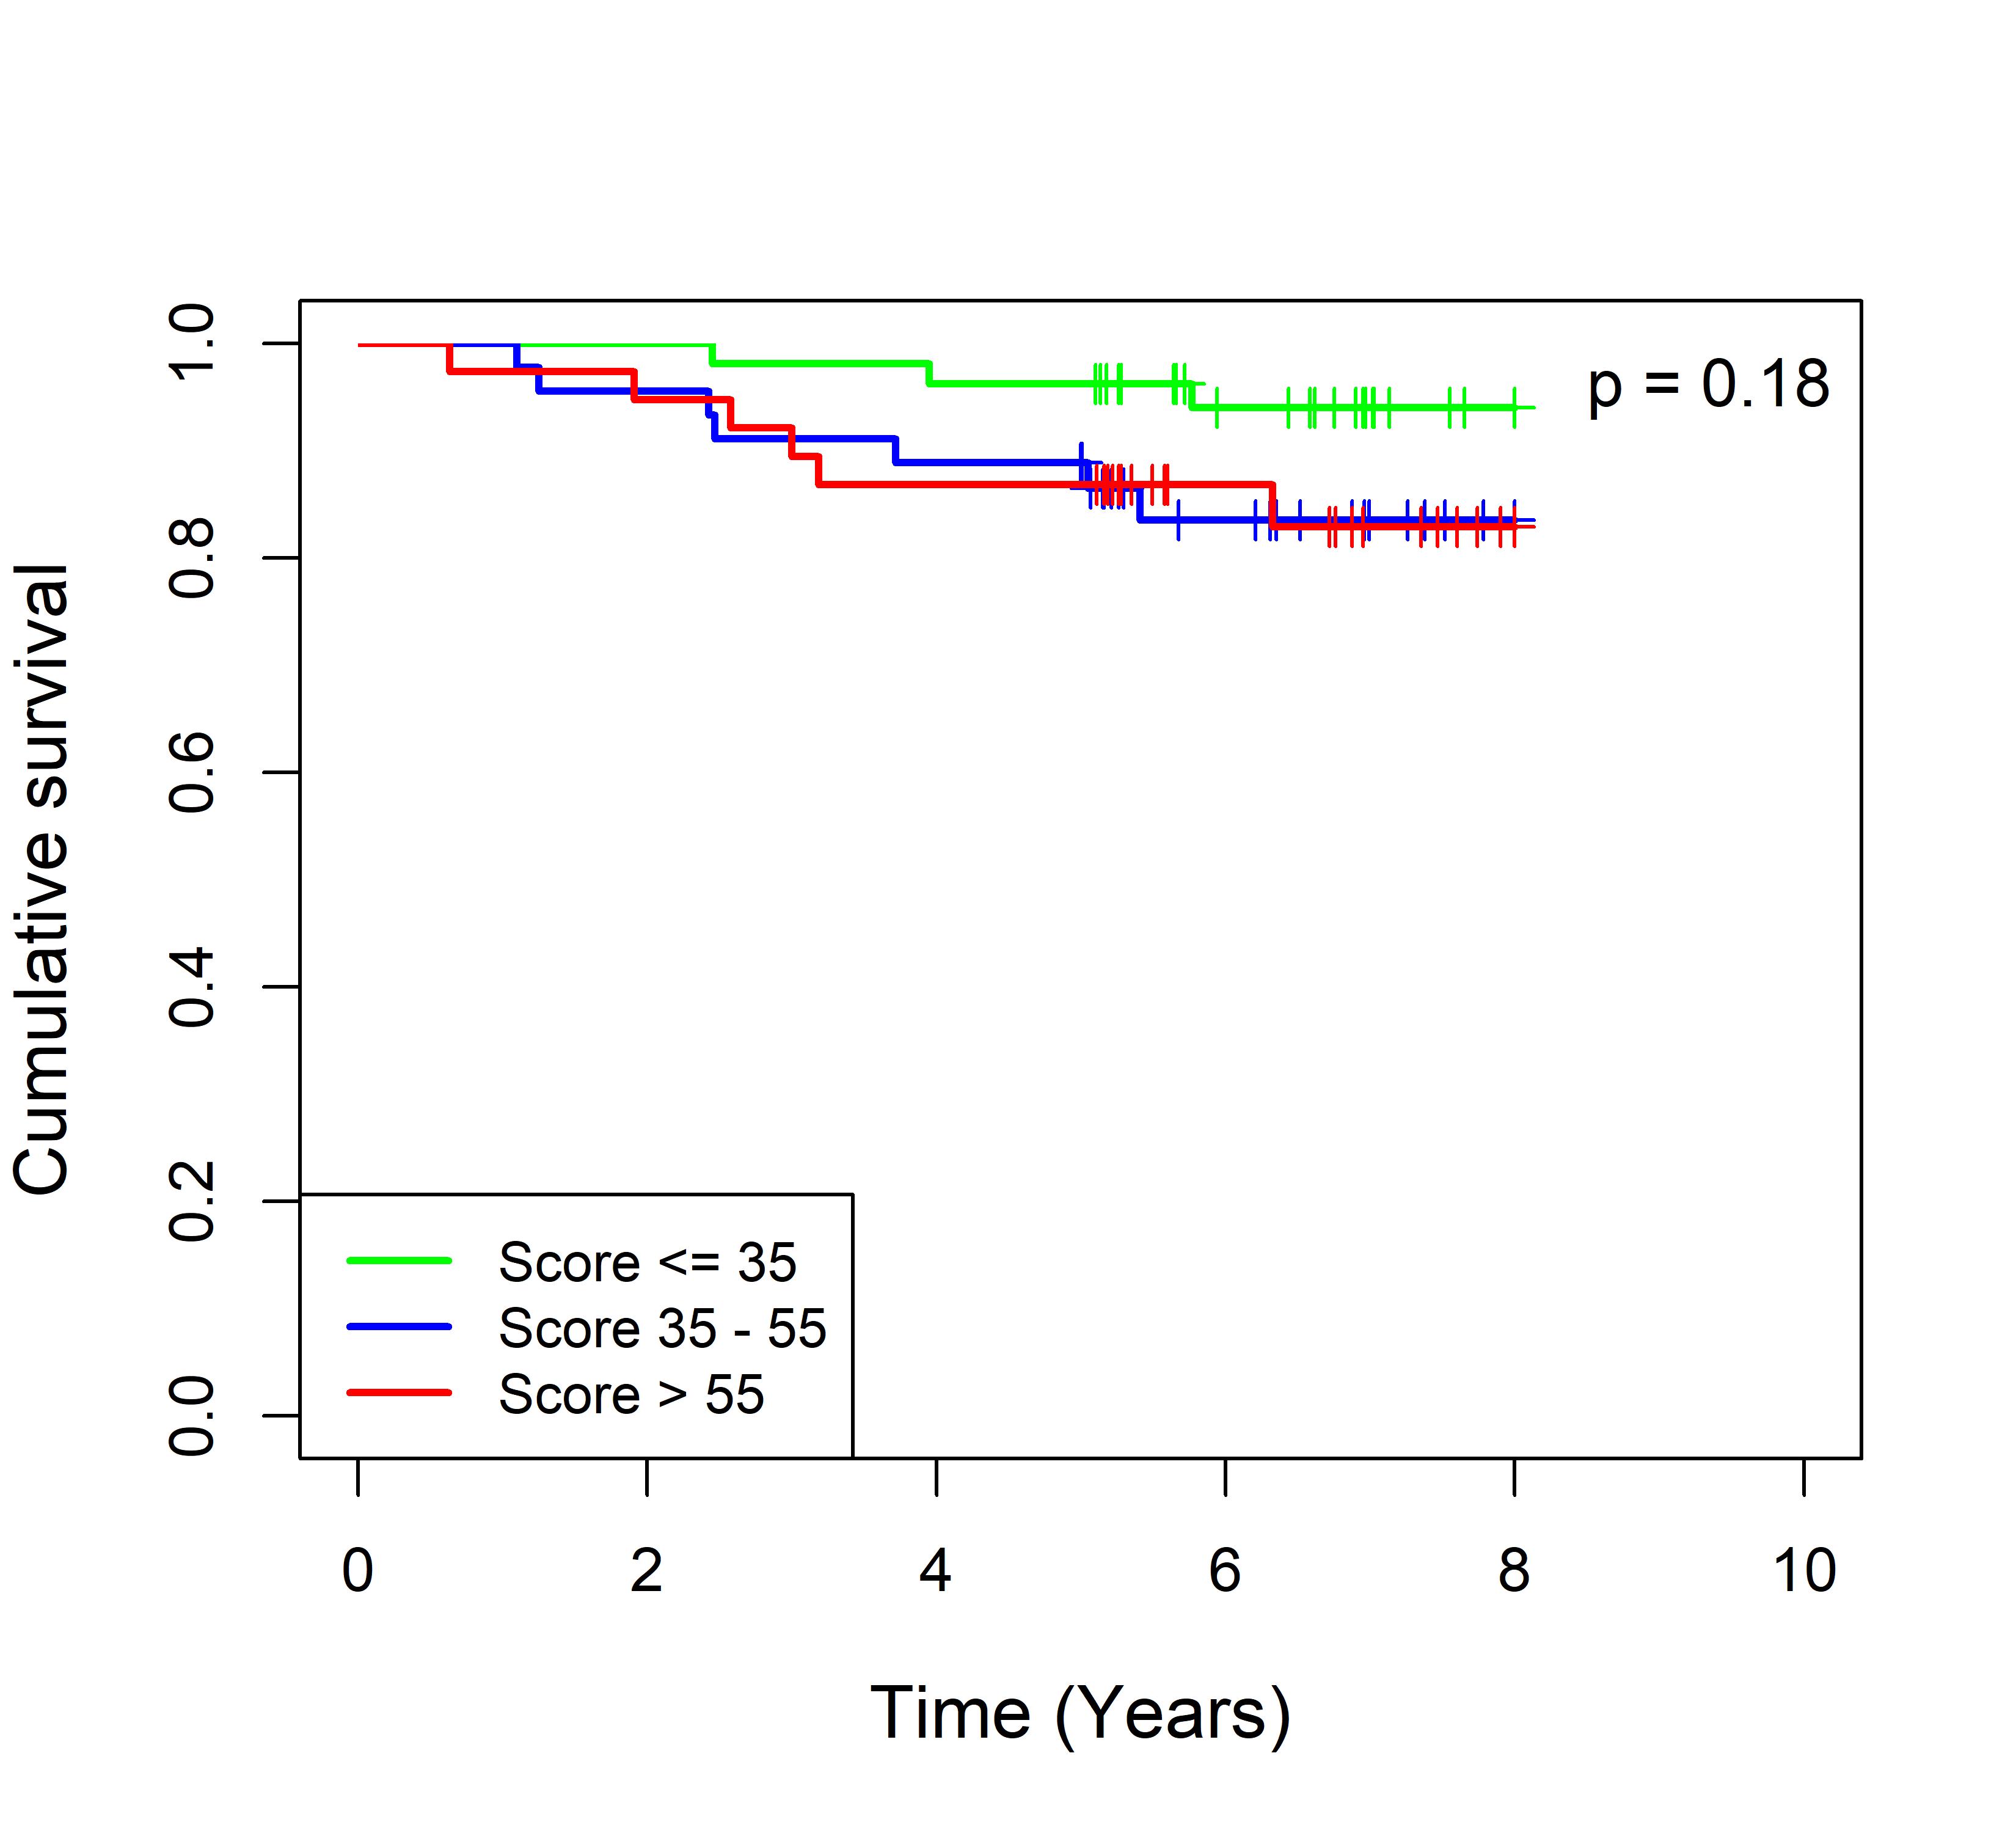
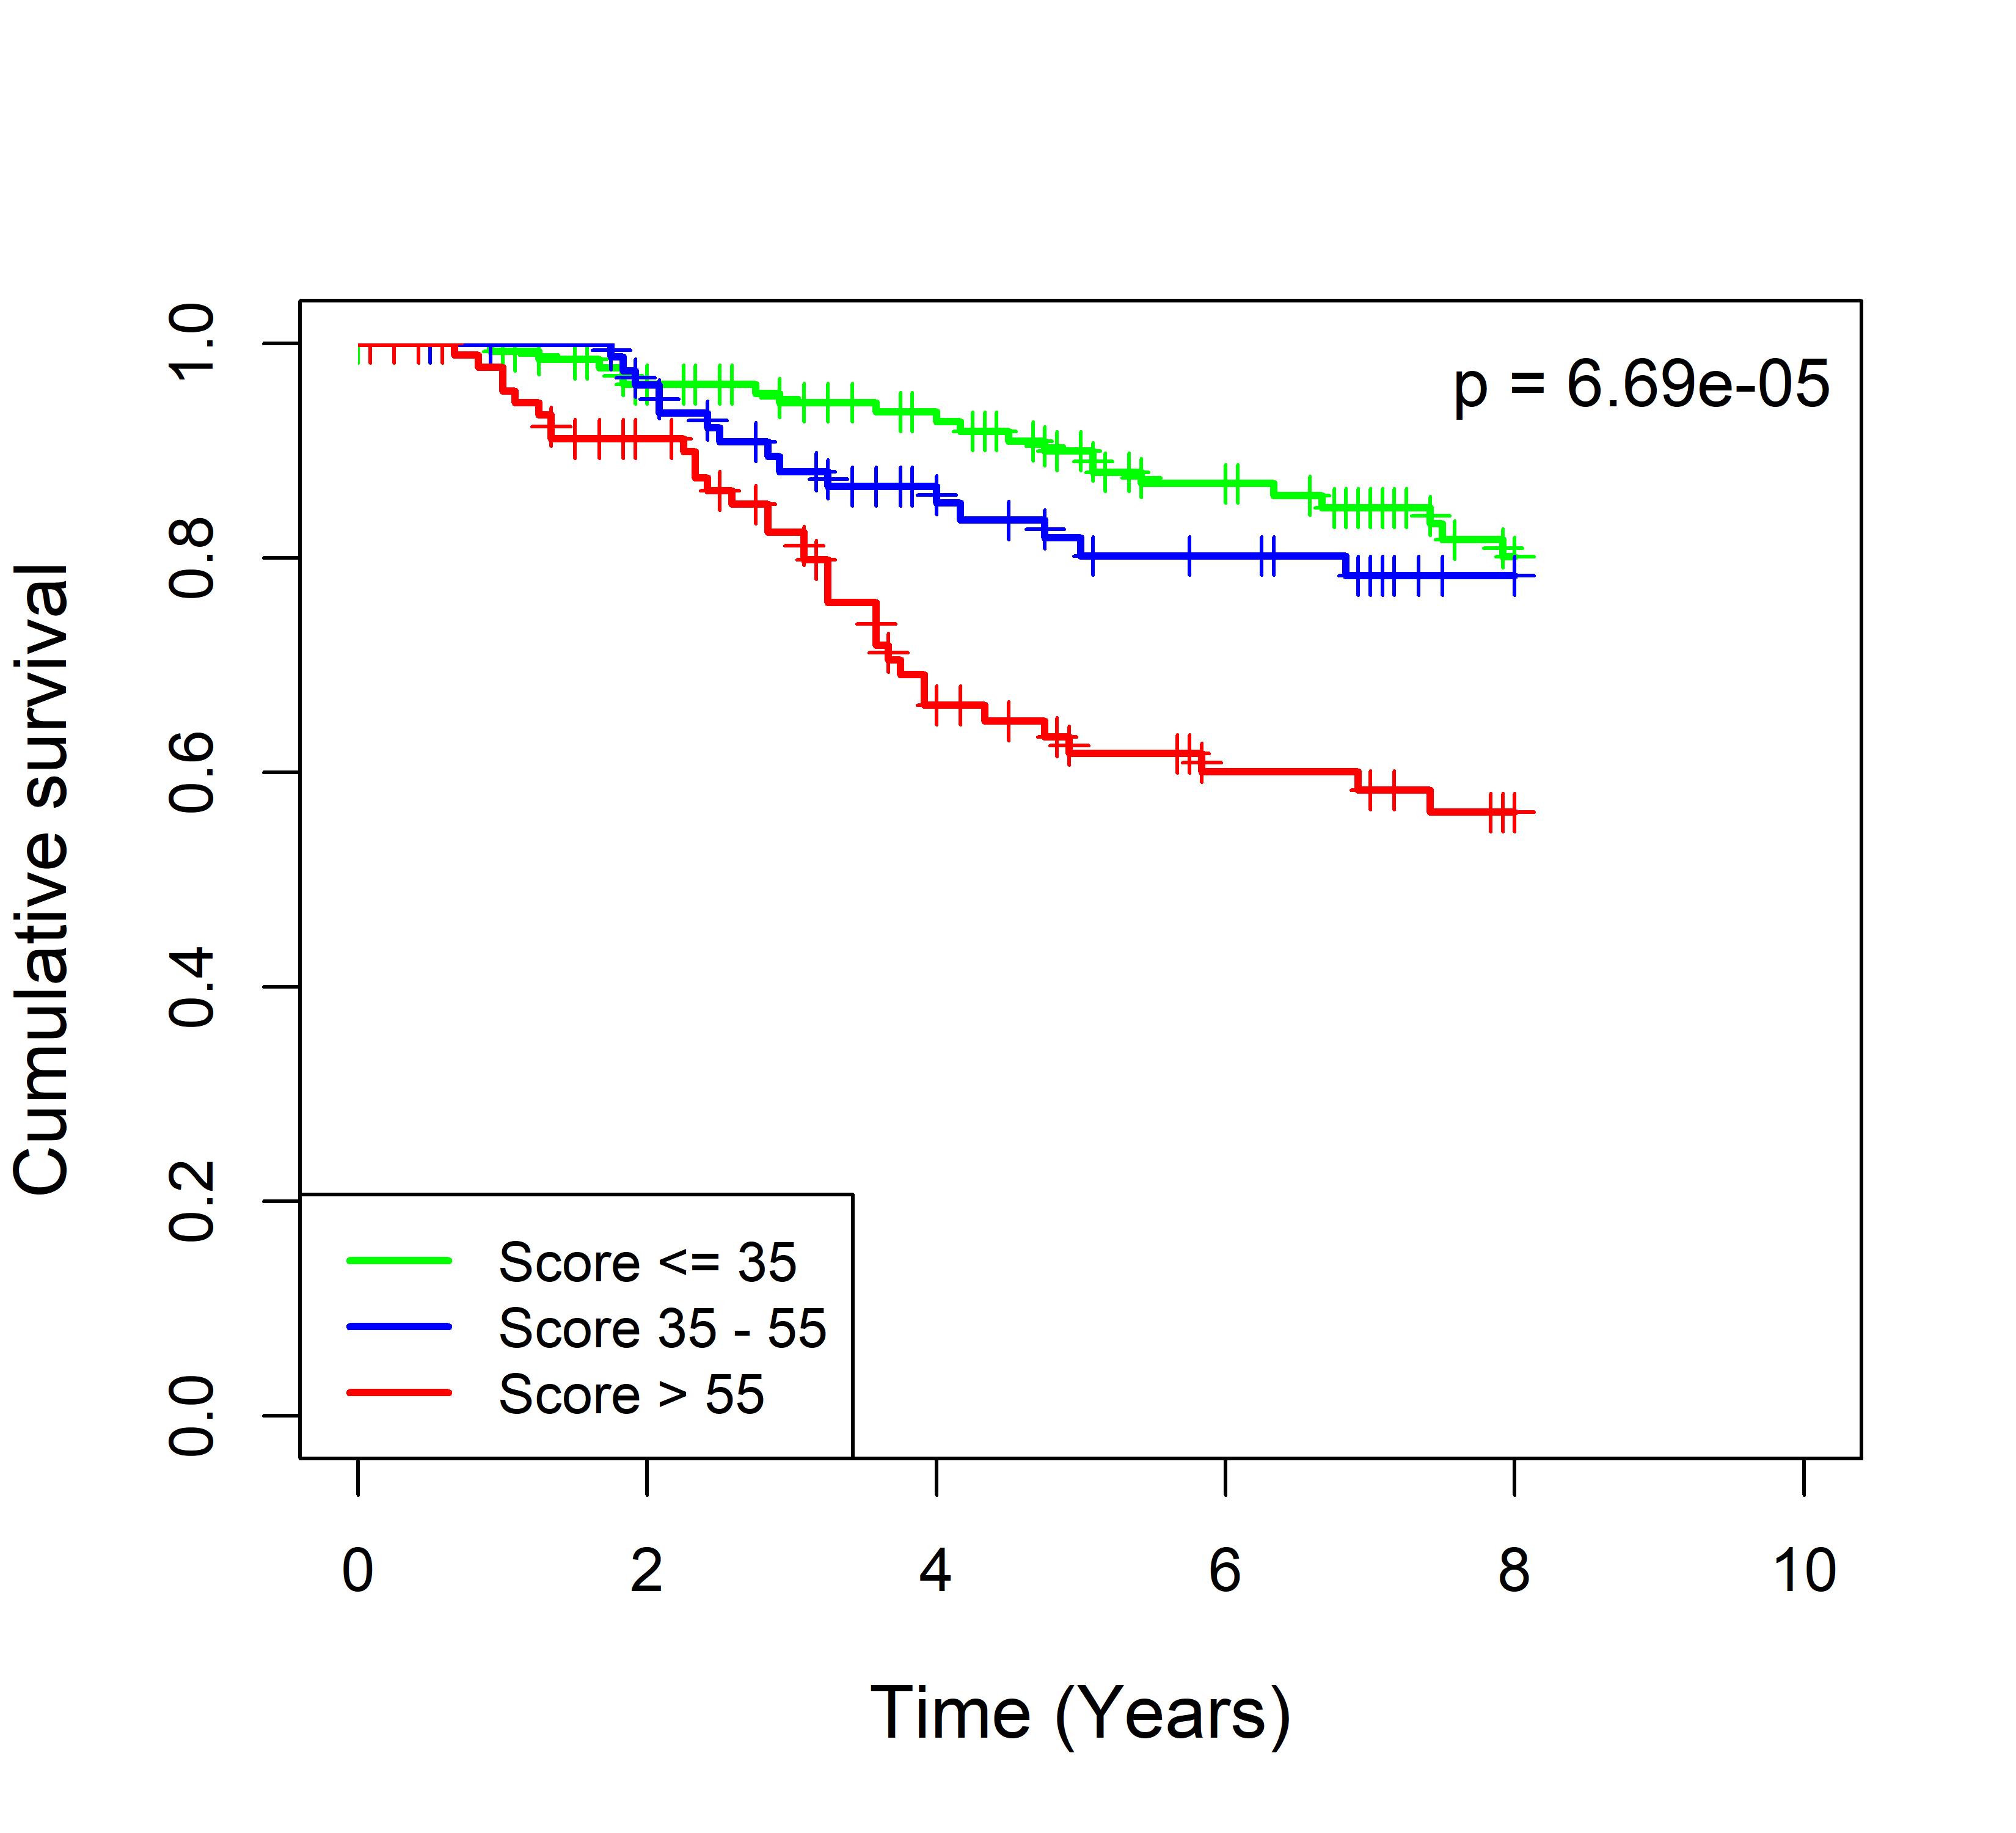
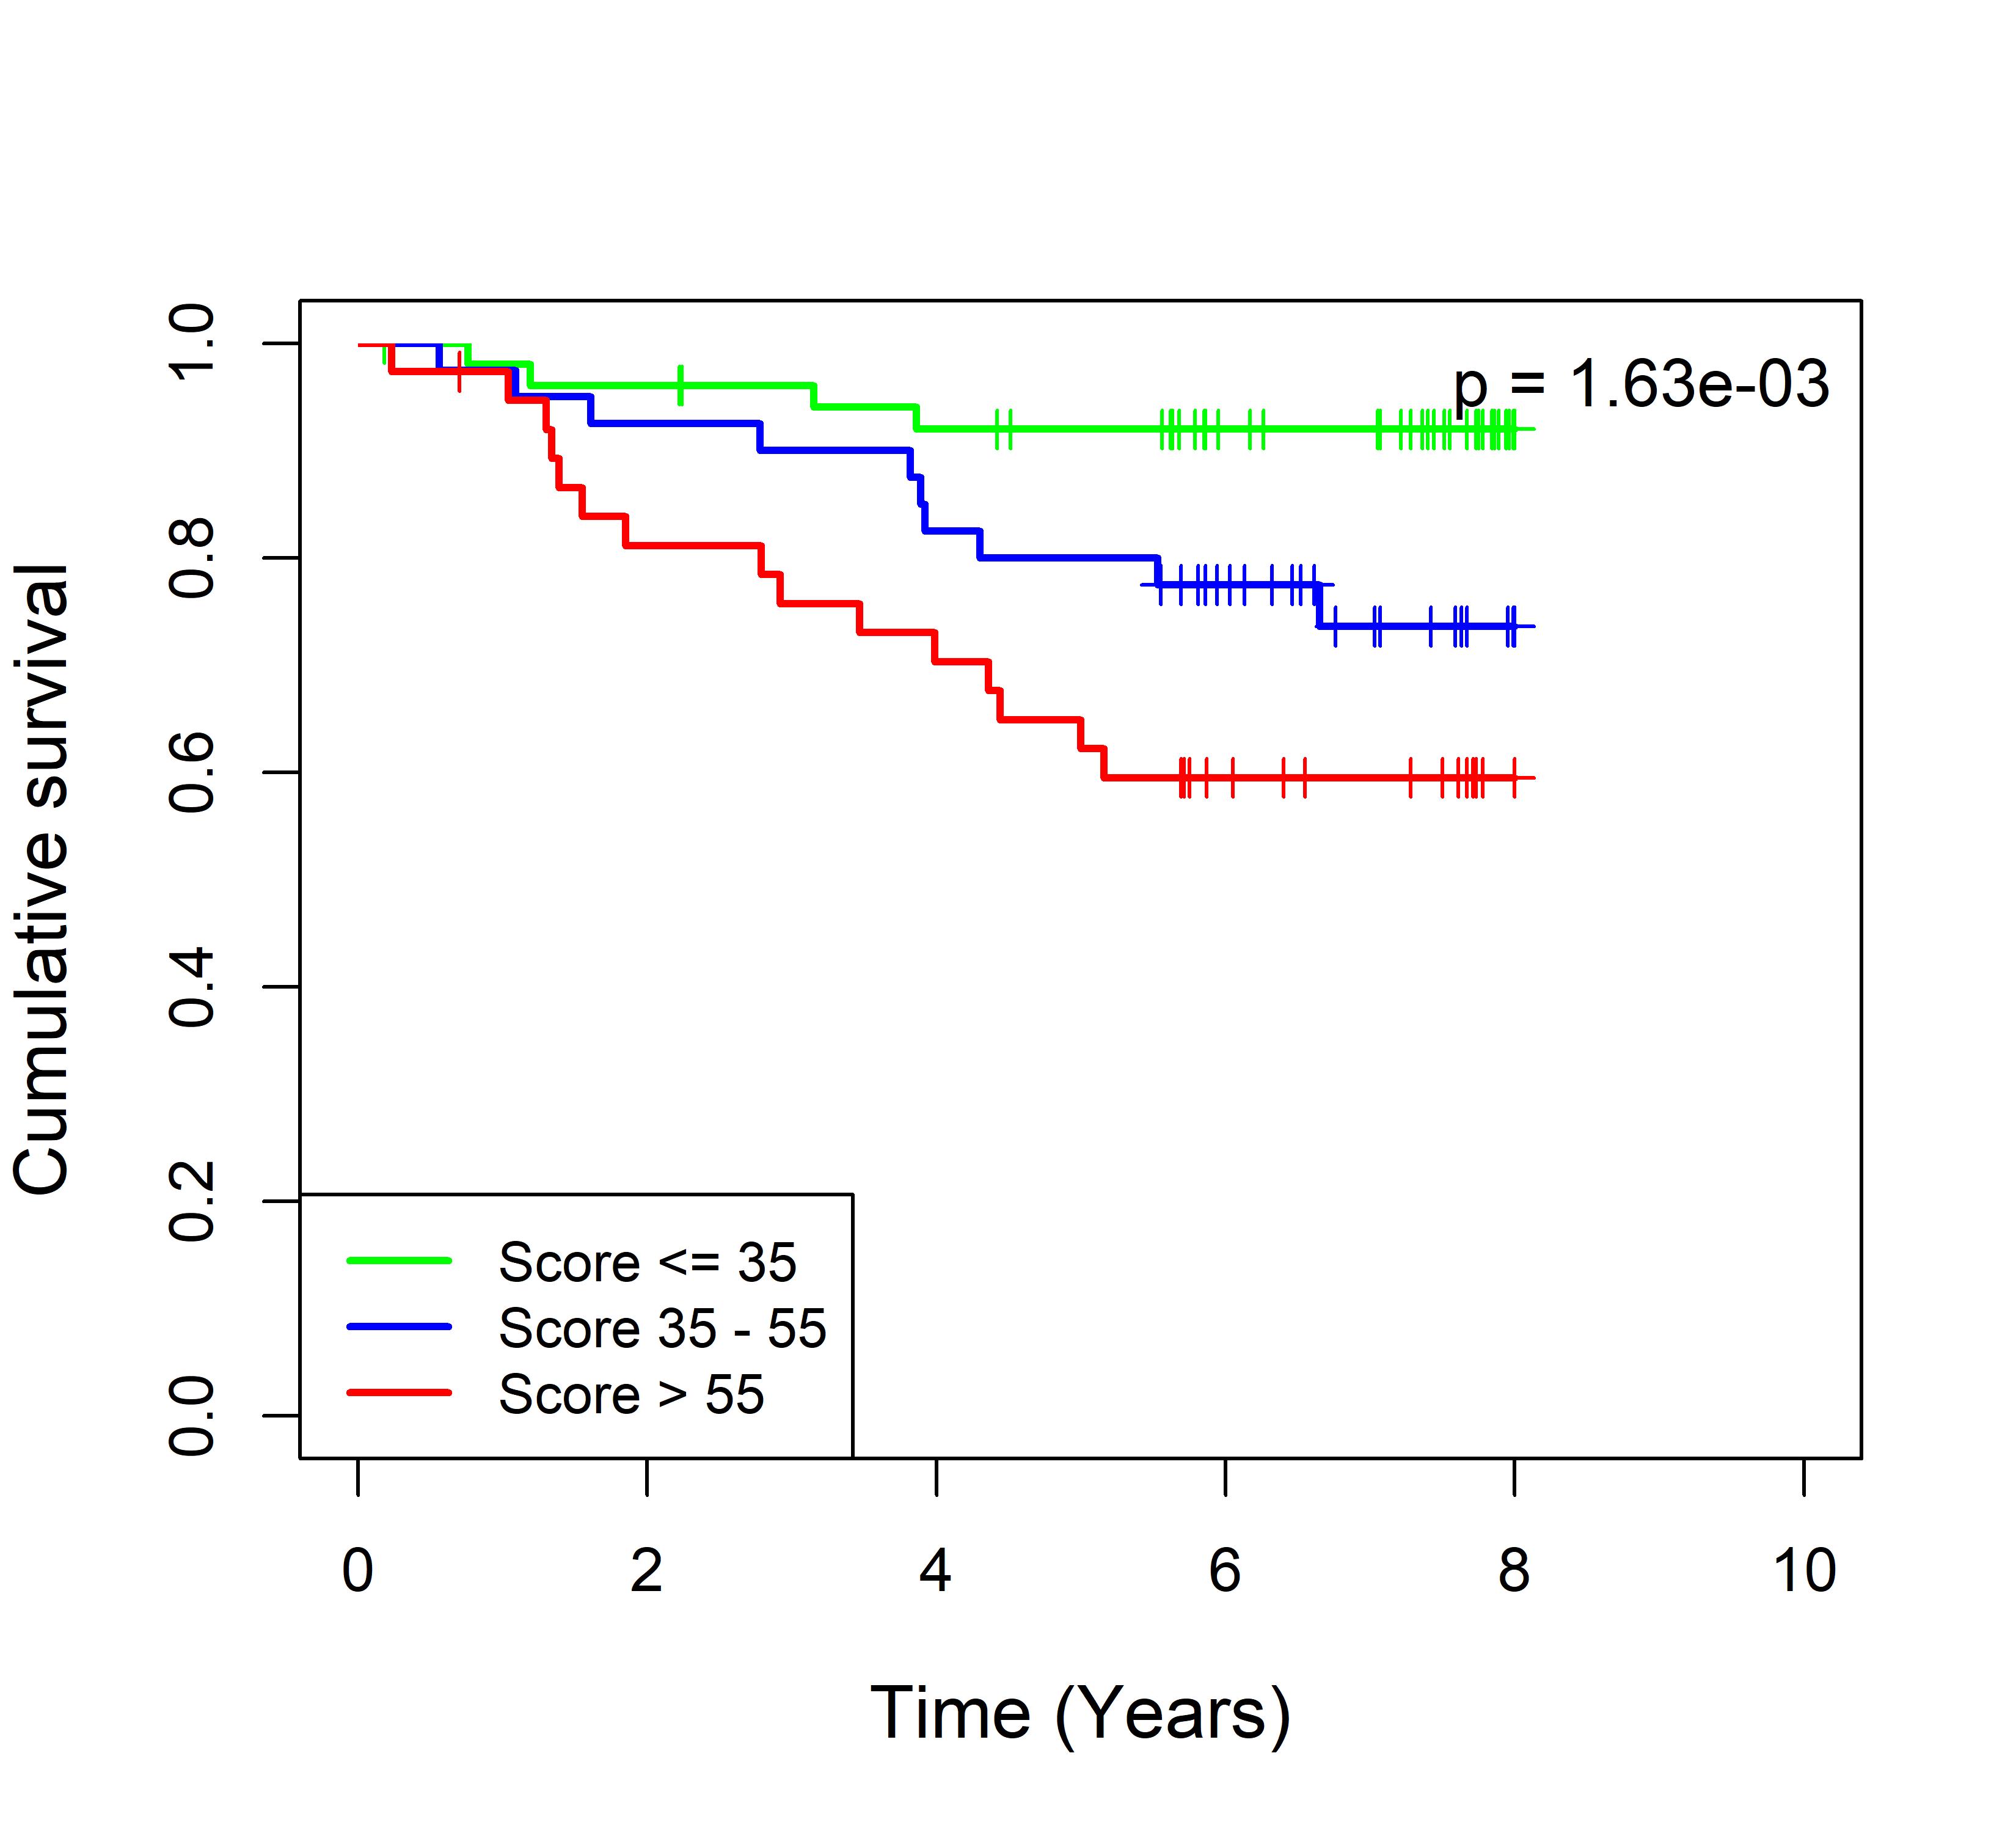
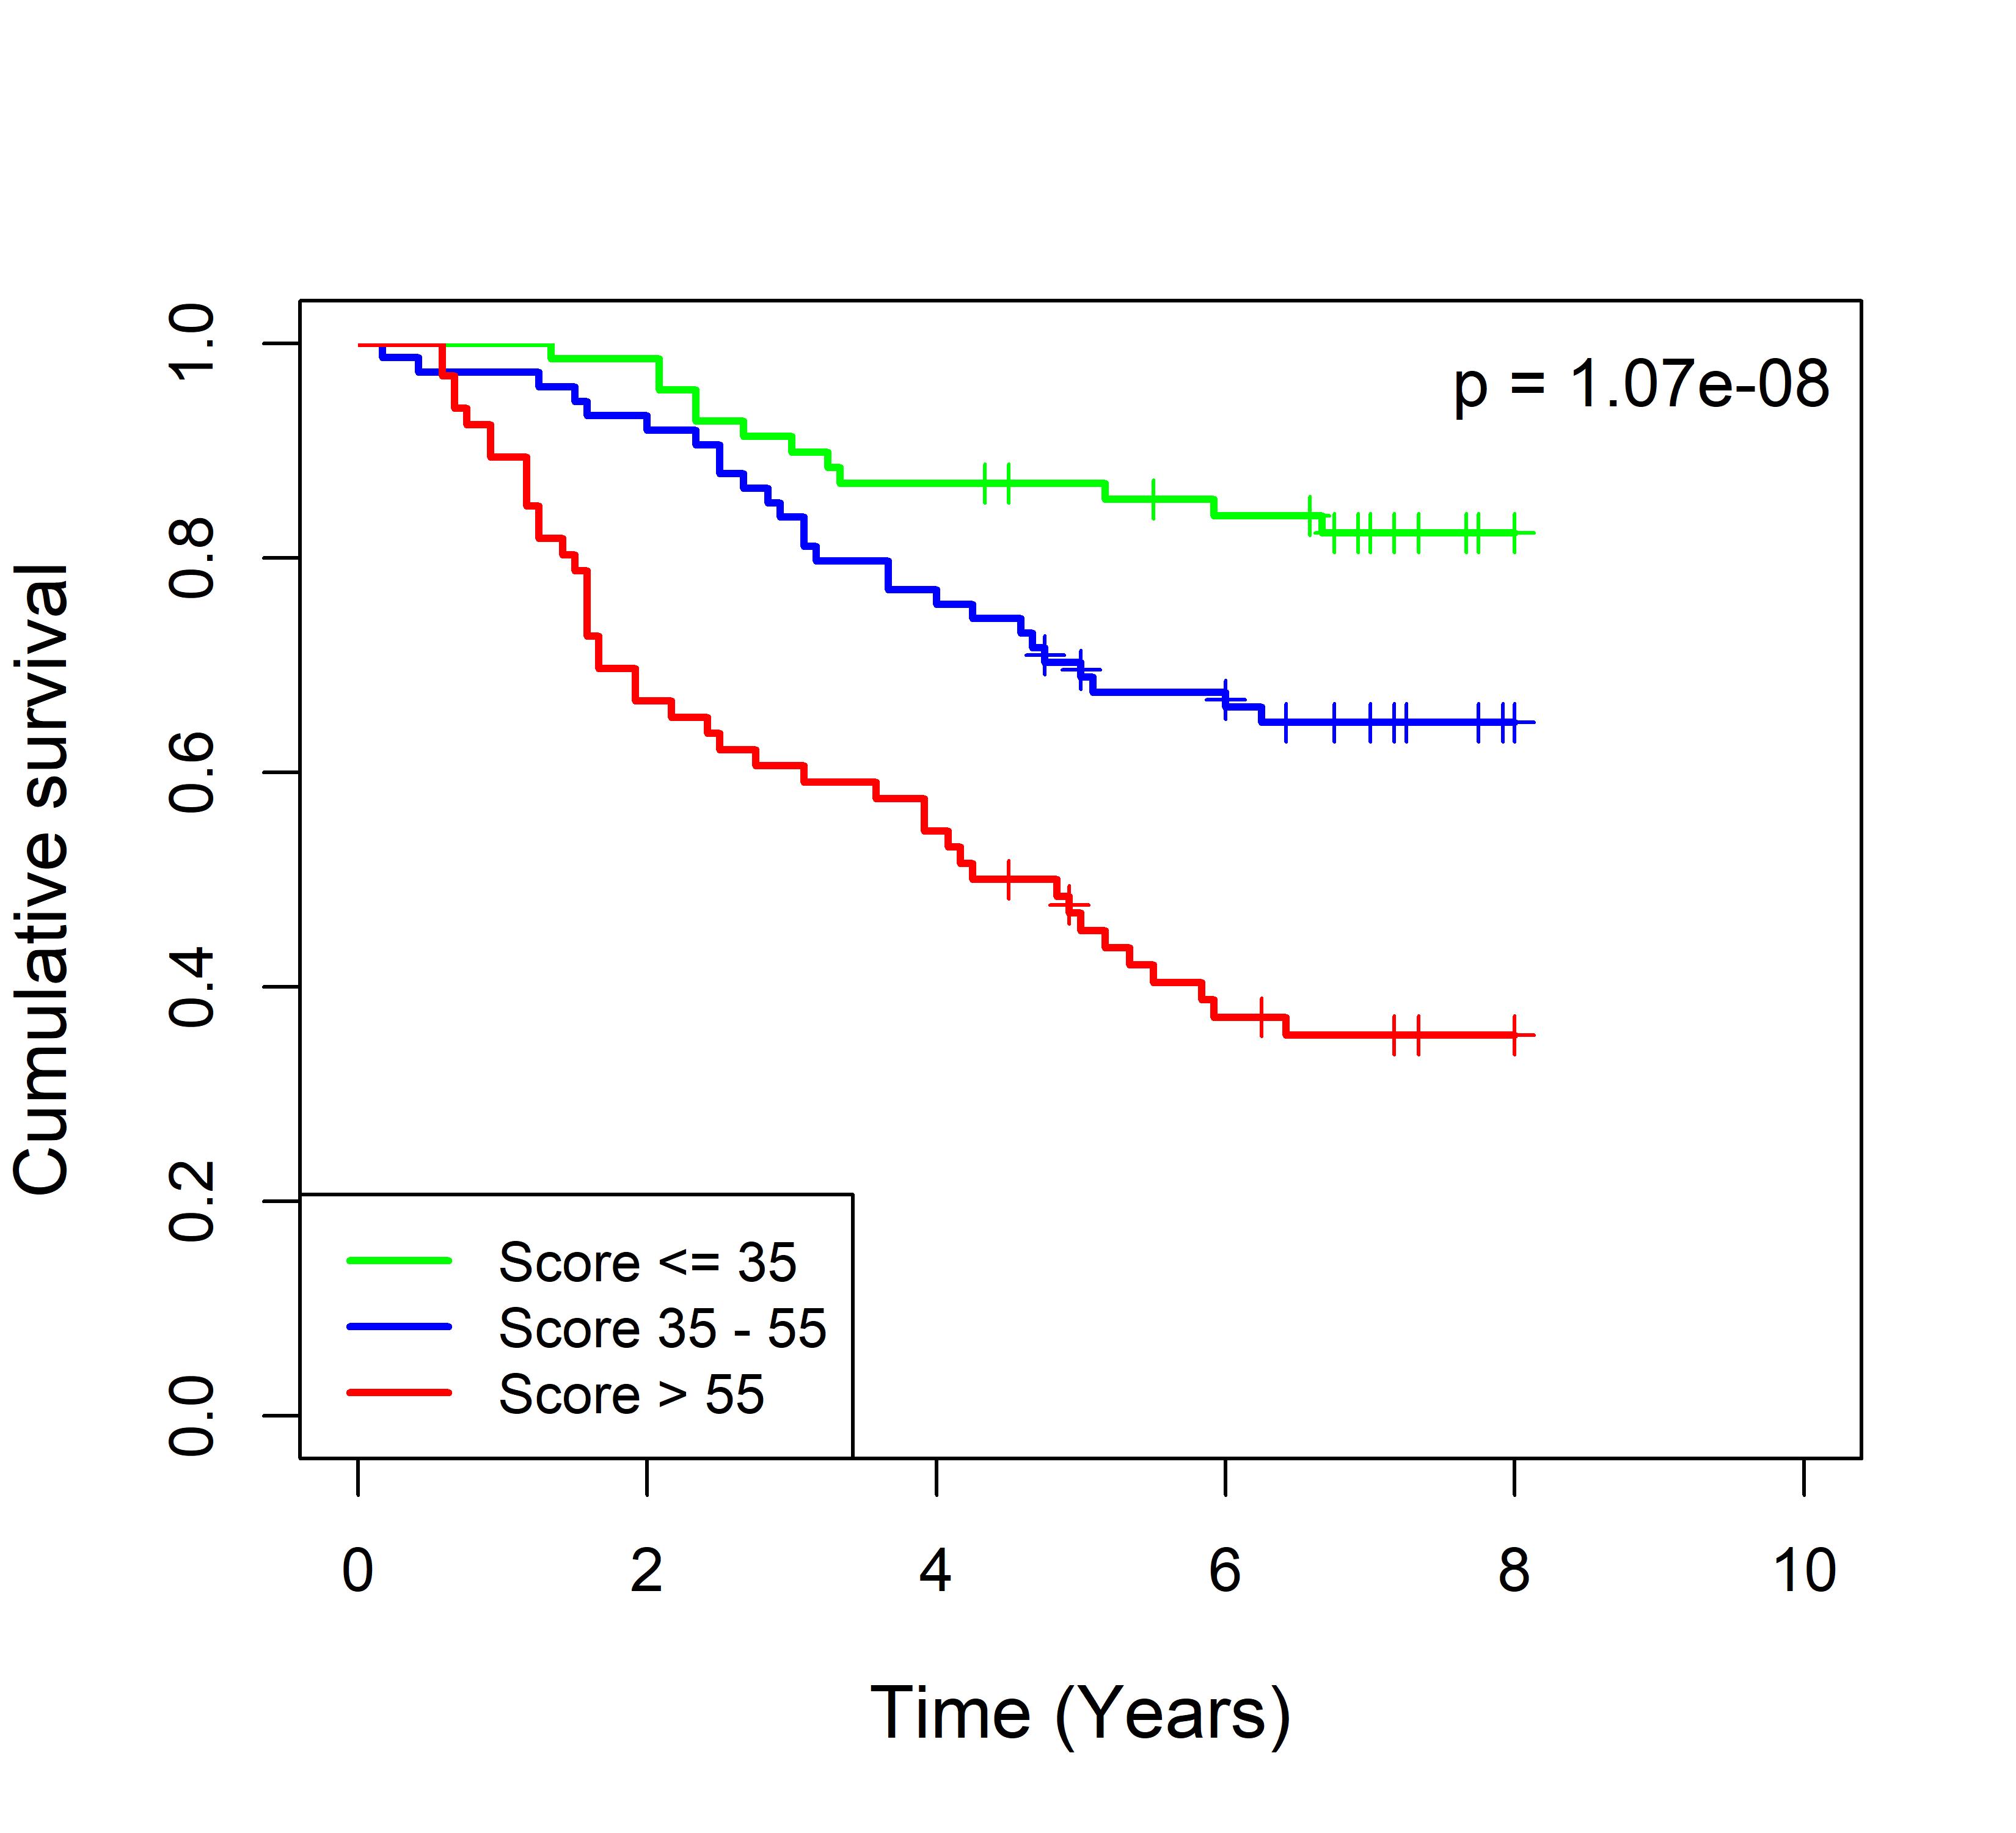
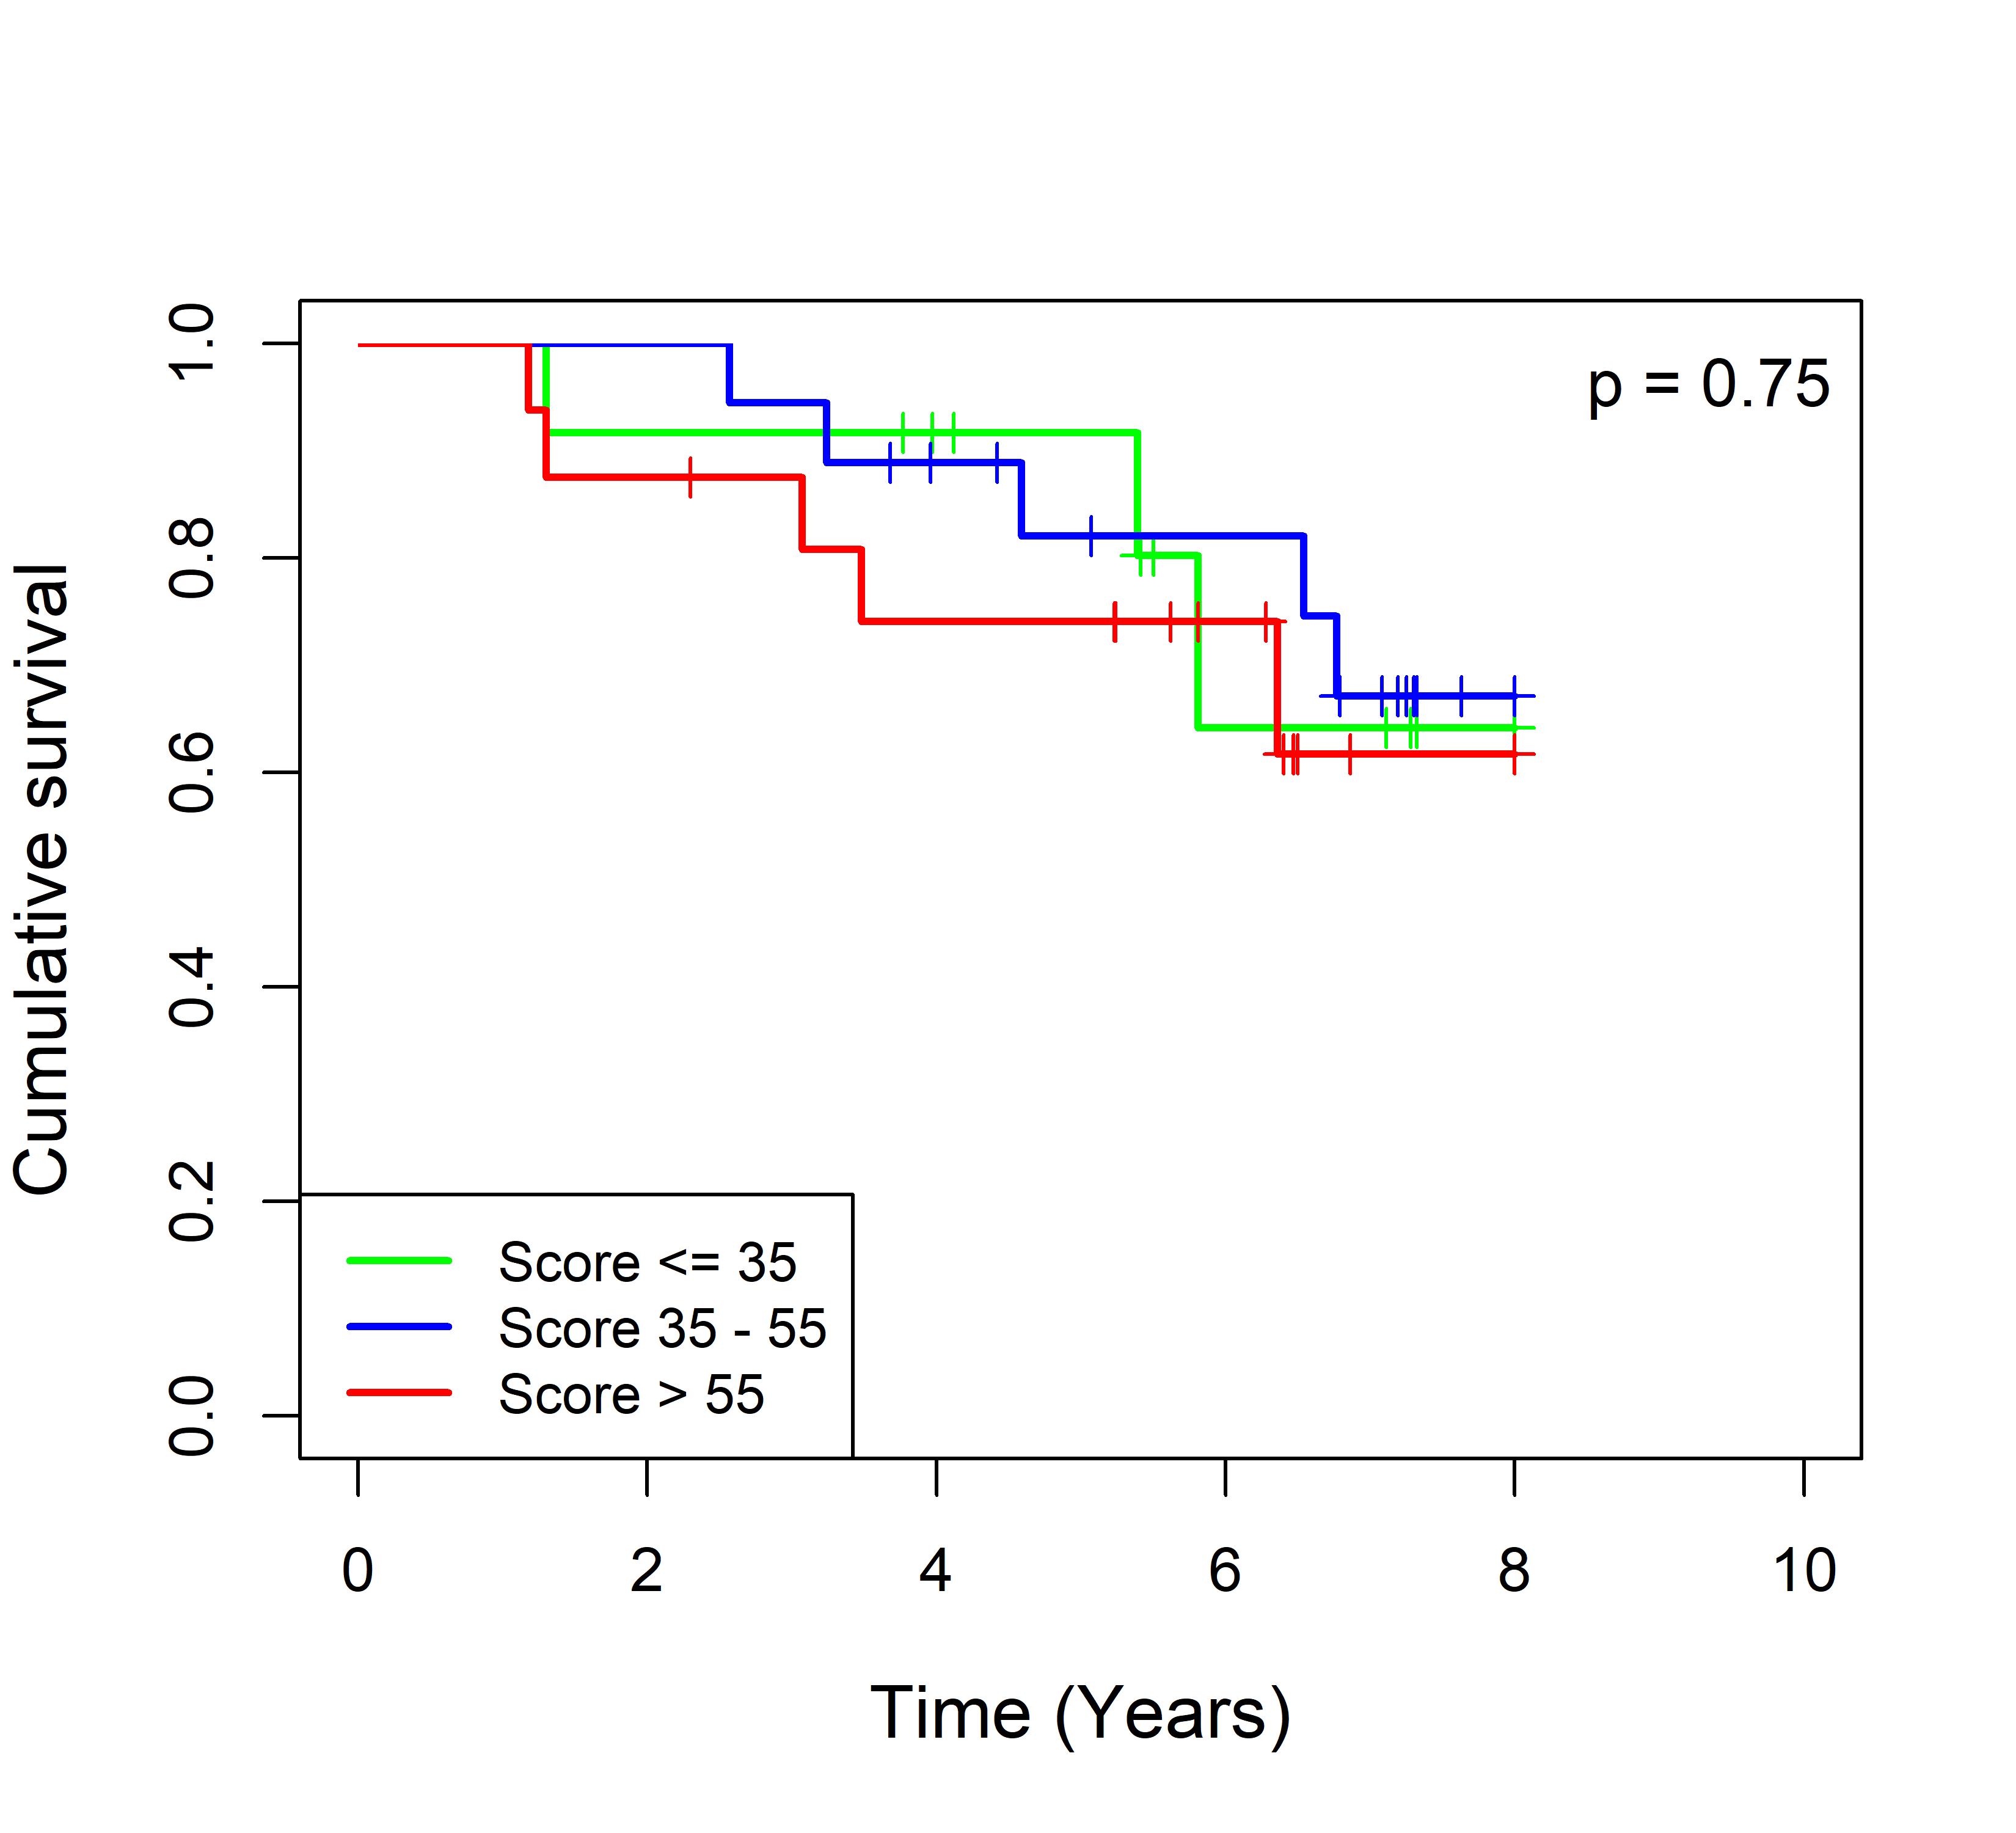
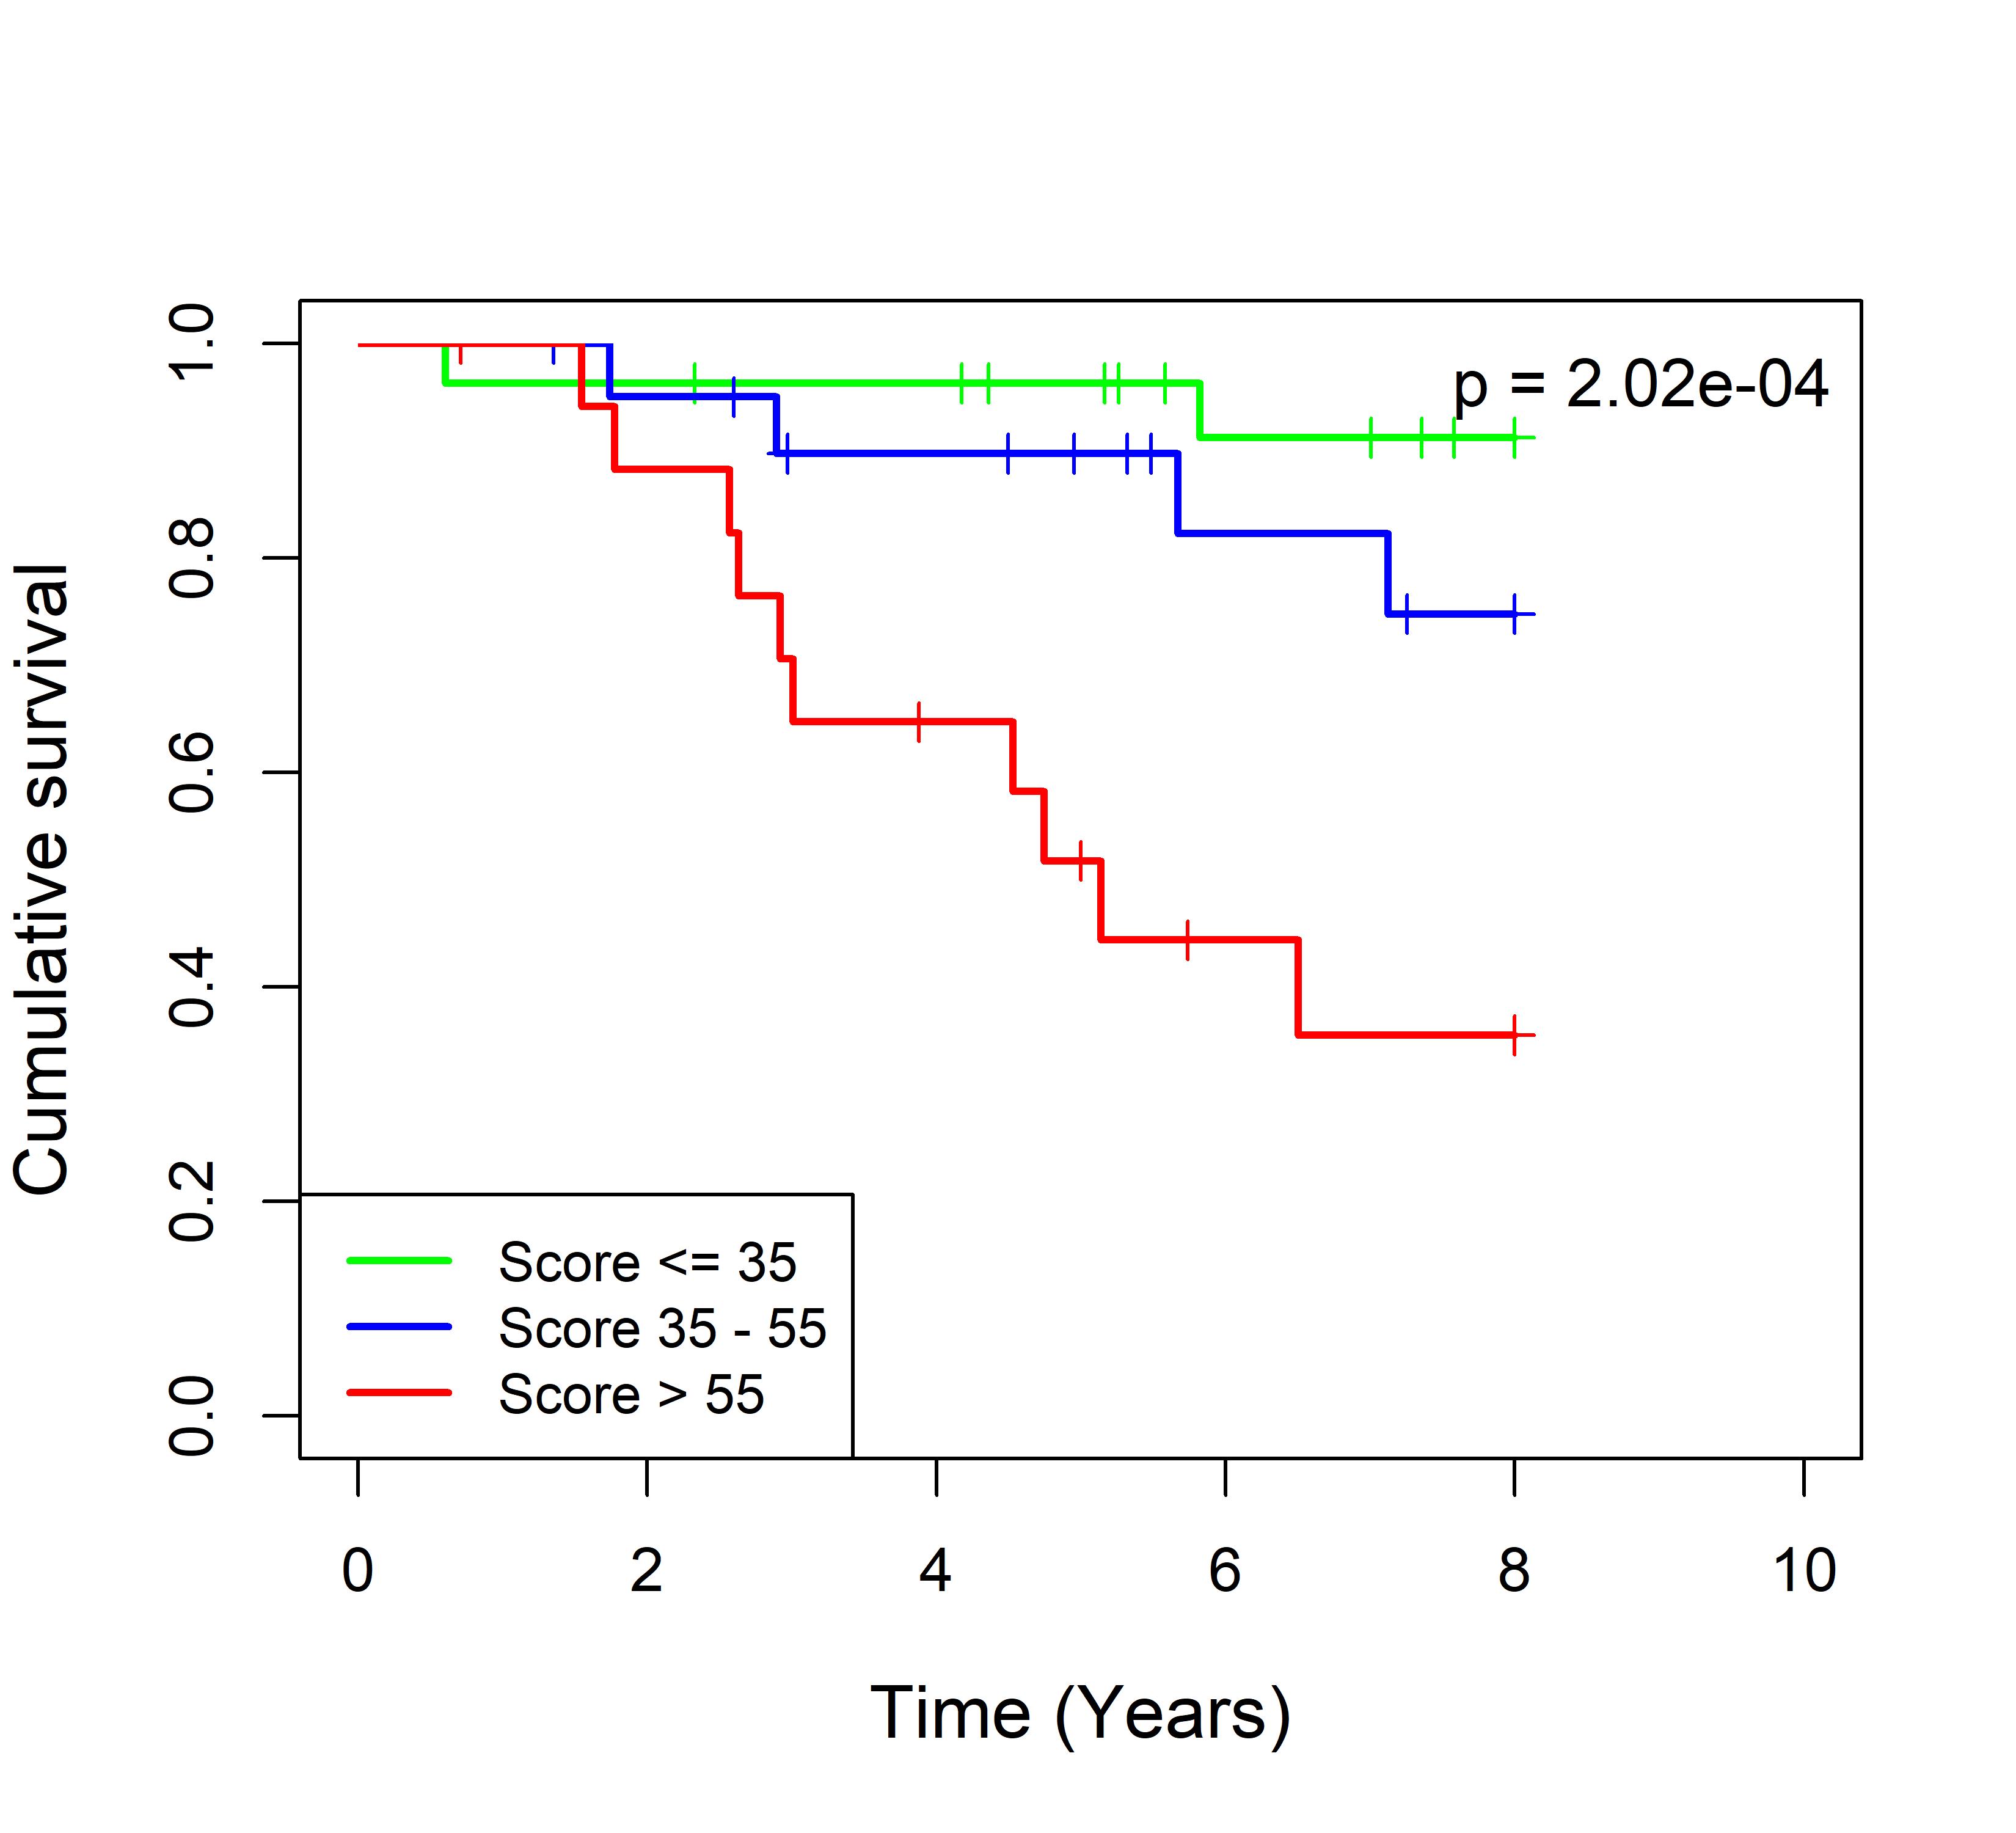
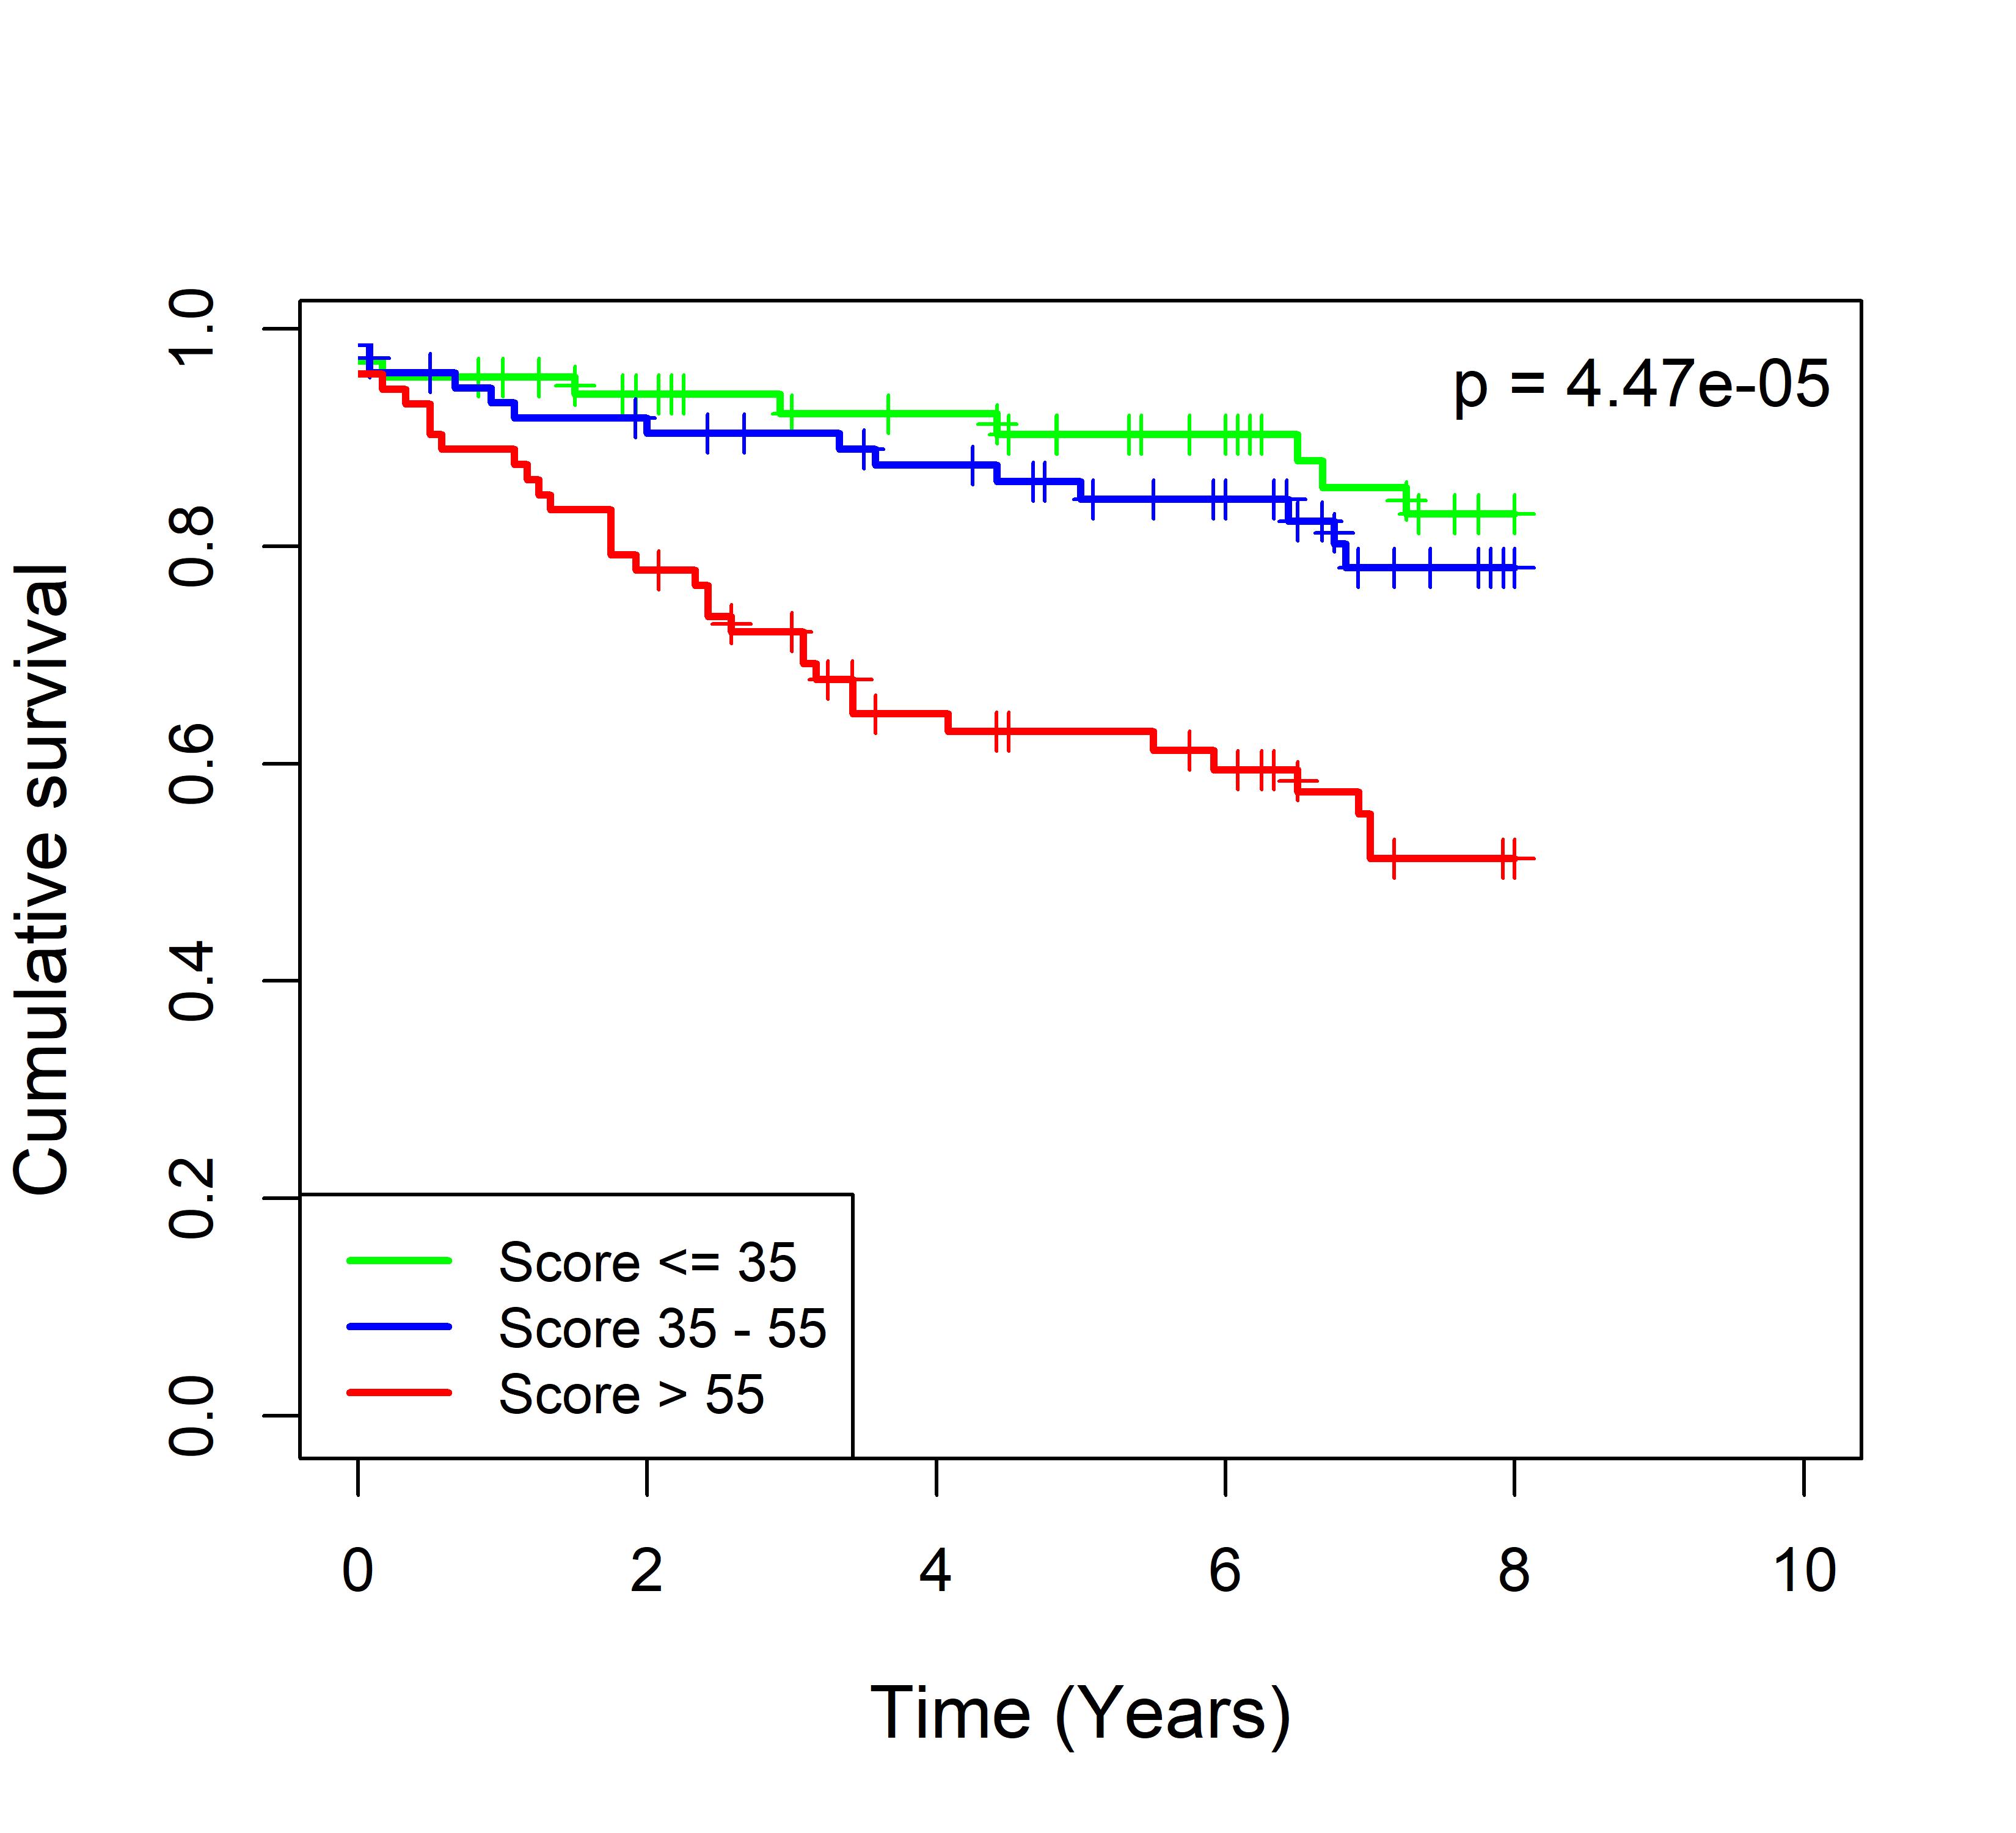
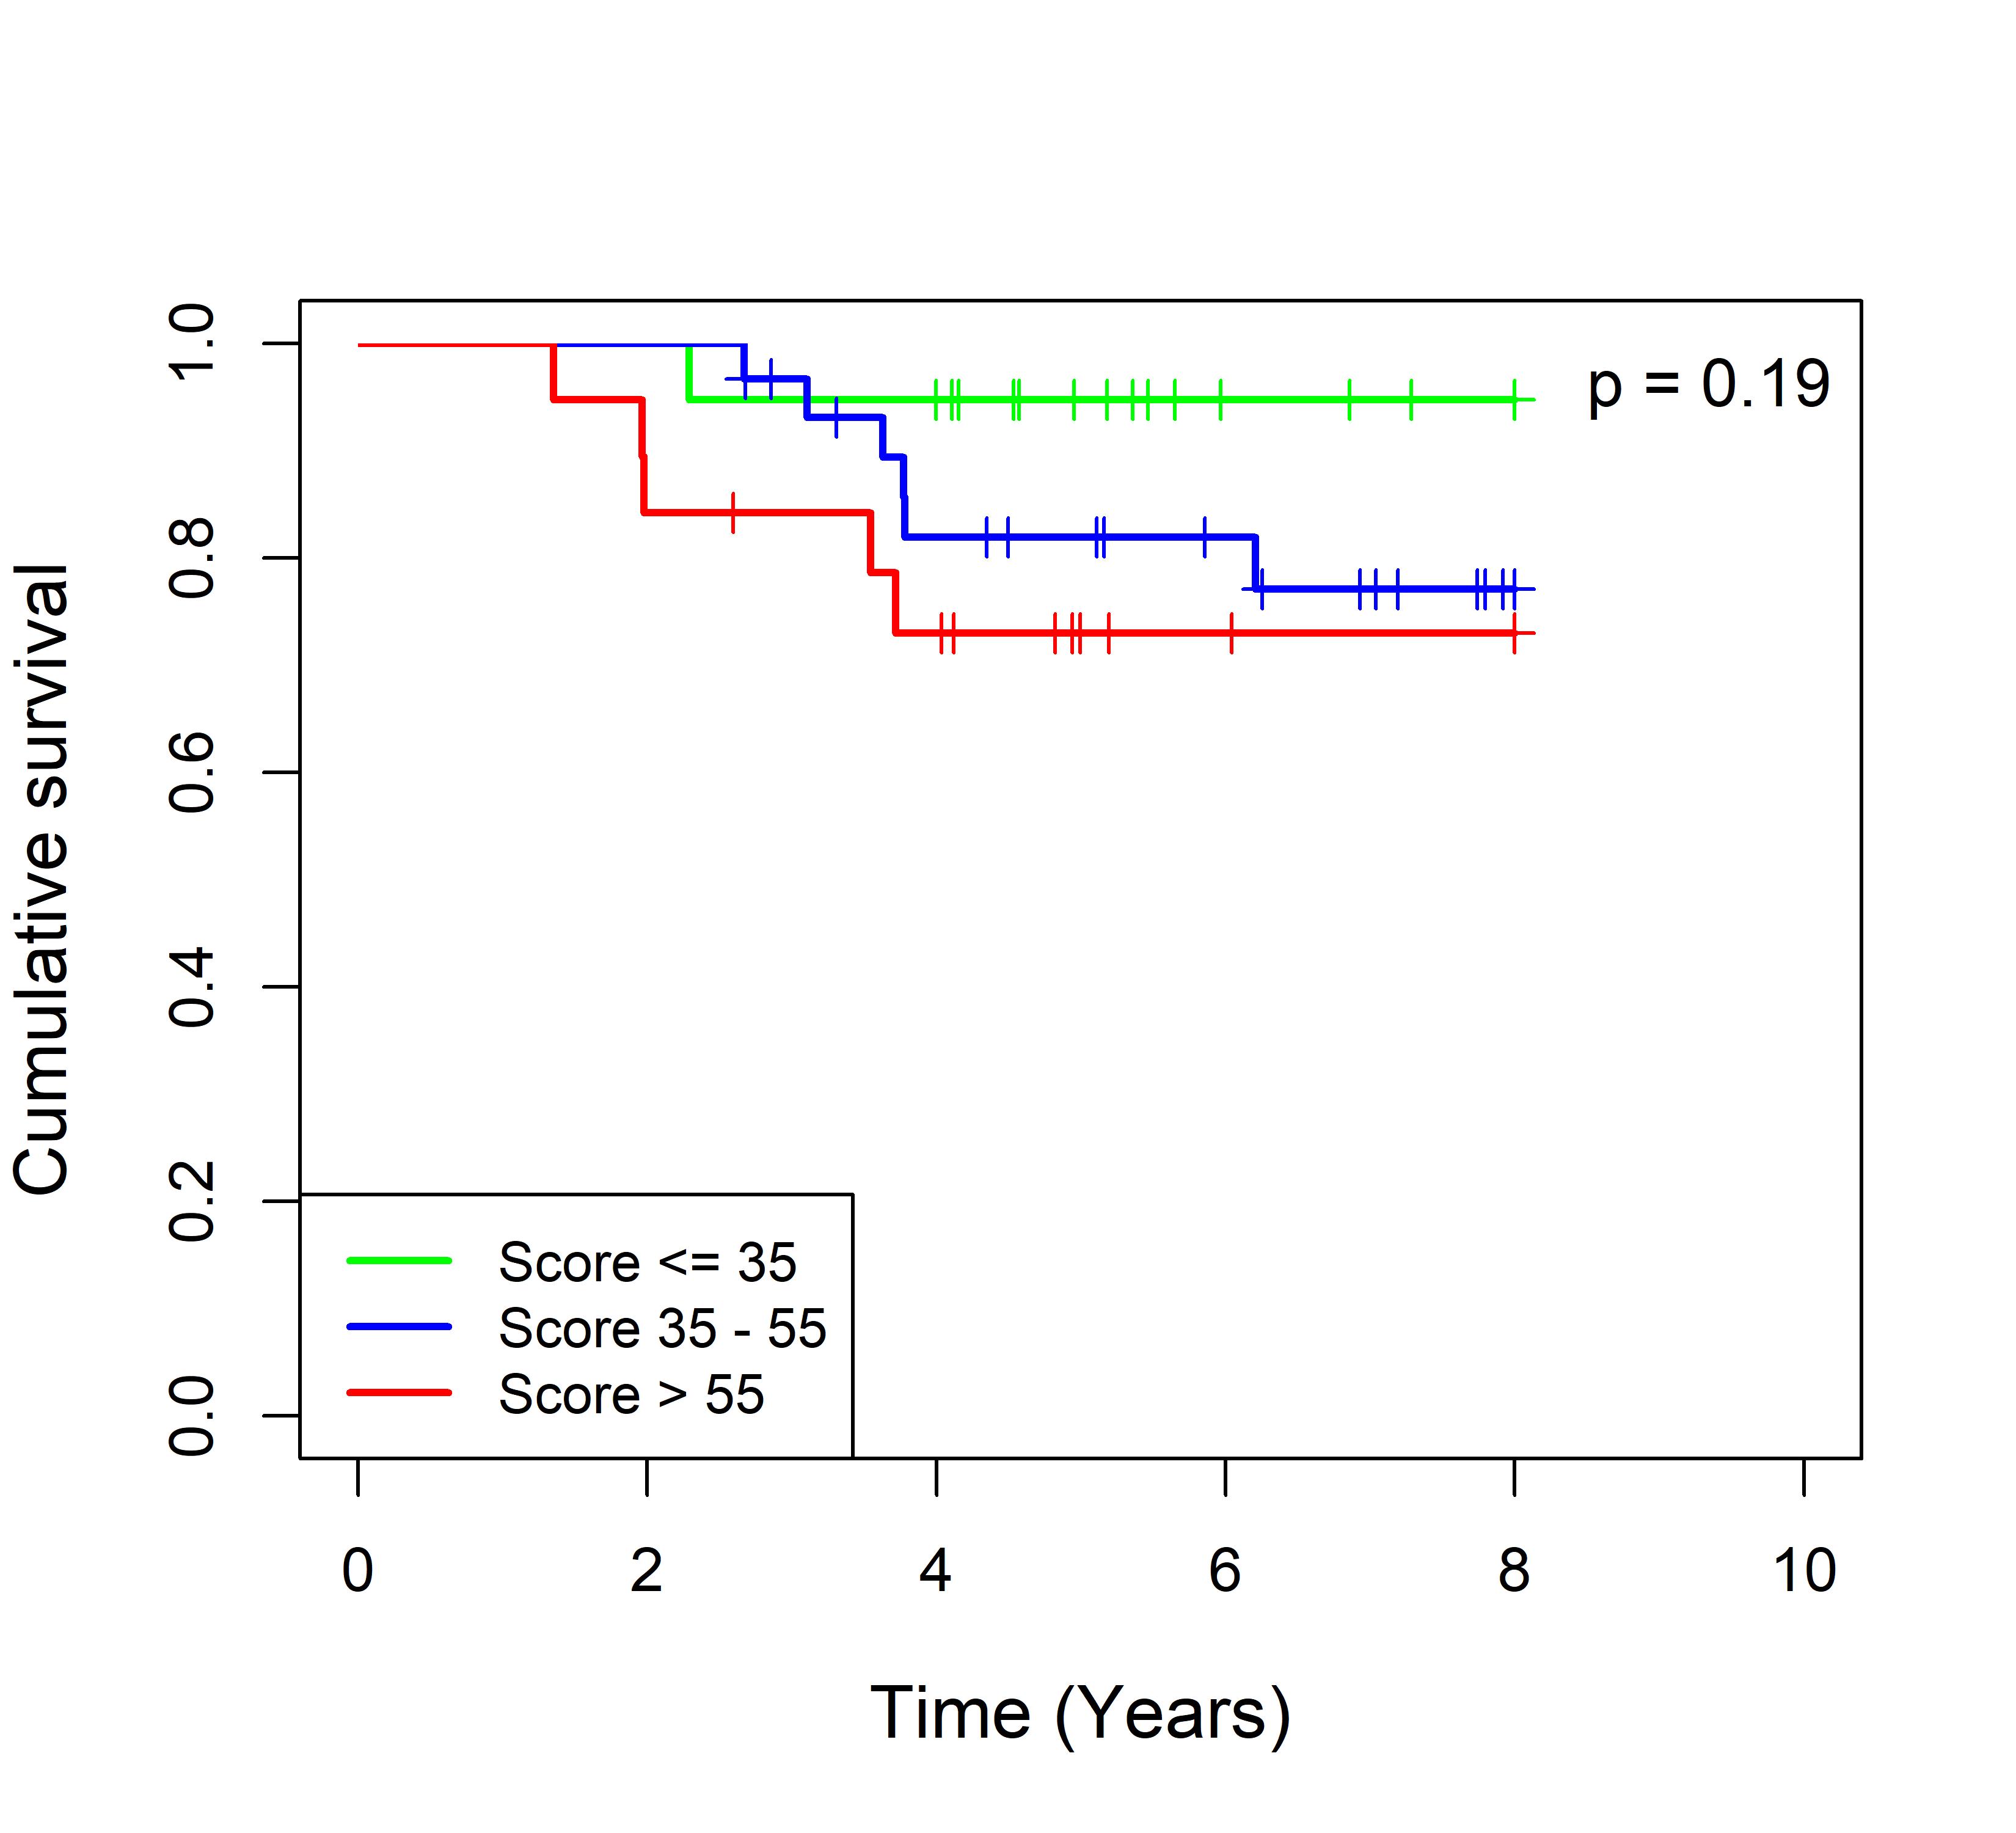
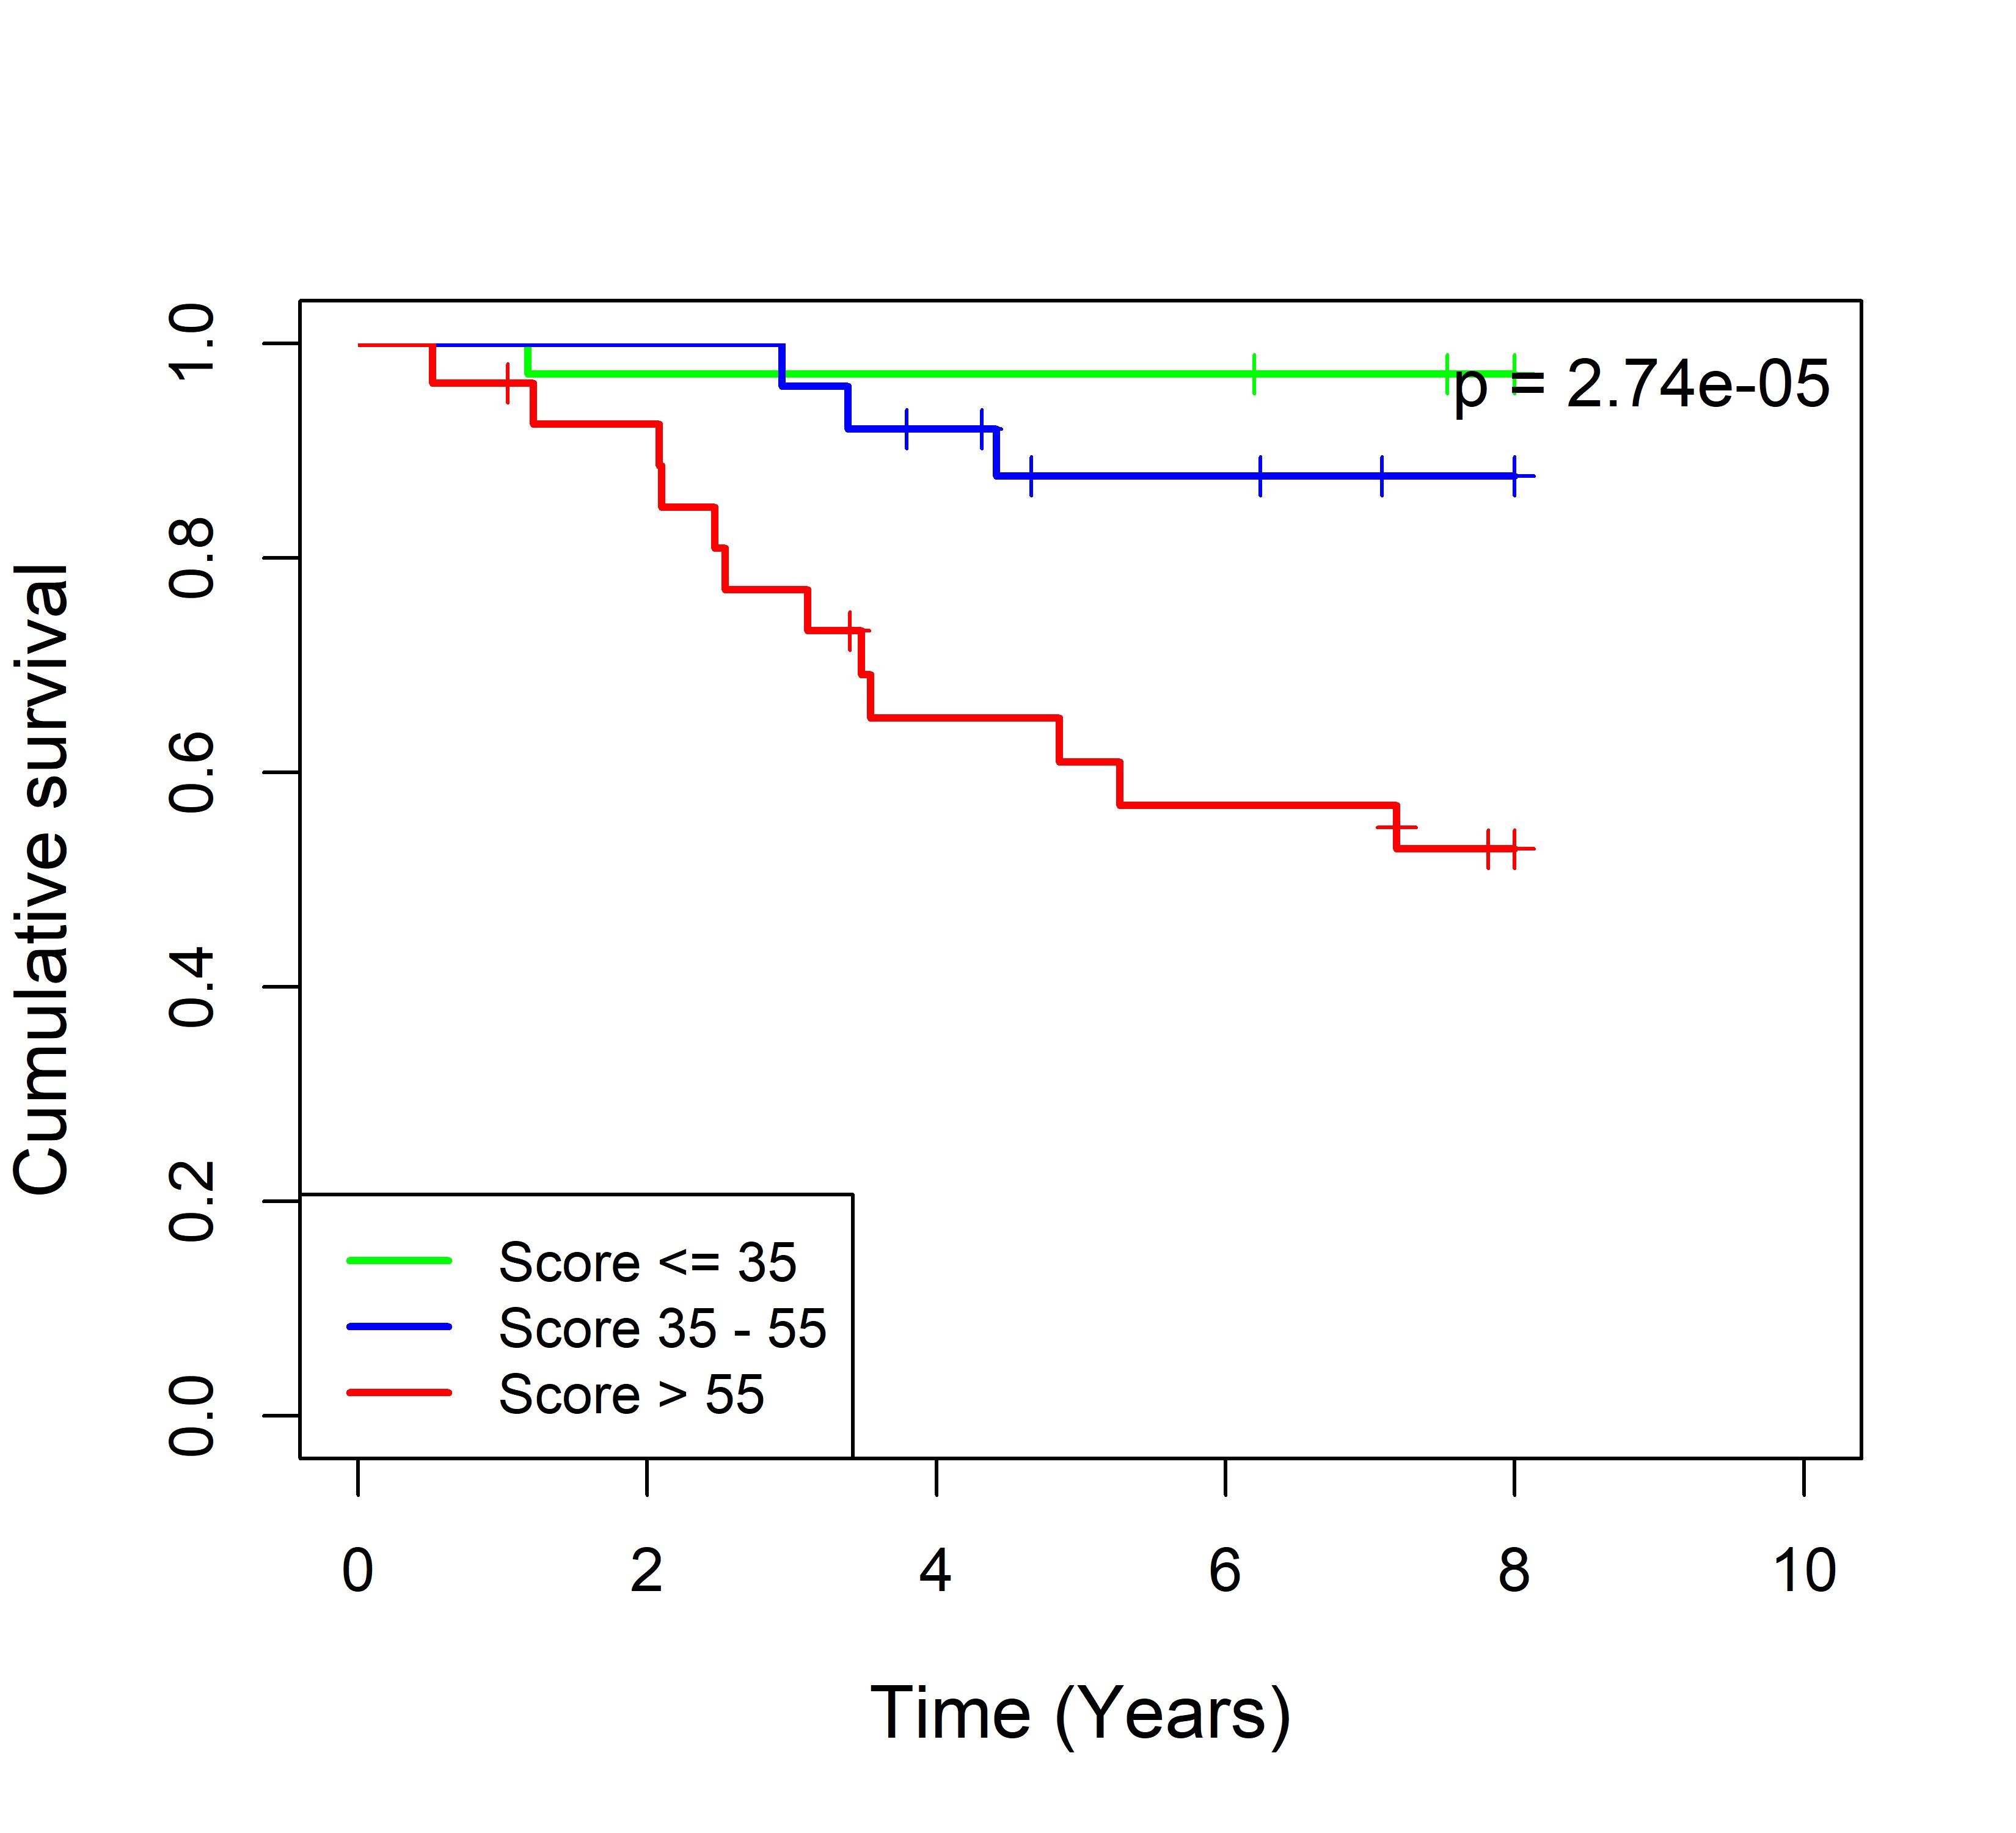
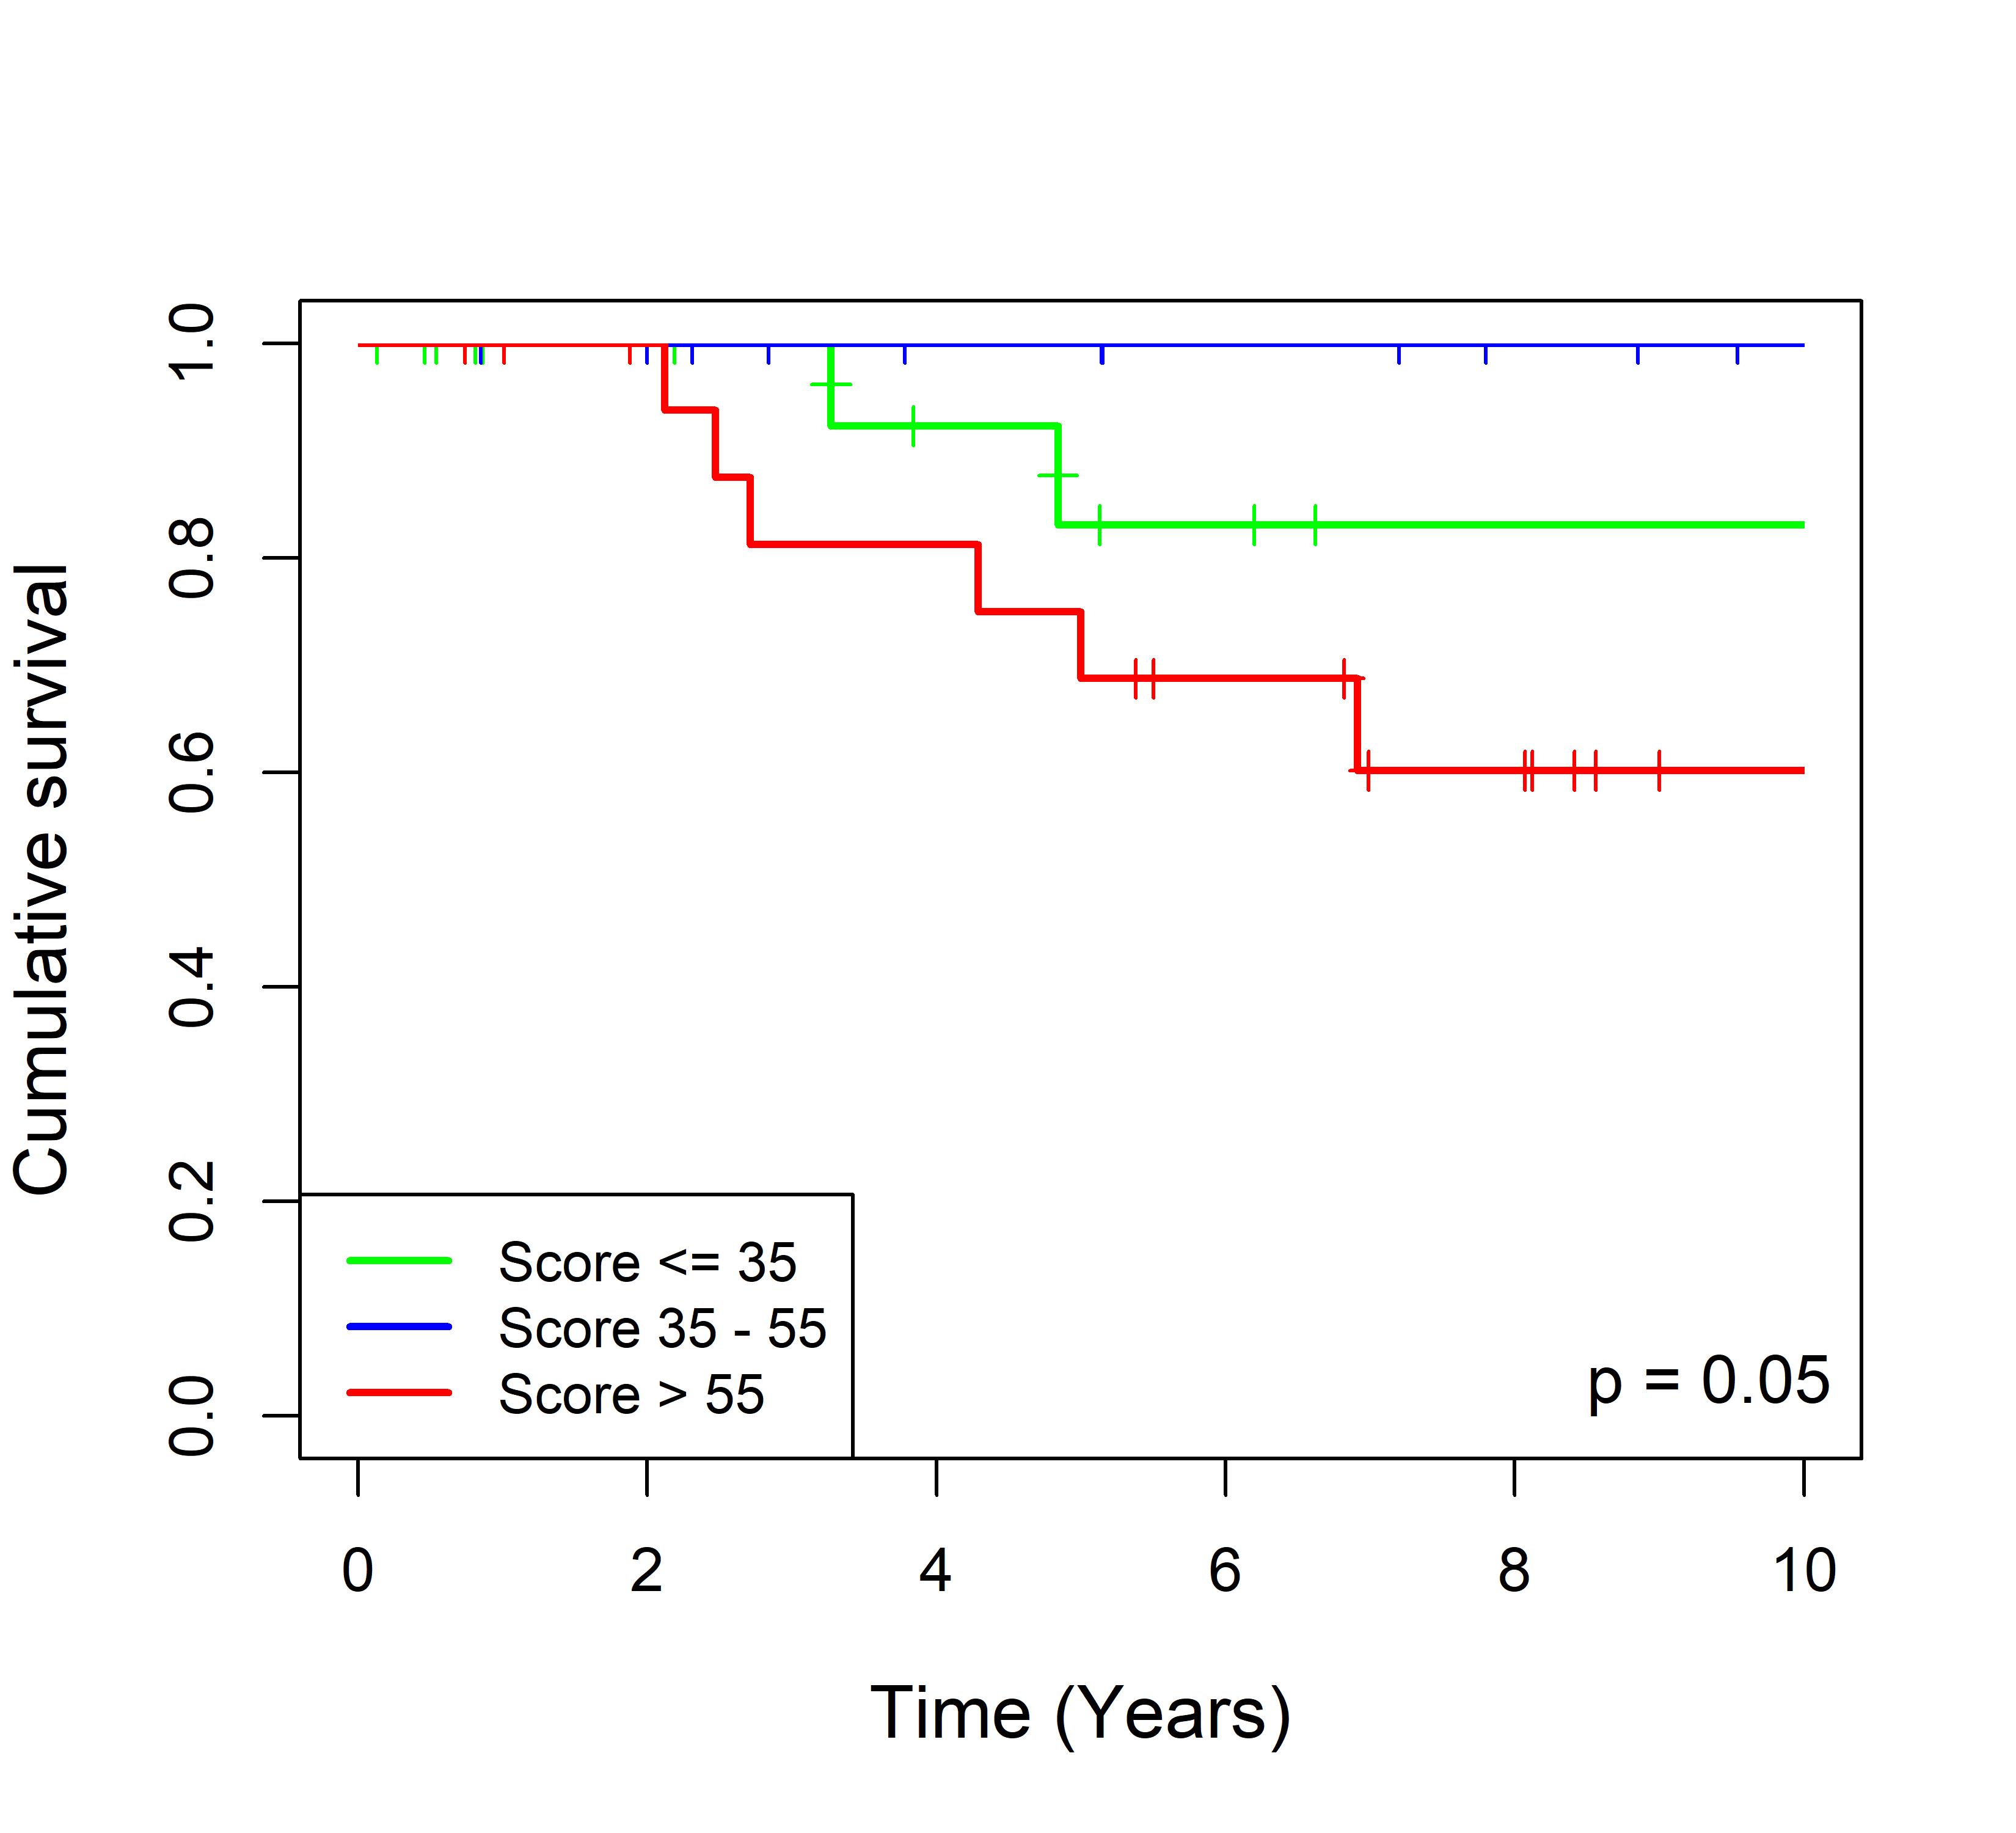
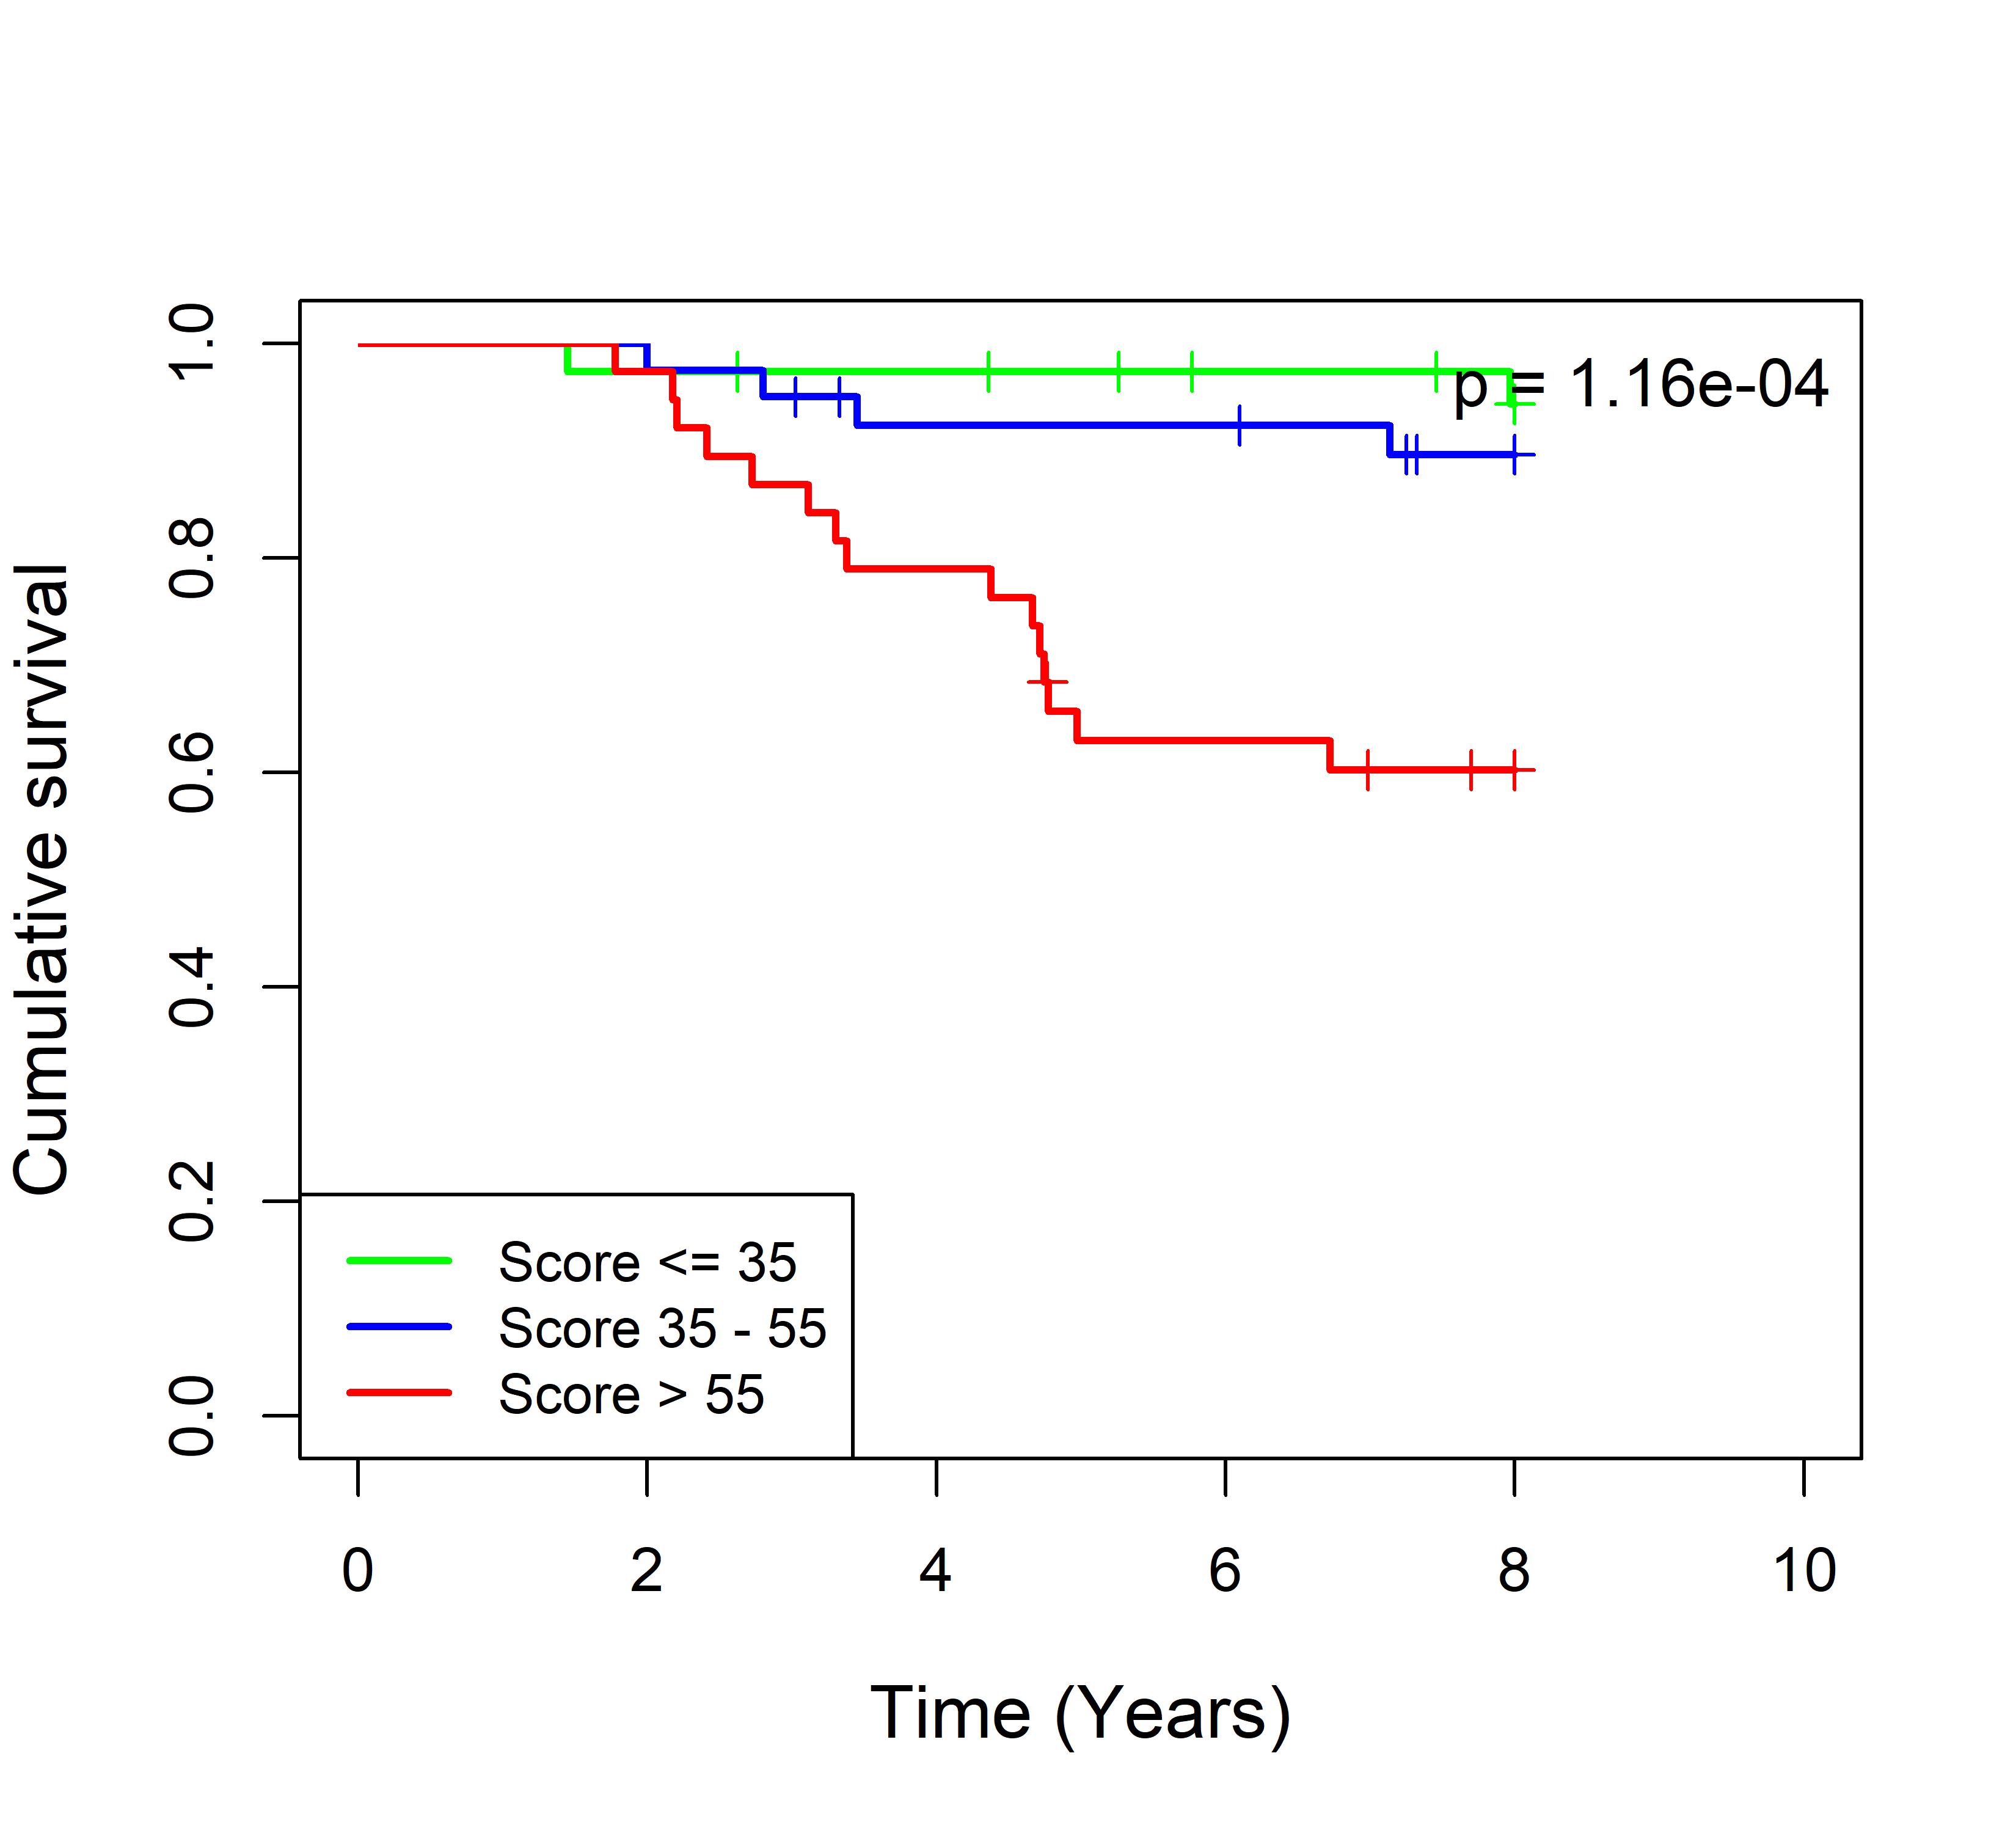
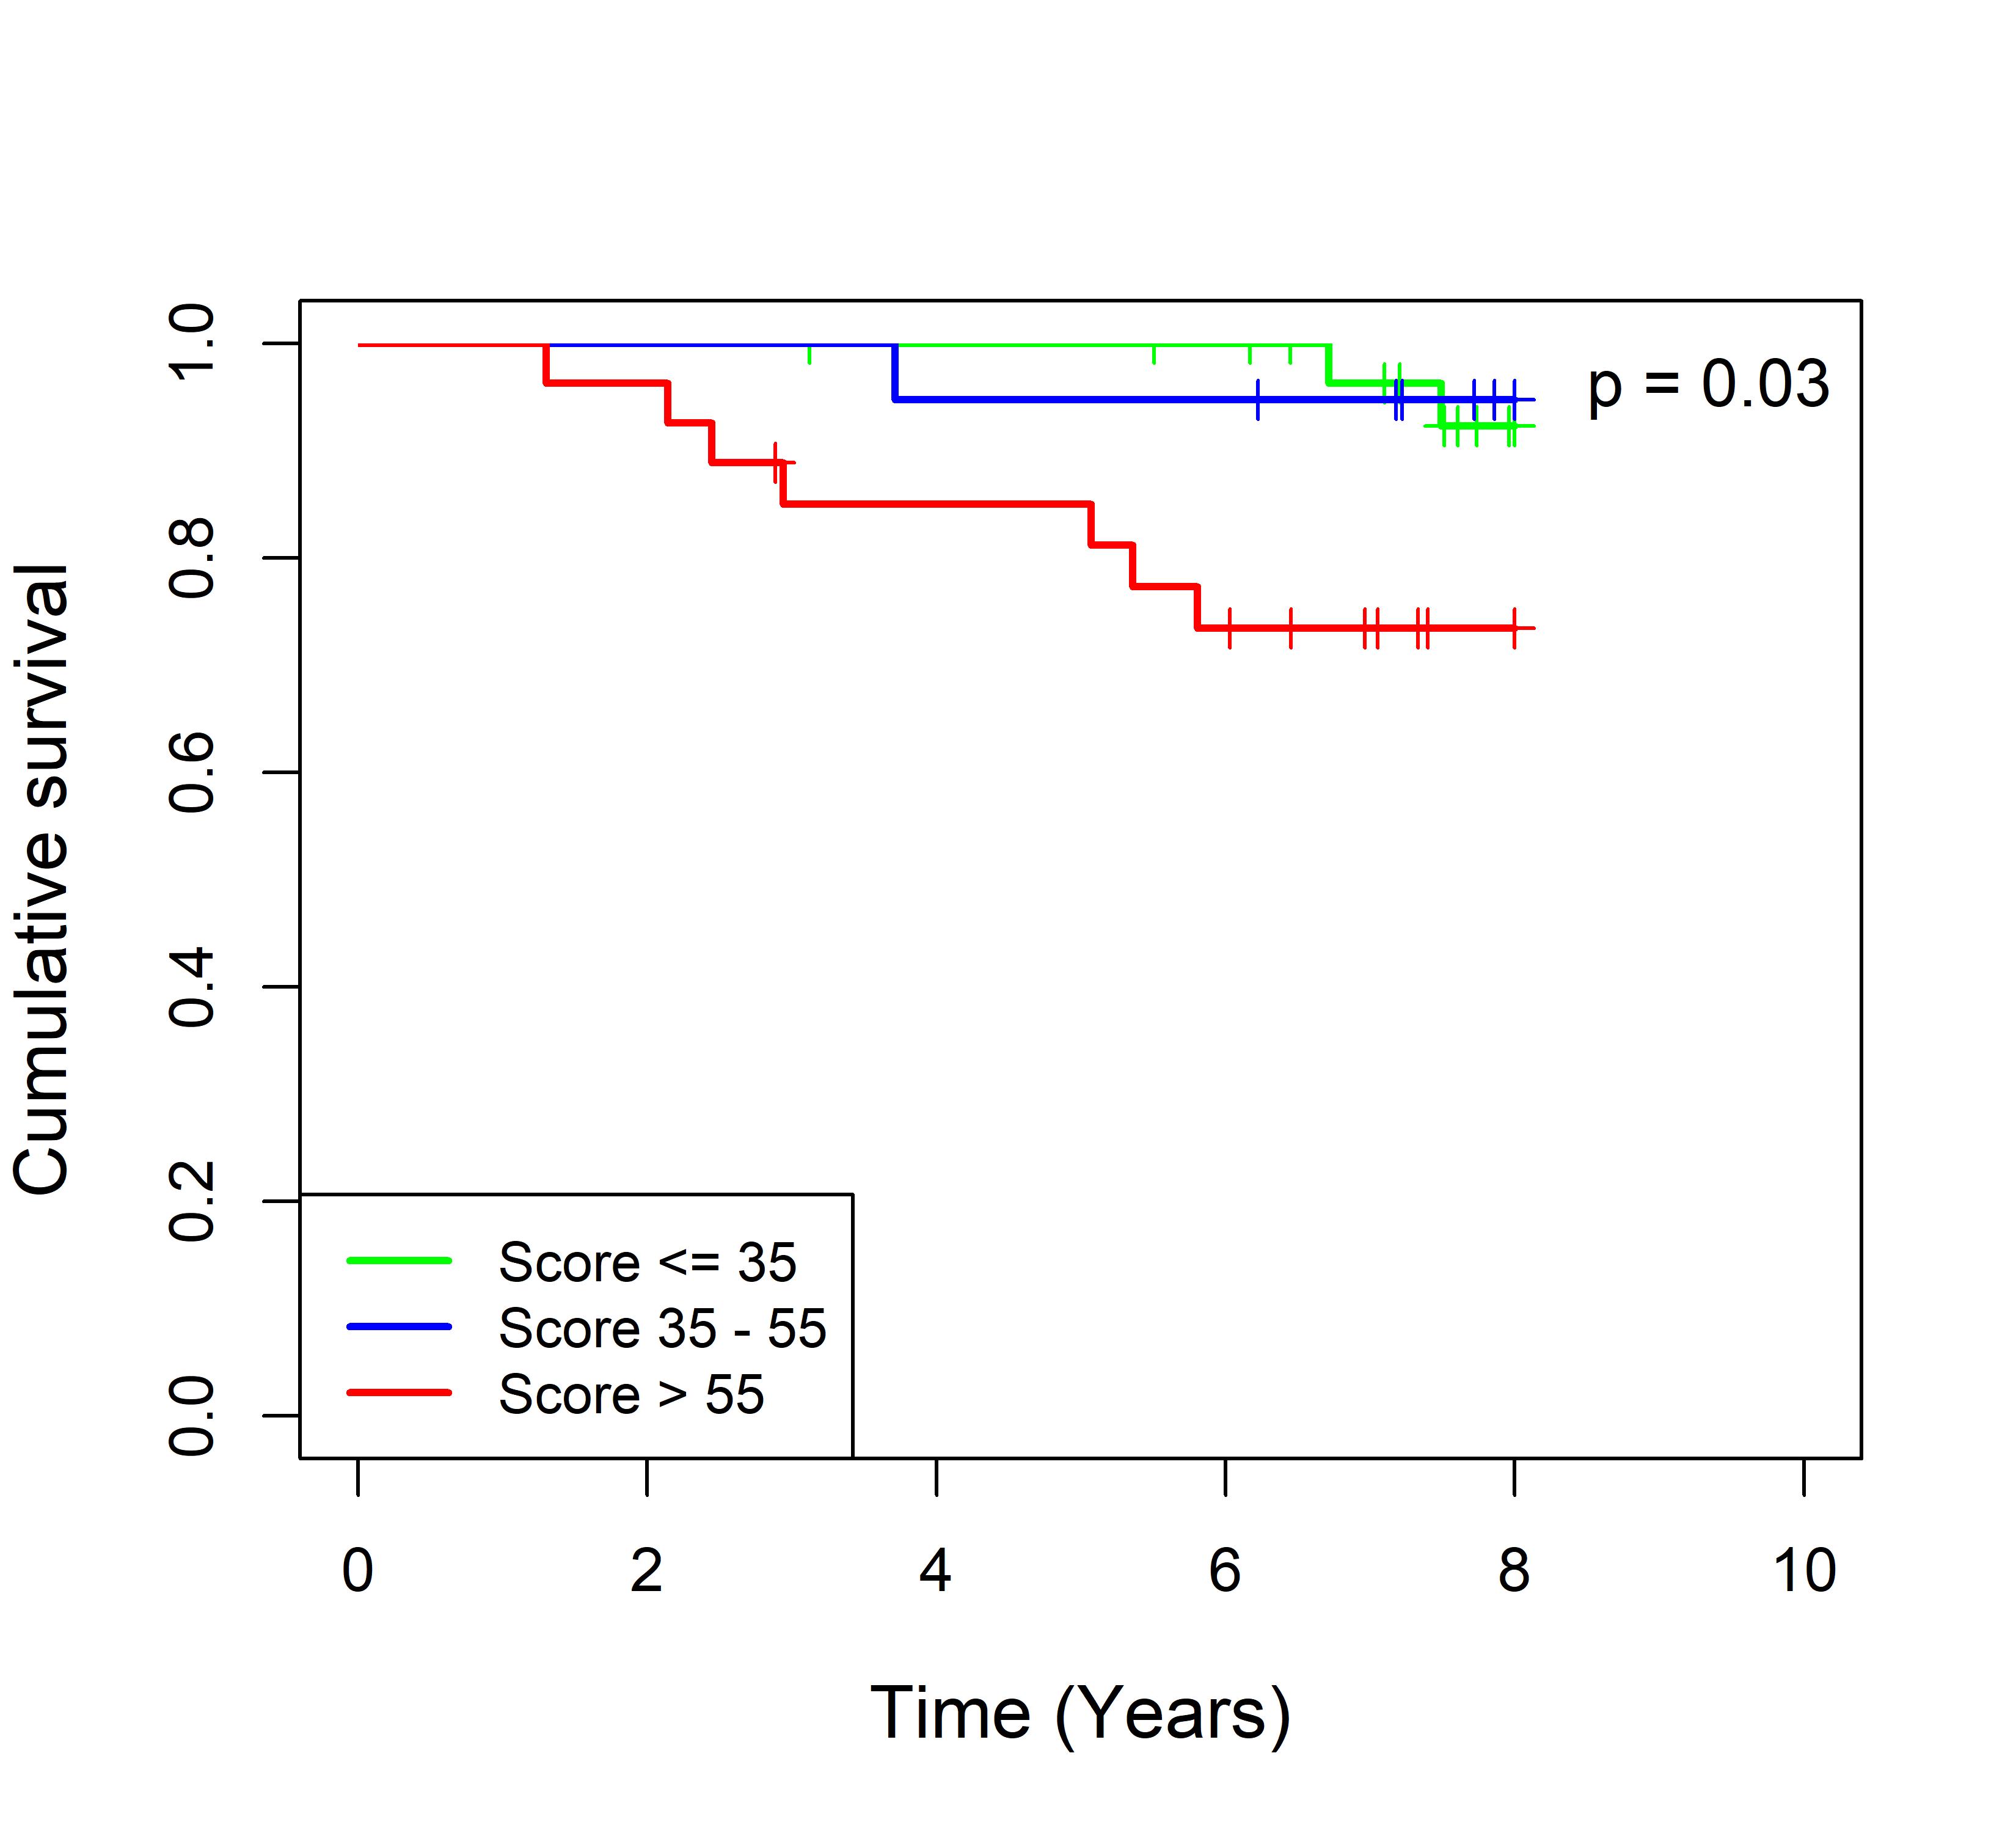
Fig. 8. Association between the Blue_panBC signature score and patient survival in ER-positive breast cancer across 31 TMO-based cohorts. Each Kaplan-Meier plot represents the analysis of a single, independent cohort. We developed an algorithm to calculate absolute Blue_panBC score signature scores independently of cohort-wide data. This enables direct comparison of scores across TMO-based arrays and allows for the calculation of signature scores for newly added individual samples. All samples were stratified into three groups based on their signature scores: low (≤35), medium (35–55), and high (>55). The cumulative survival rates were then compared among these groups. Data for the 33 non-TMO ER-positive breast cancer cohorts is presented in Fig.9.